NOAA URMA analysis, virtual validation report
This dataset validation report plots a sample of values from the NOAA URMA analysis, virtual dataset over time and across space, comparing where possible to a previously validated reference dataset. It also reports the quantity of unavailable values and their associated timestamps. These analyses are one layer of a multi-layered dataset validation process we perform at dynamical.org and also provide users a preview of the dataset contents.
Report generation start time: 2026-10-27T02:24:19 UTC
Summary
This report reviews hourly UnRestricted Mesoscale Analysis (URMA) data from May 2, 2017 through October 20, 2026. Checks compared stored data with source files and tested samples of their values. The notes below describe gaps and interpretation limits; not every value was checked.
What looks good
- All 1,146,611 links to source data across 14 variables matched independent source-file checks.
- Independent value comparisons covered early and recent data, as well as periods when the source changed.
- All 276 sampled fields were readable. These checks sample the archive rather than test every value.
Review notes
- There are 121 missing hourly source files across 14 dates. The expected analysis files for this expanded geographic area are absent from the National Oceanic and Atmospheric Administration (NOAA) public archive used here; the reason is unconfirmed. Missing files in this archive do not establish that NOAA failed to produce these analyses. See the exact missing hours.
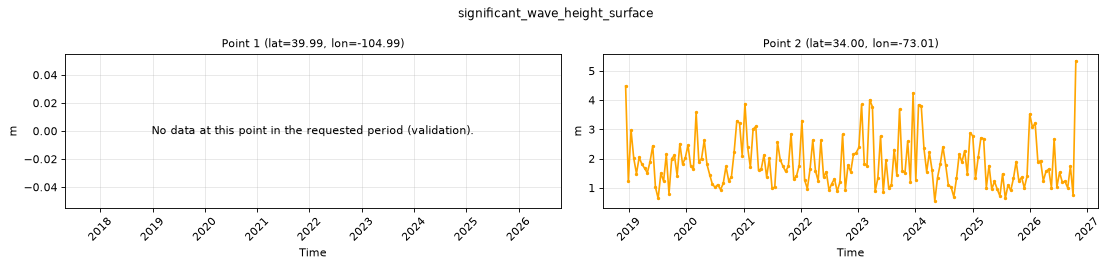
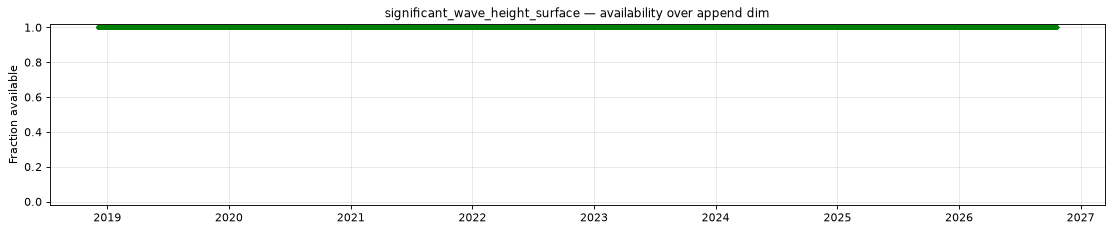
- Wave height starts on December 3, 2018 at 12:00 UTC. Earlier source data used zero for both land and calm water, so those fields are deliberately excluded.
- Great Lakes wave values start on July 27, 2020 at 12:00 UTC.
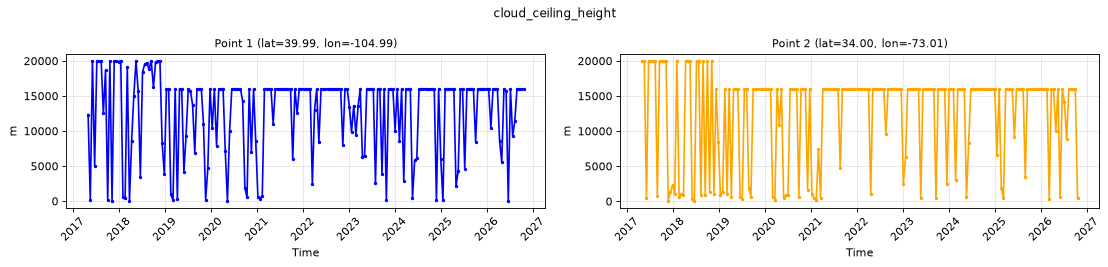
- Cloud-ceiling height and visibility limits change in the checked December 3, 2018 samples. From 11:00 to 12:00 UTC, both maxima fall from 20,000 m to 16,000 m and both minima rise to 1 m. At 11:00 UTC, ceiling height reaches 0.1 m and visibility reaches 0 m. The reason for the historical change is unconfirmed. See the source comparisons.
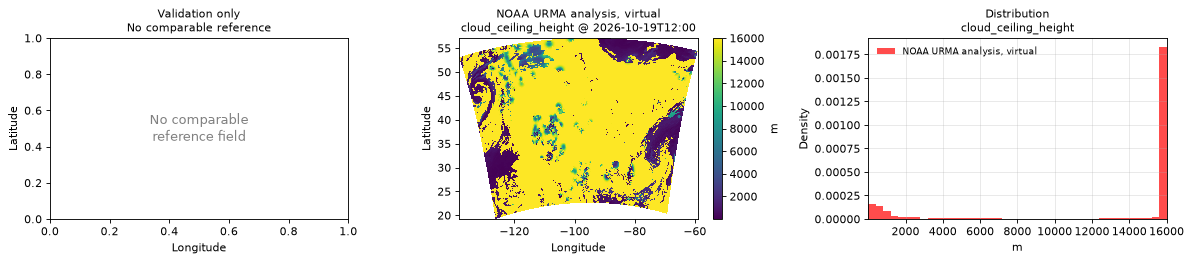
- The treatment of cloud ceiling changes in the checked July 27, 2020 samples. At 12:00 UTC, every grid cell with total cloud cover below 50% has the maximum ceiling value of 16,000 m; at 11:00 UTC, only about 53% do. This reflects a change in how ceiling height is calculated, not a measured rise in clouds, and matters for long-term comparisons. See the source checks.
- NOAA prepares cloud-ceiling estimates in metres above ground before analysis. See NOAA’s URMA v2.10.9 code (accessed October 28, 2026). Source metadata labels the field only “Ceiling” in metres. The height reference has not been verified for every historical period; this dataset makes no terrain-height adjustment.
Datasets
| Role | Name | ID | Version | URL |
|---|---|---|---|---|
| Validation | NOAA URMA analysis, virtual | noaa-urma-analysis-virtual |
v0.1.0 |
s3://dynamical-noaa-urma/noaa-urma-analysis-virtual/v0.1.0.icechunk |
| Reference | NOAA GEFS analysis | noaa-gefs-analysis |
0.1.2 |
s3://dynamical-noaa-gefs/noaa-gefs-analysis/v0.1.2.icechunk/ |
Run parameters
| Parameter | Value |
|---|---|
| Validation dataset type | analysis |
| Icechunk snapshot | 8H2JJXCAF6YSMT6W121G |
| Validation time range | time 2017-05-02T00:00 → 2026-10-20T23:00 |
| Reference time range | time 2000-01-01T00:00 → 2026-10-23T00:00 |
| Point 1 | lat=39.9932, lon=-104.9857 |
| Point 2 | lat=33.9994, lon=-73.0068 |
| Spatial comparison time | 2026-10-19T12:00 (reference at 2026-10-19T12:00) |
| Timeseries period | 2026-10-10T23:00 - 2026-10-20T23:00 |
| Store type | virtual — availability manifest-probed; value series sampled |
Availability
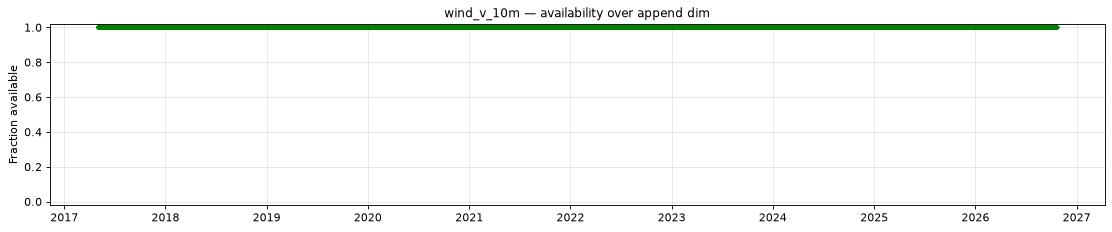
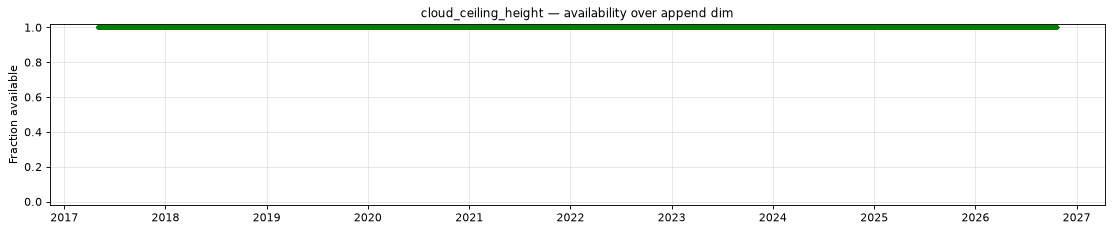
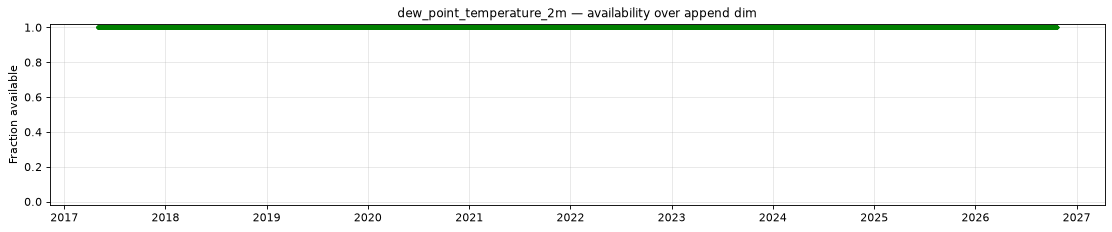
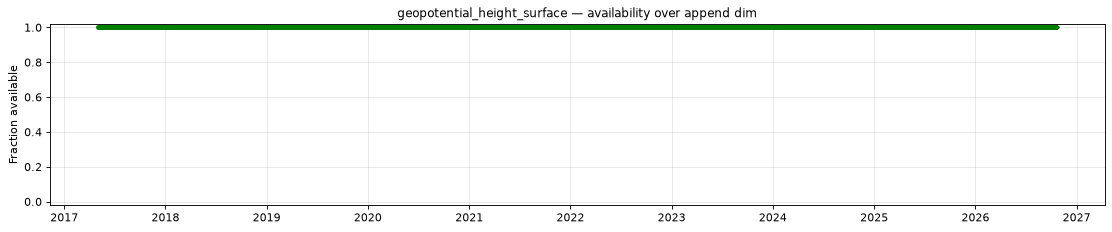
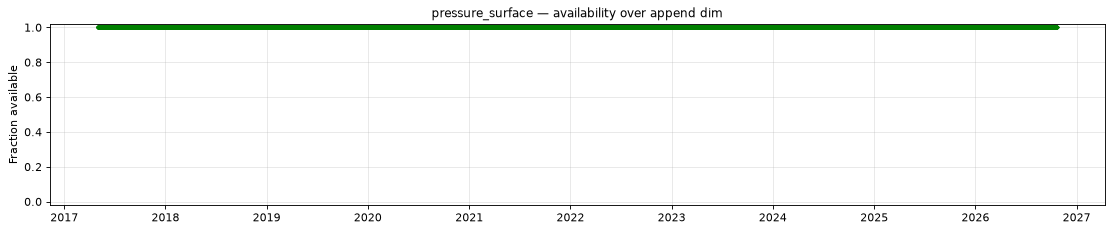
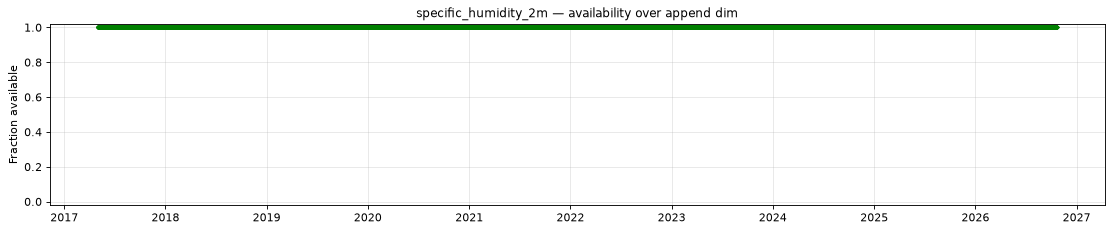
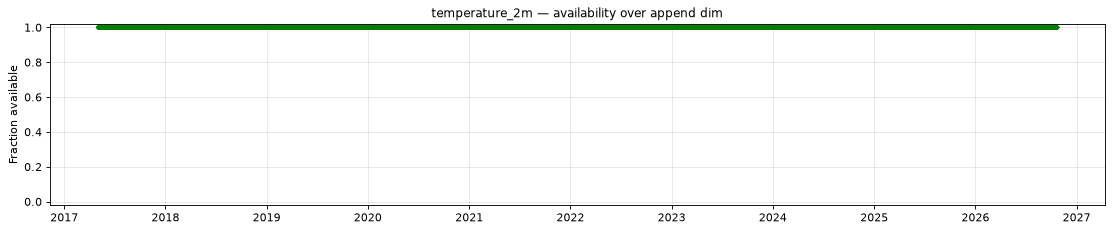
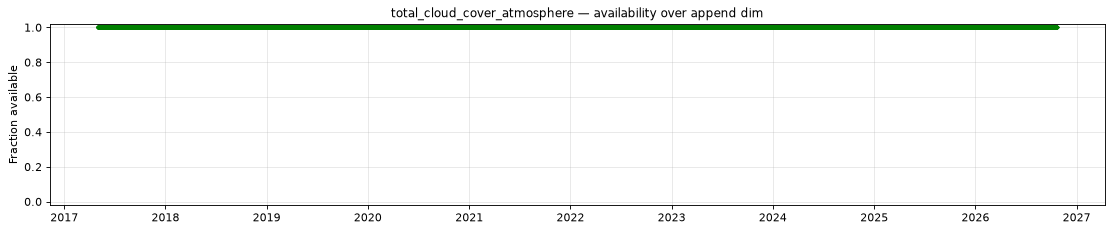
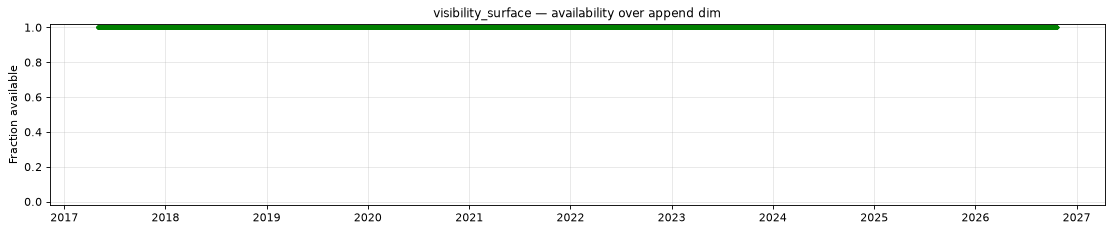
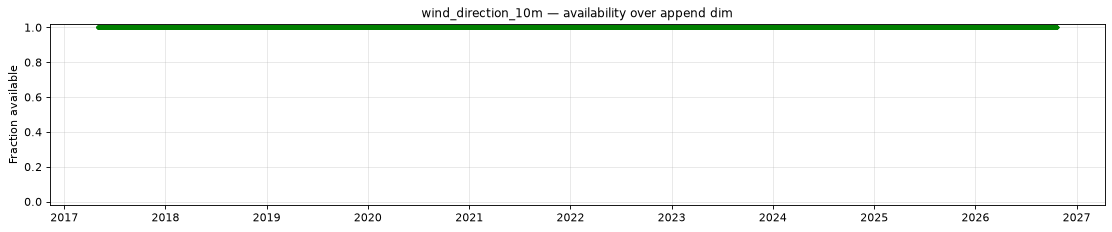
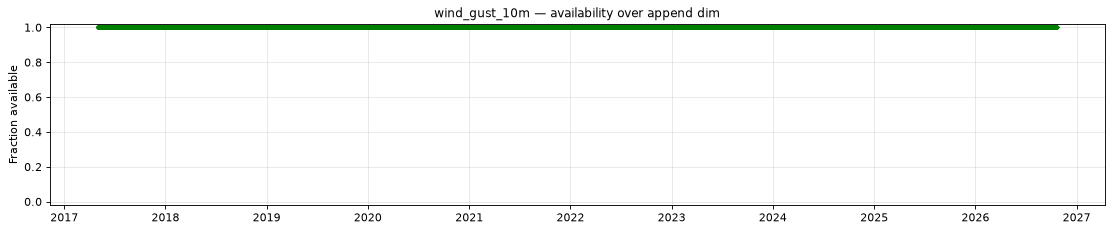
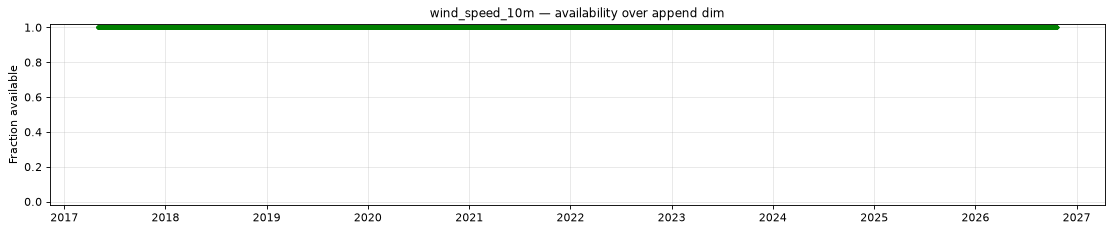
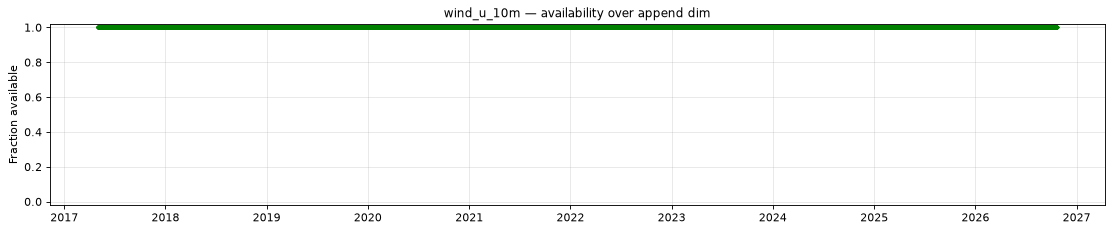
The plot below shows the availability of each variable over time — light red marks unavailable data, dark green marks present data.
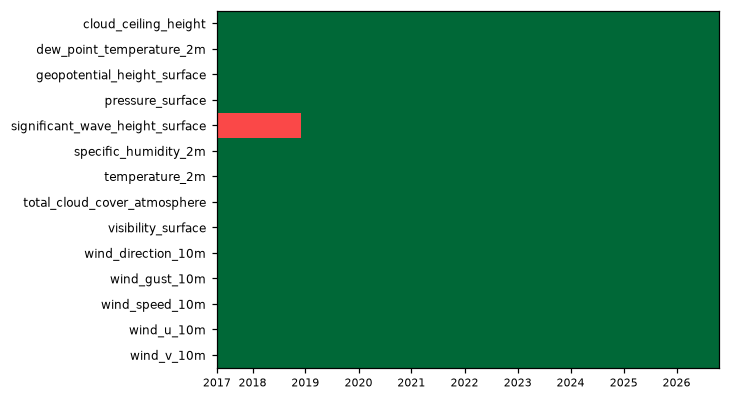
| Variable | Complete positions | Incomplete % | First incomplete | Last incomplete |
|---|---|---|---|---|
cloud_ceiling_height |
82895/83016 | 0.15% | 2017-07-11T11:00 | 2020-06-24T17:00 |
dew_point_temperature_2m |
82895/83016 | 0.15% | 2017-07-11T11:00 | 2020-06-24T17:00 |
geopotential_height_surface |
82895/83016 | 0.15% | 2017-07-11T11:00 | 2020-06-24T17:00 |
pressure_surface |
82895/83016 | 0.15% | 2017-07-11T11:00 | 2020-06-24T17:00 |
significant_wave_height_surface |
68976/83016 | 16.91% | 2017-05-02T00:00 | 2020-06-24T17:00 |
specific_humidity_2m |
82895/83016 | 0.15% | 2017-07-11T11:00 | 2020-06-24T17:00 |
temperature_2m |
82895/83016 | 0.15% | 2017-07-11T11:00 | 2020-06-24T17:00 |
total_cloud_cover_atmosphere |
82895/83016 | 0.15% | 2017-07-11T11:00 | 2020-06-24T17:00 |
visibility_surface |
82895/83016 | 0.15% | 2017-07-11T11:00 | 2020-06-24T17:00 |
wind_direction_10m |
82895/83016 | 0.15% | 2017-07-11T11:00 | 2020-06-24T17:00 |
wind_gust_10m |
82895/83016 | 0.15% | 2017-07-11T11:00 | 2020-06-24T17:00 |
wind_speed_10m |
82895/83016 | 0.15% | 2017-07-11T11:00 | 2020-06-24T17:00 |
wind_u_10m |
82895/83016 | 0.15% | 2017-07-11T11:00 | 2020-06-24T17:00 |
wind_v_10m |
82895/83016 | 0.15% | 2017-07-11T11:00 | 2020-06-24T17:00 |
- Unavailable timestamps:
unavailable_timestamps.txt
Decode health
276 references decoded successfully across 20 sampled hourly positions out of 83,016. These are single-level analyses; no forecast lead-time or vertical-level sampling applies.
Per-variable details
cloud_ceiling_height
Metadata
| Field | Value |
|---|---|
| units | m |
| long_name | Ceiling |
| short_name | ceil |
| standard_name | n/a |
| step_type | instant |
Point time series — 2017-05-02T00:00 - 2026-10-20T23:00, sampled
| Point | min | mean | max |
|---|---|---|---|
| P1 | 13.4 | 1.273e+04 | 2e+04 |
| P2 | 41.2 | 1.243e+04 | 2e+04 |
Spatial — 2026-10-19T12:00 (reference not available)
| Source | min | mean | max |
|---|---|---|---|
| Validation | 1 | 1.267e+04 | 1.6e+04 |
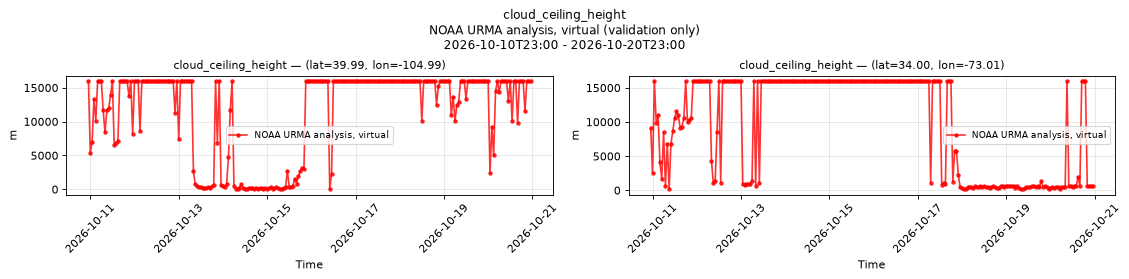
Temporal — 2026-10-10T23:00 - 2026-10-20T23:00
| Source | min | mean | max |
|---|---|---|---|
| P1 Validation | 26.9 | 1.144e+04 | 1.6e+04 |
| P2 Validation | 175 | 9633 | 1.6e+04 |
Availability — 82895 of 83016 positions complete (incomplete 2017-07-11T11:00 → 2020-06-24T17:00)
dew_point_temperature_2m
Metadata
| Field | Value |
|---|---|
| units | degree_Celsius |
| long_name | 2 metre dewpoint temperature |
| short_name | 2d |
| standard_name | dew_point_temperature |
| step_type | instant |
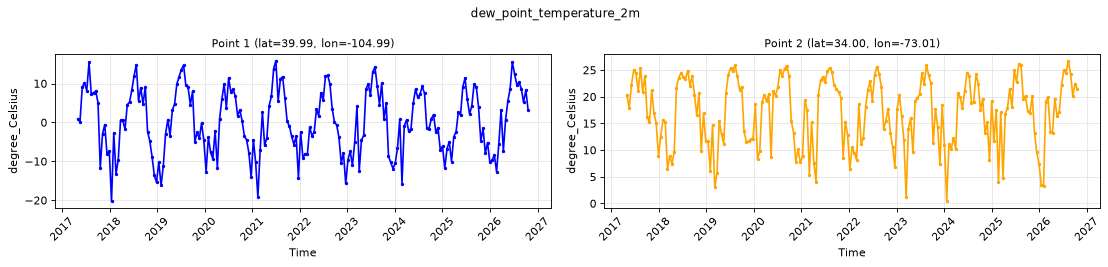
Point time series — 2017-05-02T00:00 - 2026-10-20T23:00, sampled
| Point | min | mean | max |
|---|---|---|---|
| P1 | -20.19 | 0.2444 | 15.82 |
| P2 | 0.46 | 17.04 | 26.71 |
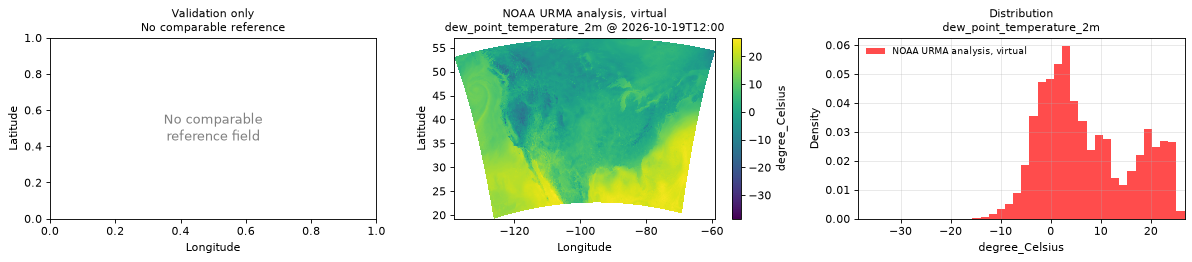
Spatial — 2026-10-19T12:00 (reference not available)
| Source | min | mean | max |
|---|---|---|---|
| Validation | -38.48 | 7.232 | 26.74 |
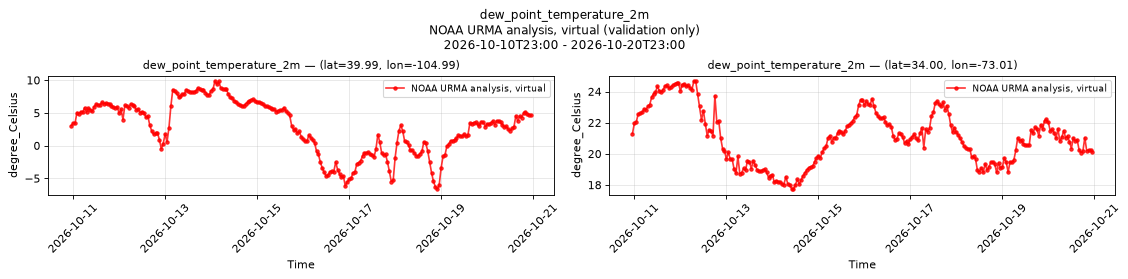
Temporal — 2026-10-10T23:00 - 2026-10-20T23:00
| Source | min | mean | max |
|---|---|---|---|
| P1 Validation | -6.65 | 2.867 | 9.88 |
| P2 Validation | 17.73 | 21.08 | 24.68 |
Availability — 82895 of 83016 positions complete (incomplete 2017-07-11T11:00 → 2020-06-24T17:00)
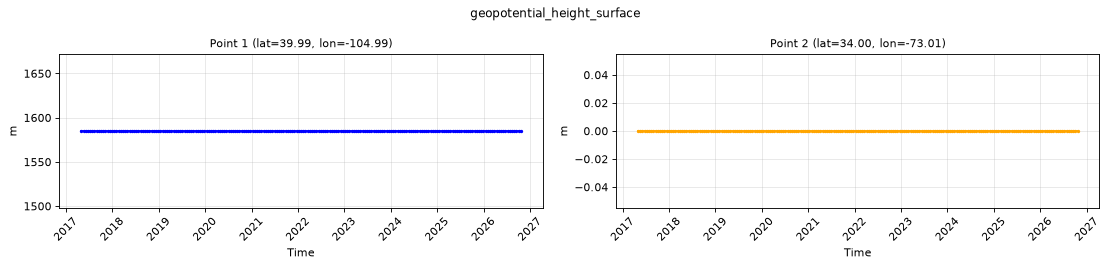
geopotential_height_surface
Metadata
| Field | Value |
|---|---|
| units | m |
| long_name | Geopotential height |
| short_name | gh |
| standard_name | geopotential_height |
| step_type | instant |
Point time series — 2017-05-02T00:00 - 2026-10-20T23:00, sampled
| Point | min | mean | max |
|---|---|---|---|
| P1 | 1585 | 1585 | 1585 |
| P2 | 0 | 0 | 0 |
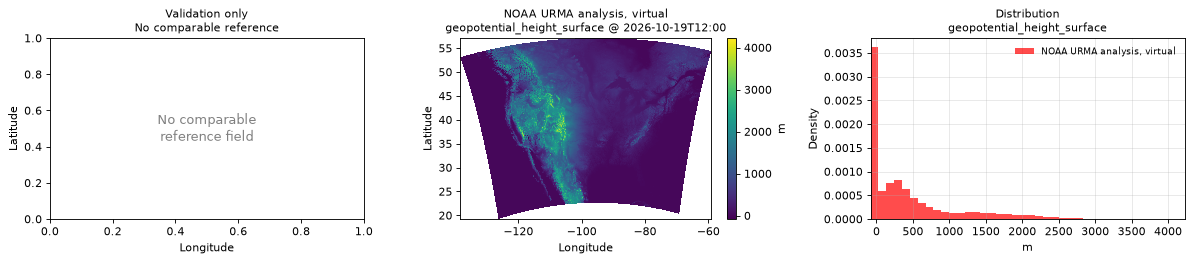
Spatial — 2026-10-19T12:00 (reference not available)
| Source | min | mean | max |
|---|---|---|---|
| Validation | -81 | 441.8 | 4226 |
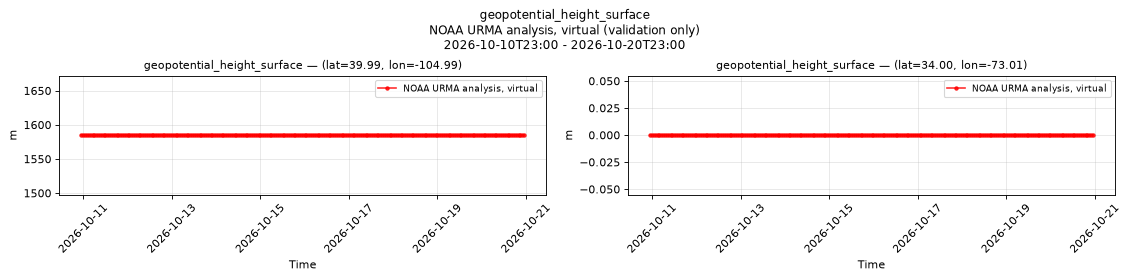
Temporal — 2026-10-10T23:00 - 2026-10-20T23:00
| Source | min | mean | max |
|---|---|---|---|
| P1 Validation | 1585 | 1585 | 1585 |
| P2 Validation | 0 | 0 | 0 |
Availability — 82895 of 83016 positions complete (incomplete 2017-07-11T11:00 → 2020-06-24T17:00)
pressure_surface
Metadata
| Field | Value |
|---|---|
| units | Pa |
| long_name | Surface pressure |
| short_name | sp |
| standard_name | surface_air_pressure |
| step_type | instant |
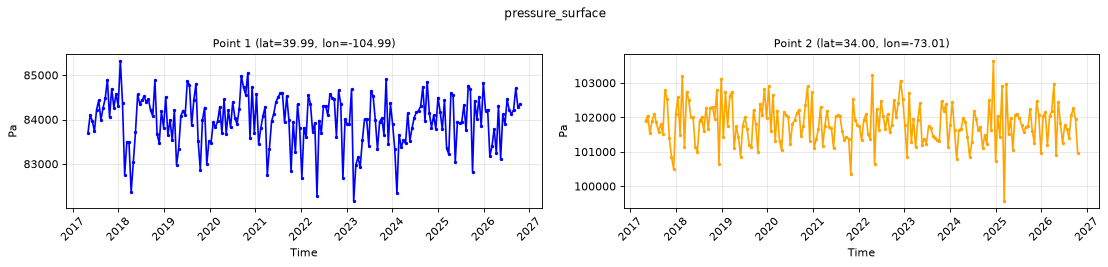
Point time series — 2017-05-02T00:00 - 2026-10-20T23:00, sampled
| Point | min | mean | max |
|---|---|---|---|
| P1 | 8.216e+04 | 8.398e+04 | 8.532e+04 |
| P2 | 9.957e+04 | 1.018e+05 | 1.036e+05 |
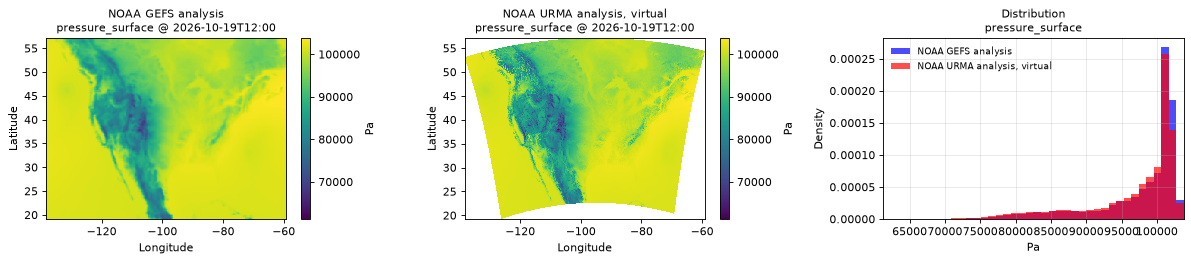
Spatial — 2026-10-19T12:00 (reference at 2026-10-19T12:00)
| Source | min | mean | max |
|---|---|---|---|
| Validation | 6.125e+04 | 9.696e+04 | 1.037e+05 |
| Reference | 6.822e+04 | 9.761e+04 | 1.038e+05 |
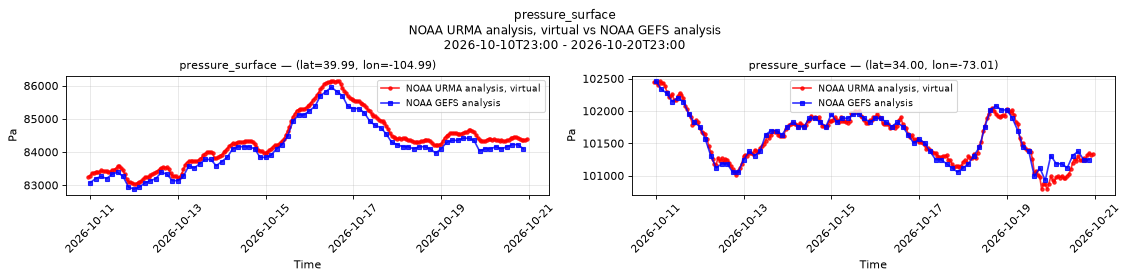
Temporal — 2026-10-10T23:00 - 2026-10-20T23:00
| Source | min | mean | max |
|---|---|---|---|
| P1 Validation | 8.304e+04 | 8.434e+04 | 8.614e+04 |
| P1 Reference | 8.288e+04 | 8.414e+04 | 8.595e+04 |
| P2 Validation | 1.008e+05 | 1.016e+05 | 1.025e+05 |
| P2 Reference | 1.009e+05 | 1.016e+05 | 1.025e+05 |
Availability — 82895 of 83016 positions complete (incomplete 2017-07-11T11:00 → 2020-06-24T17:00)
significant_wave_height_surface
Metadata
| Field | Value |
|---|---|
| units | m |
| long_name | Significant height of combined wind waves and swell |
| short_name | swh |
| standard_name | sea_surface_wave_significant_height |
| step_type | instant |
| comment | NaN where no wave analysis is made, such as over land and ice-covered water. |
Point time series — 2017-05-02T00:00 - 2026-10-20T23:00, sampled
| Point | min | mean | max |
|---|---|---|---|
| P1 | n/a | n/a | n/a |
| P2 | 0.55 | 1.859 | 5.34 |
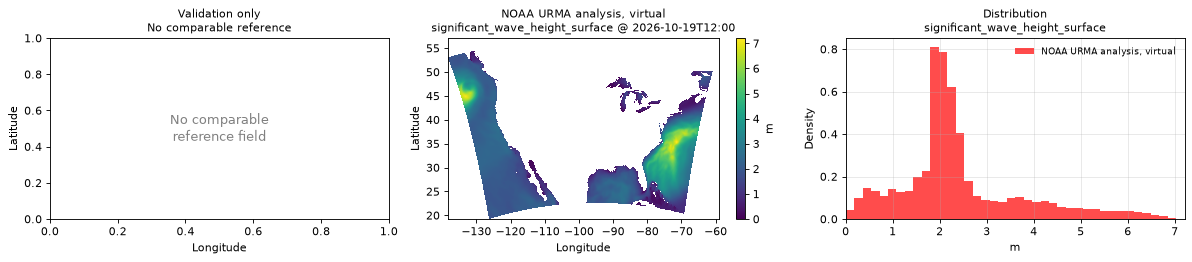
Spatial — 2026-10-19T12:00 (reference not available)
| Source | min | mean | max |
|---|---|---|---|
| Validation | 0 | 2.414 | 7.21 |
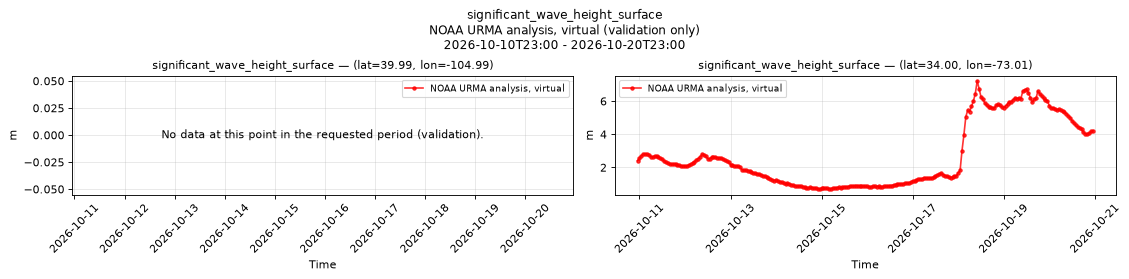
Temporal — 2026-10-10T23:00 - 2026-10-20T23:00
| Source | min | mean | max |
|---|---|---|---|
| P1 Validation | n/a | n/a | n/a |
| P2 Validation | 0.69 | 2.706 | 7.22 |
Availability — 68976 of 83016 positions complete (incomplete 2017-05-02T00:00 → 2020-06-24T17:00)
specific_humidity_2m
Metadata
| Field | Value |
|---|---|
| units | 1 |
| long_name | Specific humidity |
| short_name | q |
| standard_name | specific_humidity |
| step_type | instant |
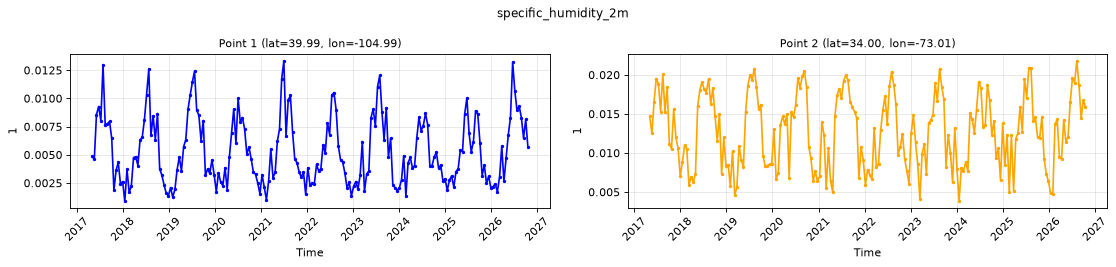
Point time series — 2017-05-02T00:00 - 2026-10-20T23:00, sampled
| Point | min | mean | max |
|---|---|---|---|
| P1 | 0.0009 | 0.005338 | 0.01333 |
| P2 | 0.003847 | 0.01277 | 0.02179 |
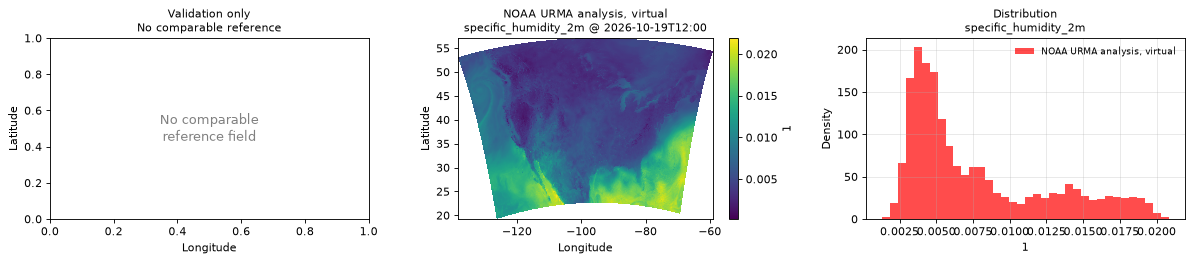
Spatial — 2026-10-19T12:00 (reference not available)
| Source | min | mean | max |
|---|---|---|---|
| Validation | 0.000206 | 0.00768 | 0.02191 |
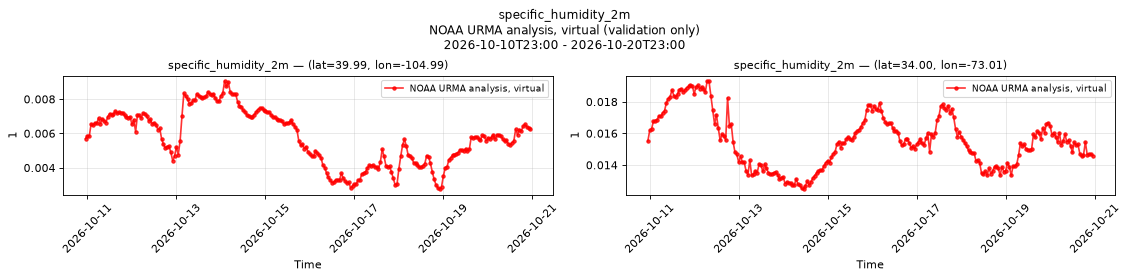
Temporal — 2026-10-10T23:00 - 2026-10-20T23:00
| Source | min | mean | max |
|---|---|---|---|
| P1 Validation | 0.002754 | 0.005762 | 0.009059 |
| P2 Validation | 0.01248 | 0.01552 | 0.01932 |
Availability — 82895 of 83016 positions complete (incomplete 2017-07-11T11:00 → 2020-06-24T17:00)
temperature_2m
Metadata
| Field | Value |
|---|---|
| units | degree_Celsius |
| long_name | 2 metre temperature |
| short_name | 2t |
| standard_name | air_temperature |
| step_type | instant |
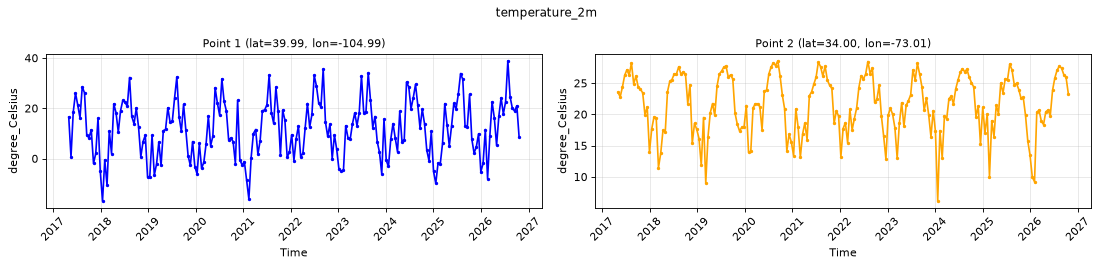
Point time series — 2017-05-02T00:00 - 2026-10-20T23:00, sampled
| Point | min | mean | max |
|---|---|---|---|
| P1 | -16.88 | 11.75 | 38.84 |
| P2 | 6.13 | 21.56 | 28.55 |
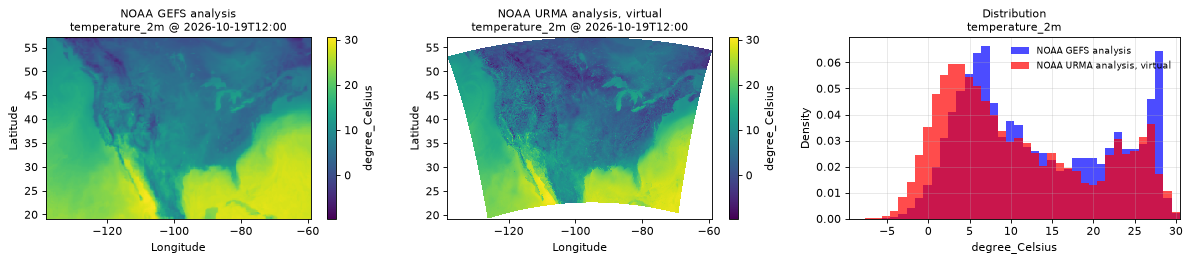
Spatial — 2026-10-19T12:00 (reference at 2026-10-19T12:00)
| Source | min | mean | max |
|---|---|---|---|
| Validation | -9.64 | 10.92 | 30.49 |
| Reference | -6.938 | 13.39 | 30 |
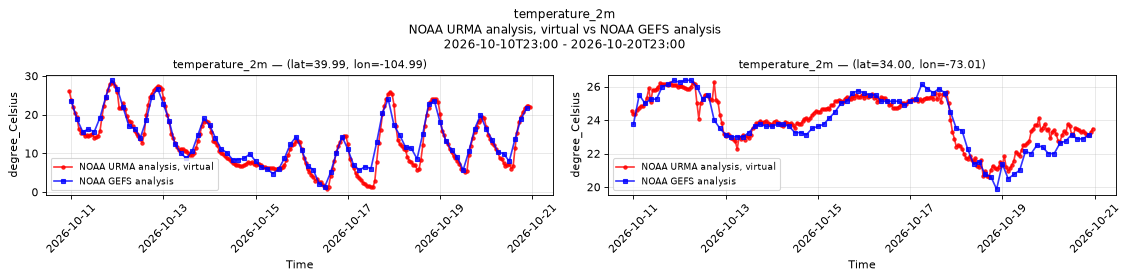
Temporal — 2026-10-10T23:00 - 2026-10-20T23:00
| Source | min | mean | max |
|---|---|---|---|
| P1 Validation | 0.75 | 12.97 | 28.39 |
| P1 Reference | 1.367 | 13.63 | 28.88 |
| P2 Validation | 20.59 | 24.07 | 26.26 |
| P2 Reference | 19.88 | 23.89 | 26.38 |
Availability — 82895 of 83016 positions complete (incomplete 2017-07-11T11:00 → 2020-06-24T17:00)
total_cloud_cover_atmosphere
Metadata
| Field | Value |
|---|---|
| units | percent |
| long_name | Total cloud cover |
| short_name | tcc |
| standard_name | cloud_area_fraction |
| step_type | instant |
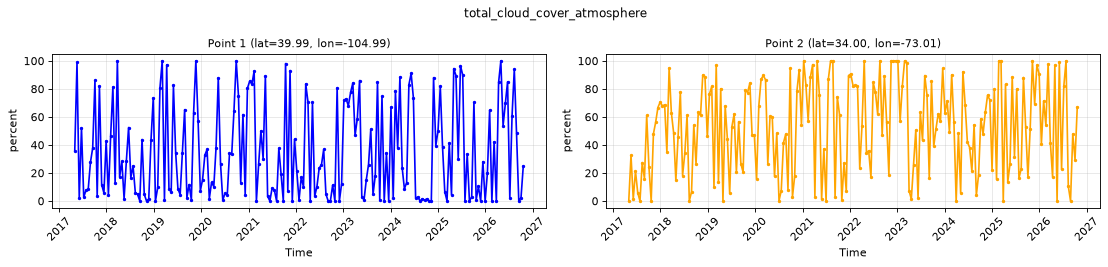
Point time series — 2017-05-02T00:00 - 2026-10-20T23:00, sampled
| Point | min | mean | max |
|---|---|---|---|
| P1 | 0 | 34.71 | 100 |
| P2 | 0 | 52.49 | 100 |
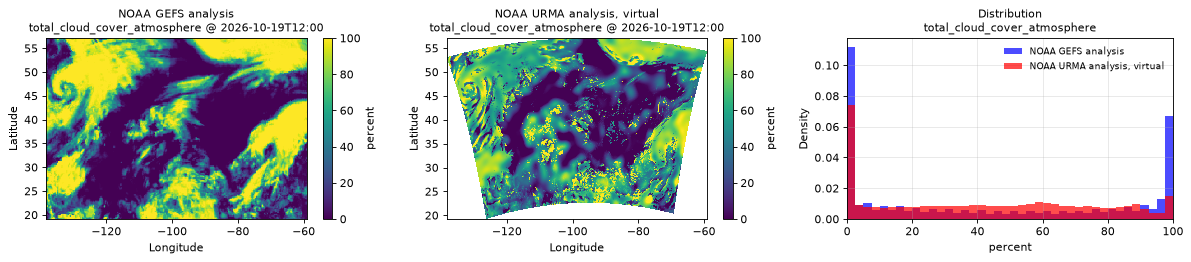
Spatial — 2026-10-19T12:00 (reference at 2026-10-19T12:00)
| Source | min | mean | max |
|---|---|---|---|
| Validation | 0 | 41.79 | 100 |
| Reference | 0 | 43.98 | 100 |
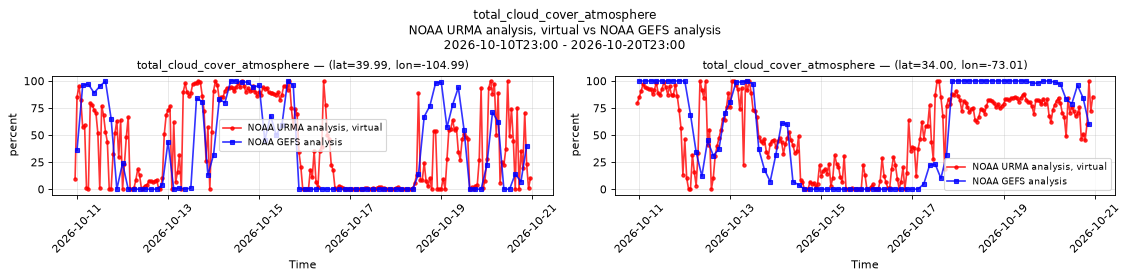
Temporal — 2026-10-10T23:00 - 2026-10-20T23:00
| Source | min | mean | max |
|---|---|---|---|
| P1 Validation | 0 | 40.61 | 100 |
| P1 Reference | 0 | 36.08 | 100 |
| P2 Validation | 0 | 53.94 | 100 |
| P2 Reference | 0 | 54.83 | 100 |
Availability — 82895 of 83016 positions complete (incomplete 2017-07-11T11:00 → 2020-06-24T17:00)
visibility_surface
Metadata
| Field | Value |
|---|---|
| units | m |
| long_name | Visibility |
| short_name | vis |
| standard_name | visibility_in_air |
| step_type | instant |
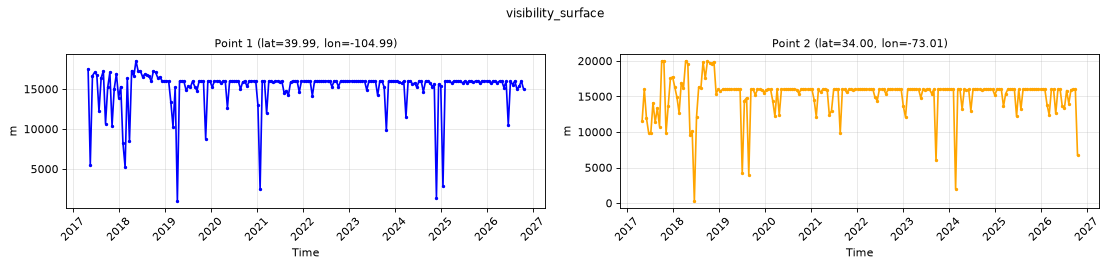
Point time series — 2017-05-02T00:00 - 2026-10-20T23:00, sampled
| Point | min | mean | max |
|---|---|---|---|
| P1 | 979 | 1.517e+04 | 1.852e+04 |
| P2 | 290 | 1.513e+04 | 2e+04 |
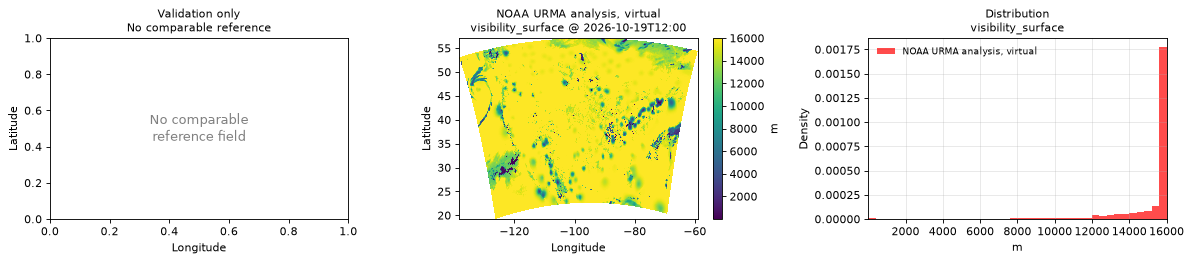
Spatial — 2026-10-19T12:00 (reference not available)
| Source | min | mean | max |
|---|---|---|---|
| Validation | 1 | 1.504e+04 | 1.6e+04 |
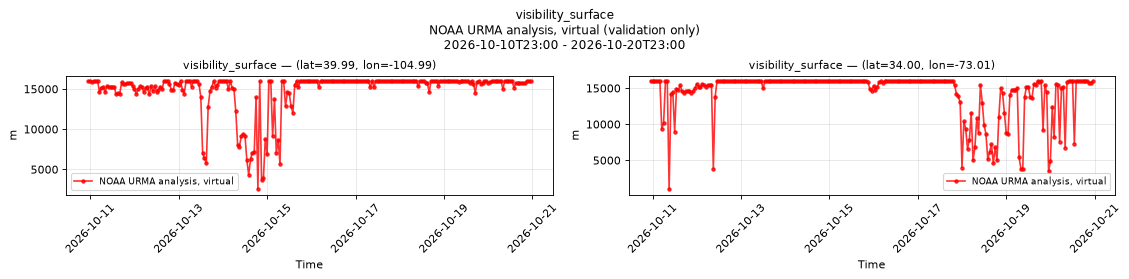
Temporal — 2026-10-10T23:00 - 2026-10-20T23:00
| Source | min | mean | max |
|---|---|---|---|
| P1 Validation | 2542 | 1.481e+04 | 1.6e+04 |
| P2 Validation | 1000 | 1.436e+04 | 1.6e+04 |
Availability — 82895 of 83016 positions complete (incomplete 2017-07-11T11:00 → 2020-06-24T17:00)
wind_direction_10m
Metadata
| Field | Value |
|---|---|
| units | degree |
| long_name | 10 metre wind direction |
| short_name | 10wdir |
| standard_name | wind_from_direction |
| step_type | instant |
| comment | Direction the wind blows from, clockwise from true north. |
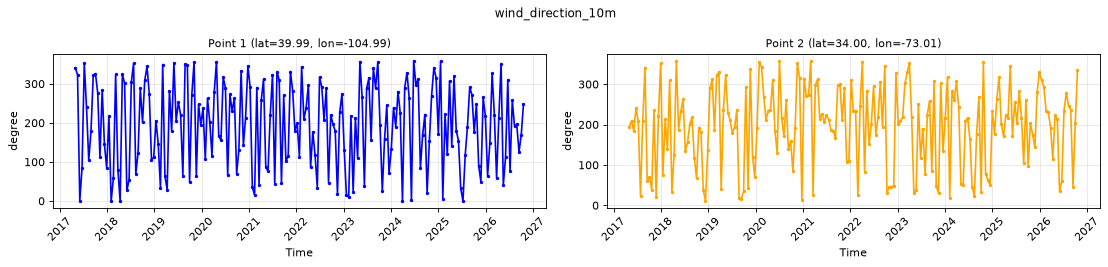
Point time series — 2017-05-02T00:00 - 2026-10-20T23:00, sampled
| Point | min | mean | max |
|---|---|---|---|
| P1 | 0 | 308.2 | 358.8 |
| P2 | 10.9 | 247.3 | 357.8 |
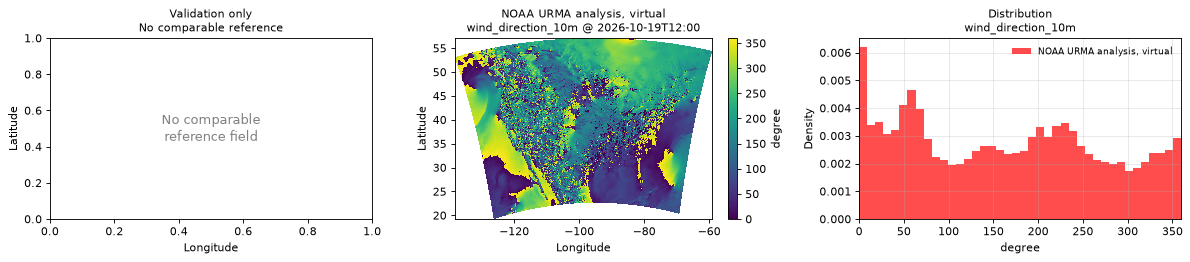
Spatial — 2026-10-19T12:00 (reference not available)
| Source | min | mean | max |
|---|---|---|---|
| Validation | 0 | 42.16 | 360 |
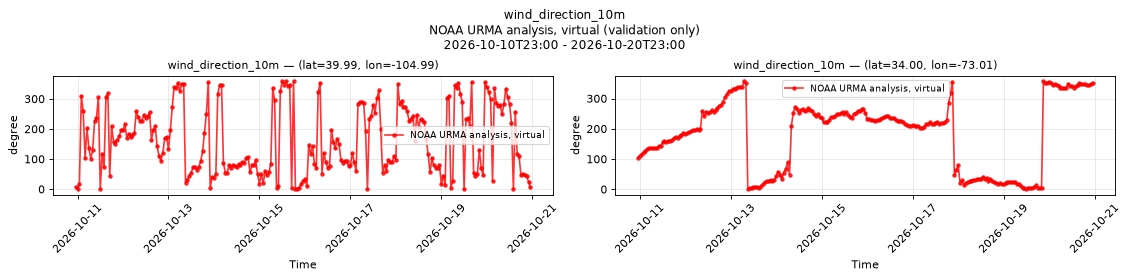
Temporal — 2026-10-10T23:00 - 2026-10-20T23:00
| Source | min | mean | max |
|---|---|---|---|
| P1 Validation | 0 | 41 | 359.5 |
| P2 Validation | 0.4 | 294.7 | 358 |
Availability — 82895 of 83016 positions complete (incomplete 2017-07-11T11:00 → 2020-06-24T17:00)
wind_gust_10m
Metadata
| Field | Value |
|---|---|
| units | m s-1 |
| long_name | Wind speed (gust) |
| short_name | gust |
| standard_name | wind_speed_of_gust |
| step_type | instant |
Point time series — 2017-05-02T00:00 - 2026-10-20T23:00, sampled
| Point | min | mean | max |
|---|---|---|---|
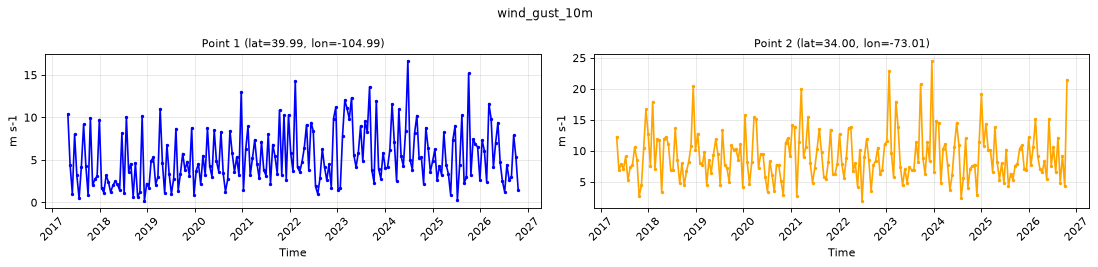
| P1 | 0.17 | 5.306 | 16.65 |
| P2 | 1.92 | 9.155 | 24.51 |
Spatial — 2026-10-19T12:00 (reference not available)
| Source | min | mean | max |
|---|---|---|---|
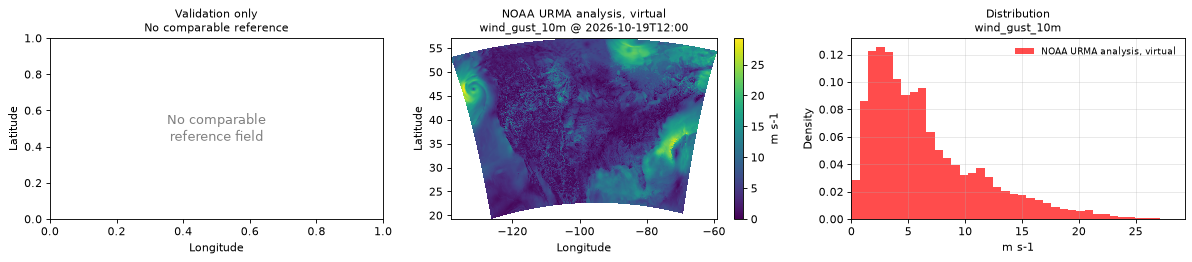
| Validation | 0 | 6.439 | 29.3 |
Temporal — 2026-10-10T23:00 - 2026-10-20T23:00
| Source | min | mean | max |
|---|---|---|---|
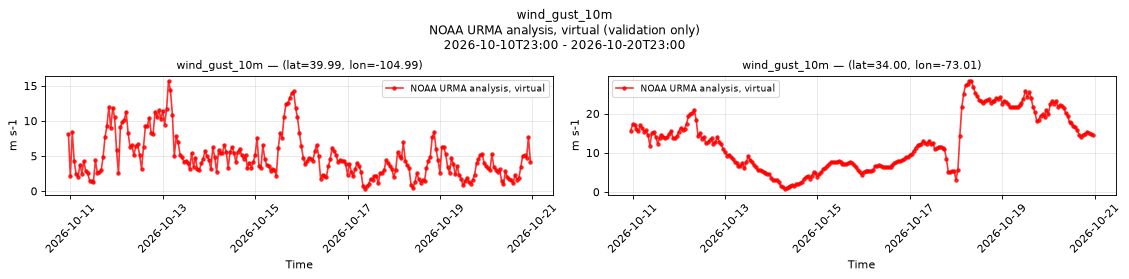
| P1 Validation | 0.28 | 4.88 | 15.69 |
| P2 Validation | 0.71 | 12.63 | 28.35 |
Availability — 82895 of 83016 positions complete (incomplete 2017-07-11T11:00 → 2020-06-24T17:00)
wind_speed_10m
Metadata
| Field | Value |
|---|---|
| units | m s-1 |
| long_name | 10 metre wind speed |
| short_name | 10si |
| standard_name | wind_speed |
| step_type | instant |
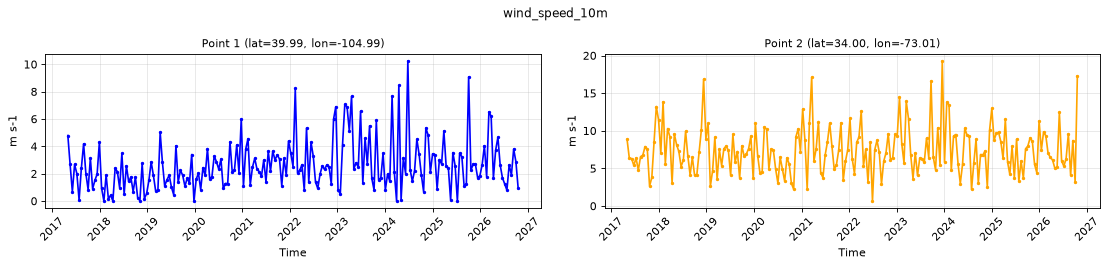
Point time series — 2017-05-02T00:00 - 2026-10-20T23:00, sampled
| Point | min | mean | max |
|---|---|---|---|
| P1 | 0 | 2.596 | 10.25 |
| P2 | 0.66 | 7.396 | 19.29 |
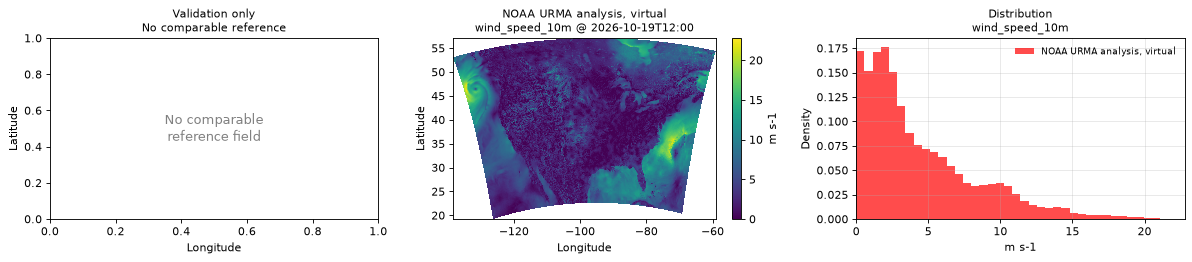
Spatial — 2026-10-19T12:00 (reference not available)
| Source | min | mean | max |
|---|---|---|---|
| Validation | 0 | 4.423 | 22.78 |
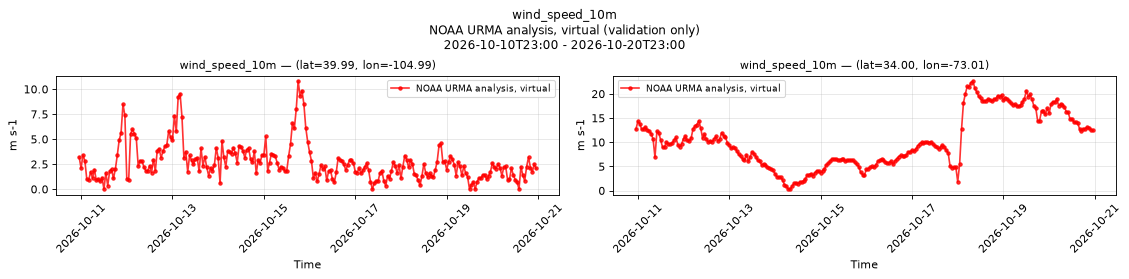
Temporal — 2026-10-10T23:00 - 2026-10-20T23:00
| Source | min | mean | max |
|---|---|---|---|
| P1 Validation | 0 | 2.68 | 10.82 |
| P2 Validation | 0.31 | 10.26 | 22.66 |
Availability — 82895 of 83016 positions complete (incomplete 2017-07-11T11:00 → 2020-06-24T17:00)
wind_u_10m
Metadata
| Field | Value |
|---|---|
| units | m s-1 |
| long_name | 10 metre U wind component |
| short_name | 10u |
| standard_name | x_wind |
| step_type | instant |
| comment | Velocity along the model grid's x dimension, not eastward velocity. |
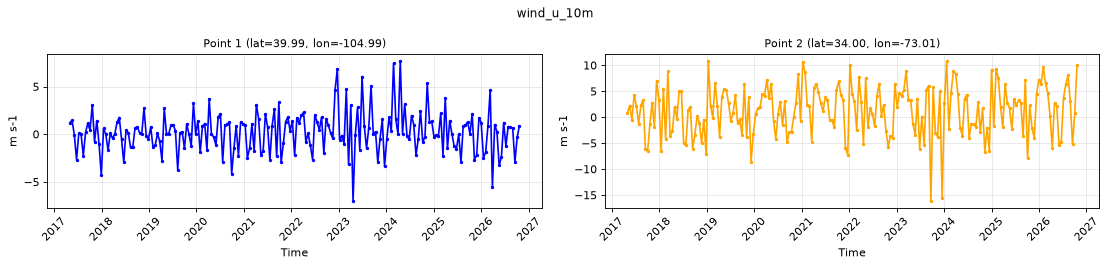
Point time series — 2017-05-02T00:00 - 2026-10-20T23:00, sampled
| Point | min | mean | max |
|---|---|---|---|
| P1 | -7.01 | 0.2118 | 7.69 |
| P2 | -16.16 | 1.198 | 10.84 |
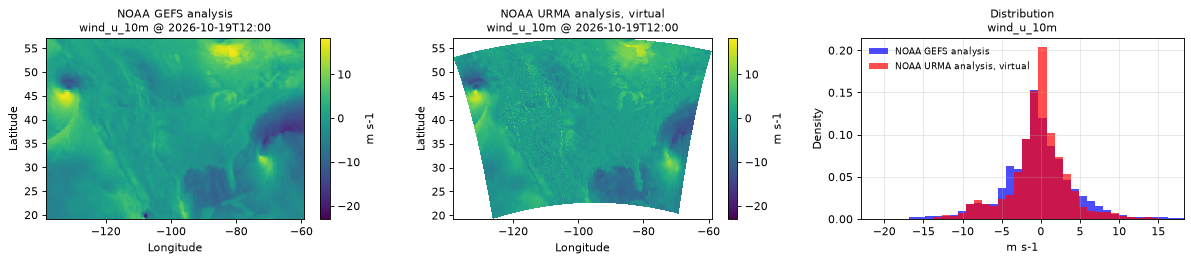
Spatial — 2026-10-19T12:00 (reference at 2026-10-19T12:00)
| Source | min | mean | max |
|---|---|---|---|
| Validation | -20.15 | -0.3591 | 16.9 |
| Reference | -23 | -0.454 | 18.25 |
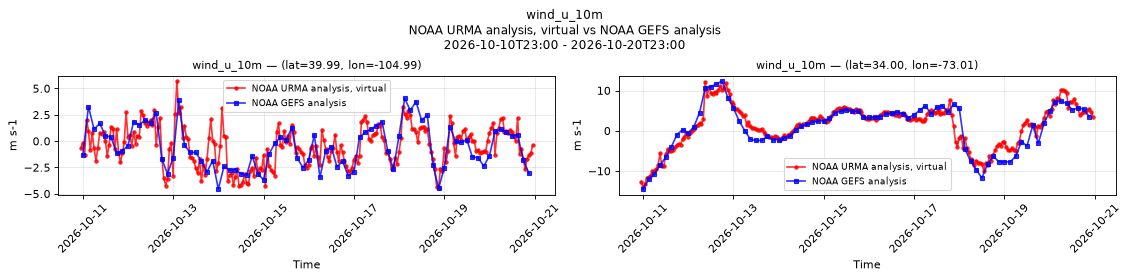
Temporal — 2026-10-10T23:00 - 2026-10-20T23:00
| Source | min | mean | max |
|---|---|---|---|
| P1 Validation | -4.43 | -0.4869 | 5.71 |
| P1 Reference | -4.562 | -0.5538 | 4.062 |
| P2 Validation | -14.01 | 1.335 | 12.18 |
| P2 Reference | -14.5 | 0.9561 | 12.38 |
Availability — 82895 of 83016 positions complete (incomplete 2017-07-11T11:00 → 2020-06-24T17:00)
wind_v_10m
Metadata
| Field | Value |
|---|---|
| units | m s-1 |
| long_name | 10 metre V wind component |
| short_name | 10v |
| standard_name | y_wind |
| step_type | instant |
| comment | Velocity along the model grid's y dimension, not northward velocity. |
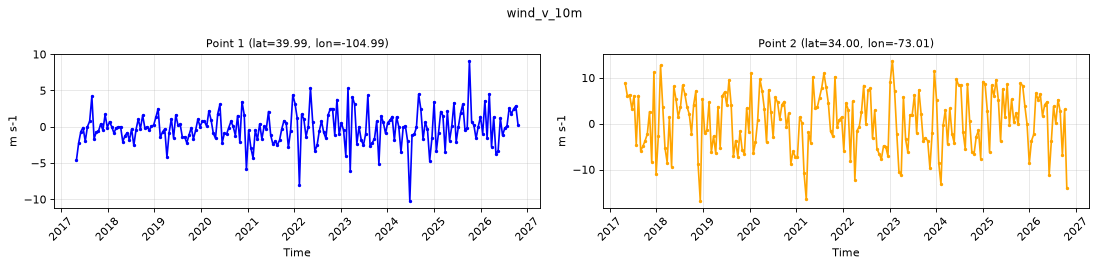
Point time series — 2017-05-02T00:00 - 2026-10-20T23:00, sampled
| Point | min | mean | max |
|---|---|---|---|
| P1 | -10.24 | -0.2041 | 9.08 |
| P2 | -16.86 | 0.5107 | 13.69 |
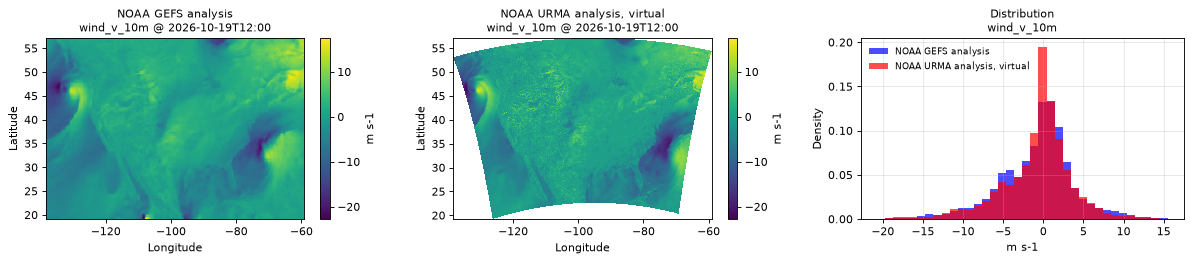
Spatial — 2026-10-19T12:00 (reference at 2026-10-19T12:00)
| Source | min | mean | max |
|---|---|---|---|
| Validation | -22.08 | -0.7911 | 15.74 |
| Reference | -22.75 | -0.7699 | 17.5 |
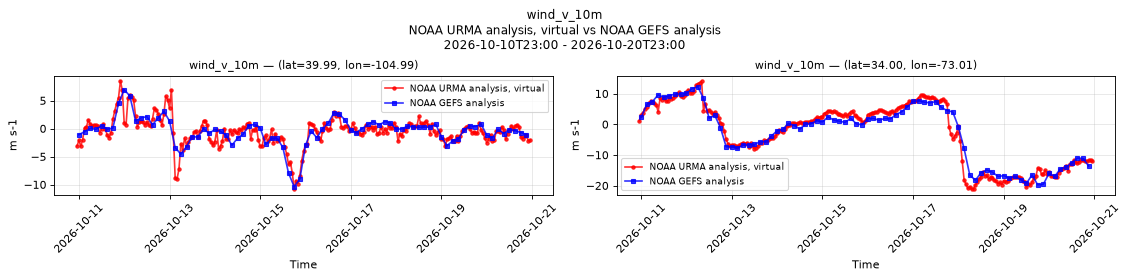
Temporal — 2026-10-10T23:00 - 2026-10-20T23:00
| Source | min | mean | max |
|---|---|---|---|
| P1 Validation | -10.81 | -0.5058 | 8.49 |
| P1 Reference | -10.38 | -0.4352 | 6.938 |
| P2 Validation | -21.14 | -2.764 | 14.15 |
| P2 Reference | -19.75 | -2.884 | 12.25 |
Availability — 82895 of 83016 positions complete (incomplete 2017-07-11T11:00 → 2020-06-24T17:00)