NOAA RTMA-RU analysis, virtual validation report
This dataset validation report plots a sample of values from the NOAA RTMA-RU analysis, virtual dataset over time and across space, comparing where possible to a previously validated reference dataset. It also reports the quantity of unavailable values and their associated timestamps. These analyses are one layer of a multi-layered dataset validation process we perform at dynamical.org and also provide users a preview of the dataset contents.
Report generation start time: 2026-10-27T02:57:28 UTC
Summary
This report reviews 15-minute Real-Time Mesoscale Analysis Rapid Update (RTMA-RU) data from December 13, 2017 through October 20, 2026. Checks covered the presence of expected variables in available source files throughout the archive, plus samples of their values. The notes below describe gaps and interpretation limits; not every value was checked.
What looks good
- Every expected variable from each available source file is included throughout the 15-minute archive. See the archive checks.
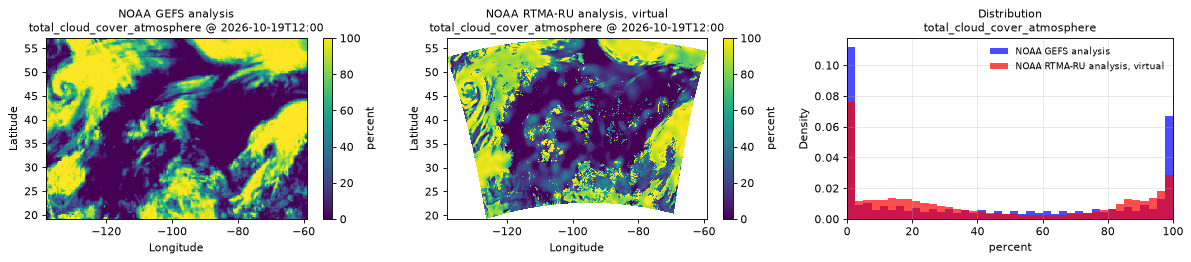
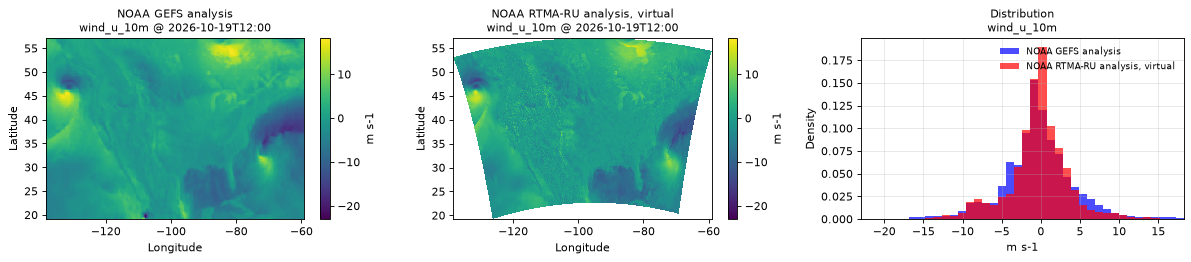
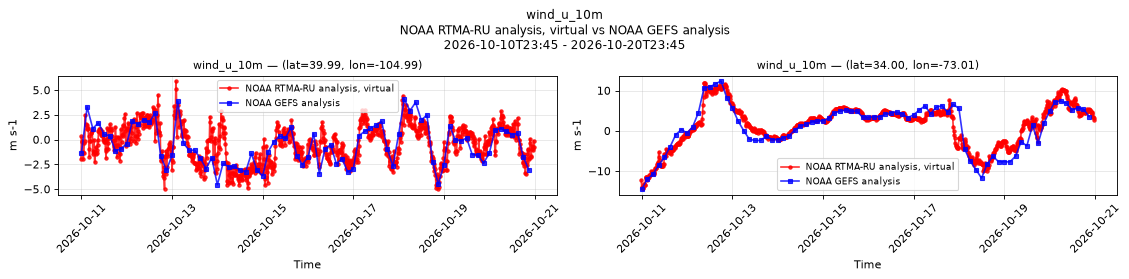
- Sampled values matched an independent reader of the source files. Comparisons covered 61 complete spatial fields and checks at six selected times, including the start of total cloud cover. See the source comparisons.
- All 254 sampled fields were readable across 20 selected times. The checks do not cover every value in the archive.
Review notes
- There are 451 missing source files. The expected files for these 15-minute intervals were absent from the National Oceanic and Atmospheric Administration (NOAA) public RTMA archive when checked; the reason is unconfirmed. See the exact missing times.
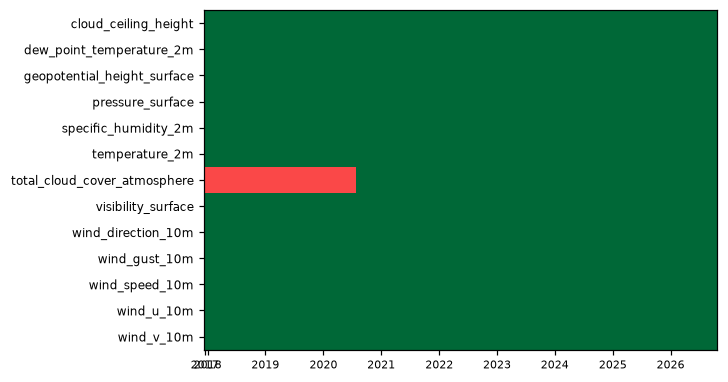
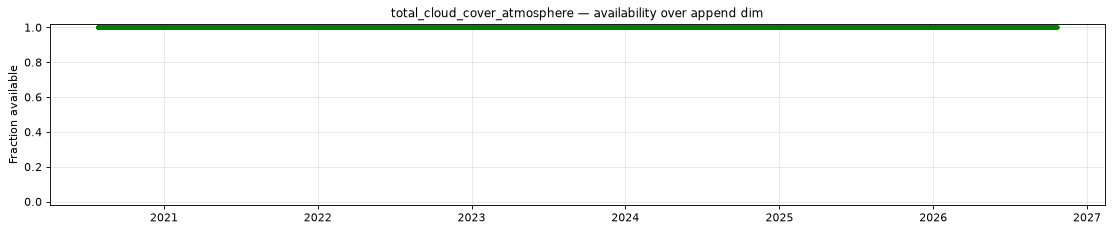
- Total cloud cover starts on July 28, 2020 at 00:00 UTC.
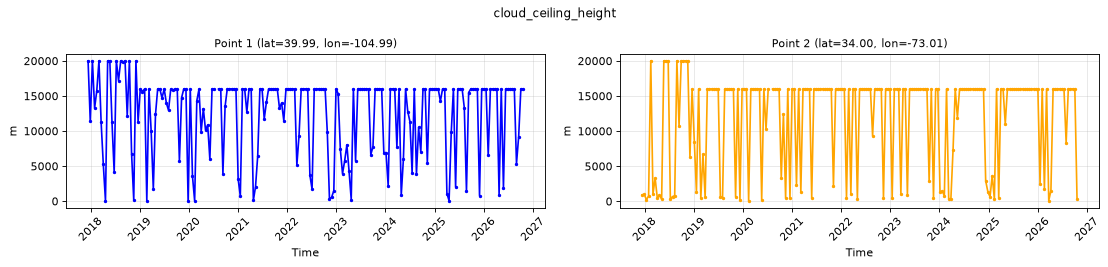
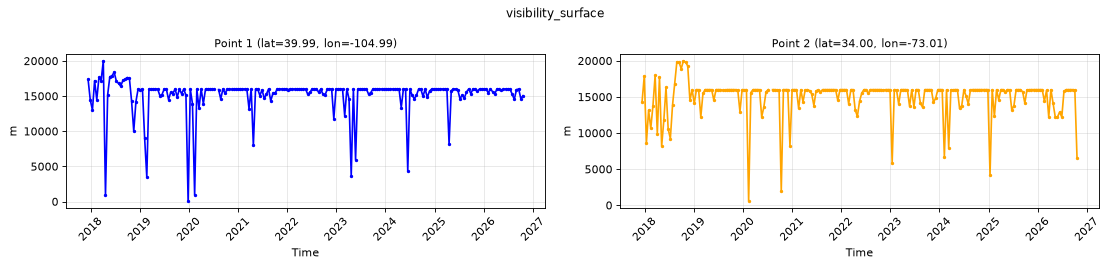
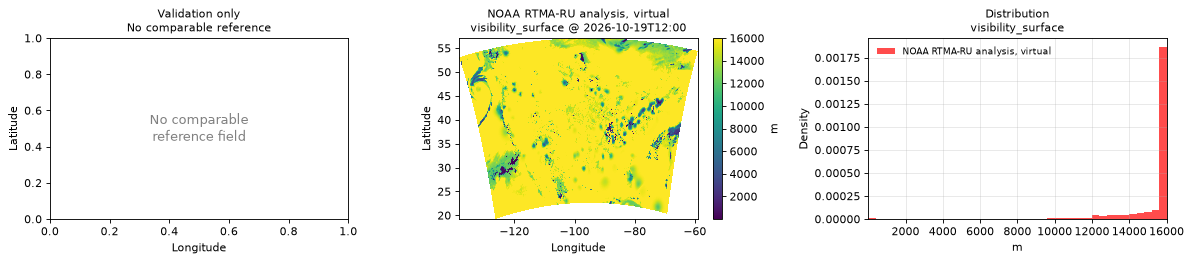
- Cloud-ceiling height and visibility limits differ between the sampled periods. On July 6, 2018 at 00:15 UTC, ceiling height ranges from 0.1 m to 20,000 m and visibility from 0 m to 20,000 m. On April 15, 2020 at 05:45 UTC and October 20, 2026 at 23:45 UTC, both range from 1 m to 16,000 m. The exact changeover and its cause are unconfirmed. See the sampled source values.
- NOAA prepares cloud-ceiling estimates in metres above ground before analysis. See NOAA’s RTMA v2.10.11 code and its rapid-update configuration (accessed October 28, 2026). Source metadata labels the field only “Ceiling” in metres. The height reference has not been verified for every historical period; this dataset makes no terrain-height adjustment.
- The two wind components follow the dataset’s map grid, not true east and north.
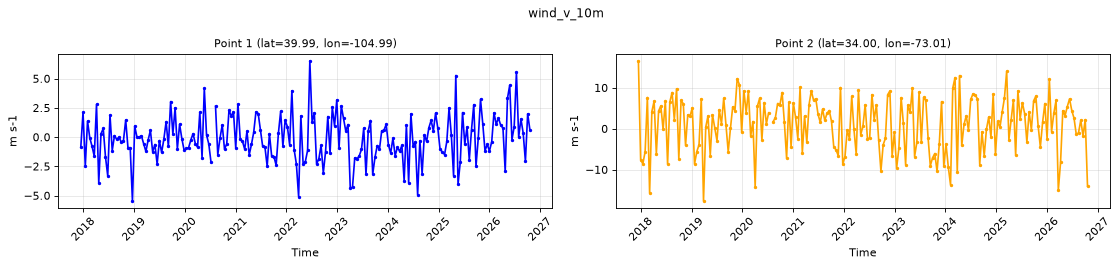
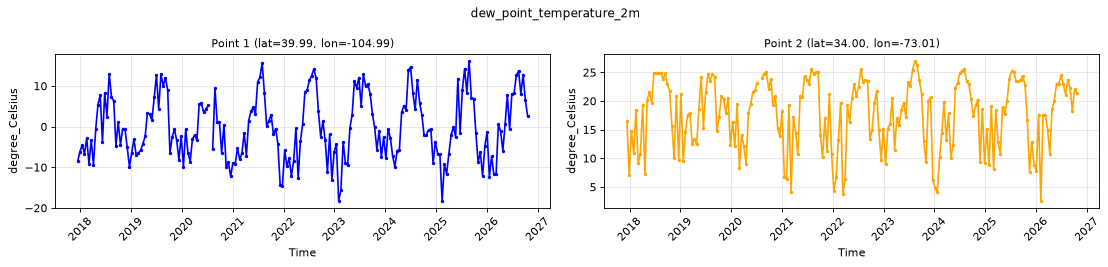
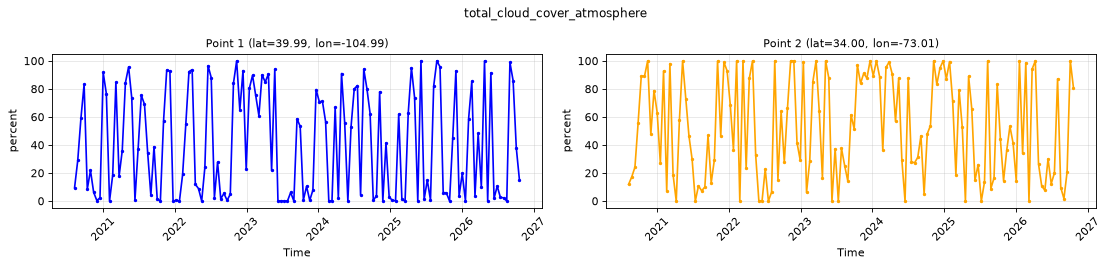
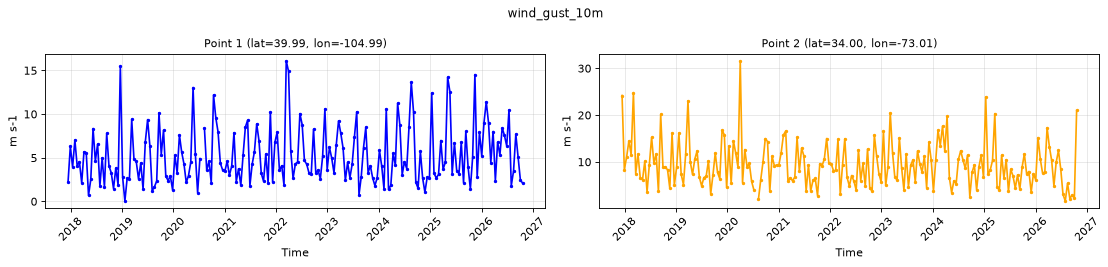
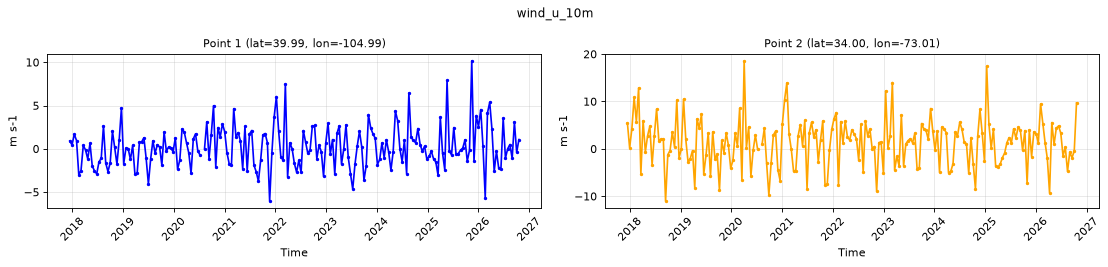
- The whole-period point plots are widely spaced samples. They use 201 on-the-hour samples, 388 hours apart, rather than every 15-minute interval.
Datasets
| Role | Name | ID | Version | URL |
|---|---|---|---|---|
| Validation | NOAA RTMA-RU analysis, virtual | noaa-rtma-ru-analysis-virtual |
v0.1.0 |
s3://dynamical-noaa-rtma/noaa-rtma-ru-analysis-virtual/v0.1.0.icechunk |
| Reference | NOAA GEFS analysis | noaa-gefs-analysis |
0.1.2 |
s3://dynamical-noaa-gefs/noaa-gefs-analysis/v0.1.2.icechunk/ |
Run parameters
| Parameter | Value |
|---|---|
| Validation dataset type | analysis |
| Validation time range | time 2017-12-13T00:00 → 2026-10-20T23:45 |
| Reference time range | time 2000-01-01T00:00 → 2026-10-26T12:00 |
| Point 1 | lat=39.9932, lon=-104.9857 |
| Point 2 | lat=33.9994, lon=-73.0068 |
| Spatial comparison time | 2026-10-19T12:00 (reference at 2026-10-19T12:00) |
| Timeseries period | 2026-10-10T23:45 - 2026-10-20T23:45 |
| Store type | virtual — availability manifest-probed; value series sampled |
Availability
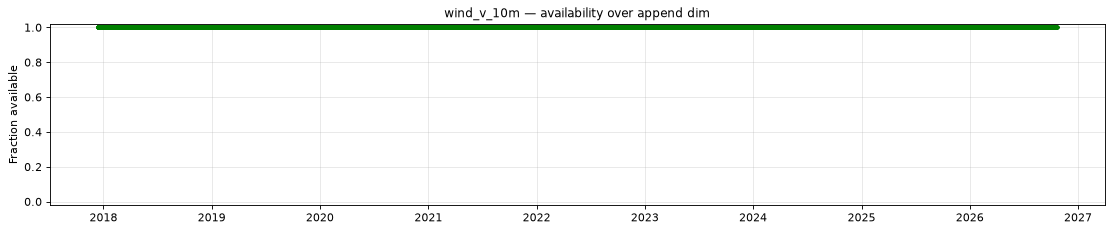
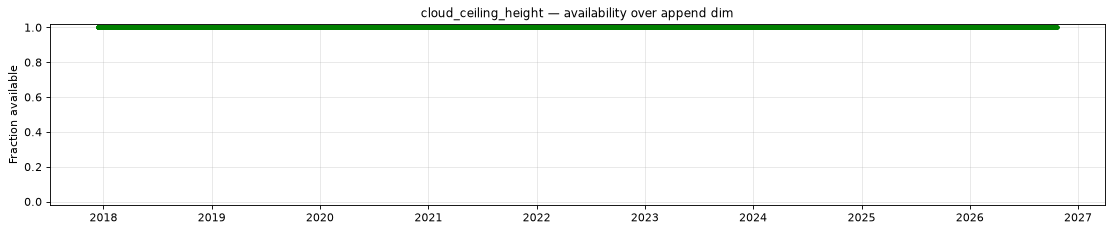
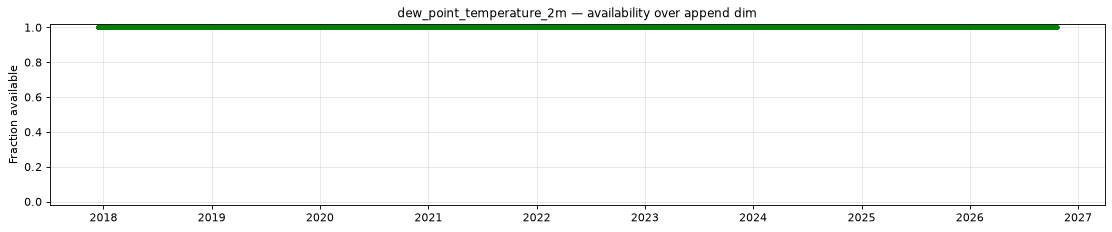
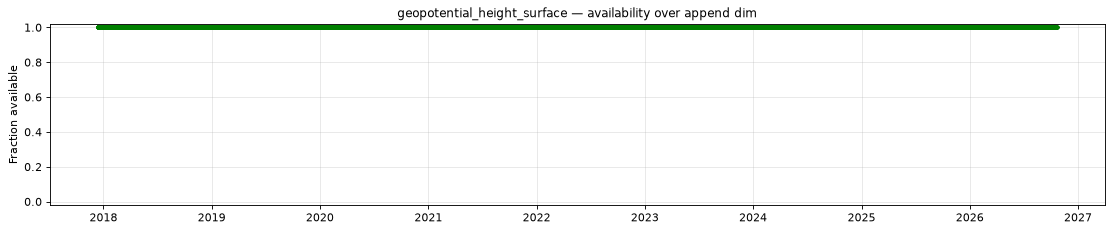
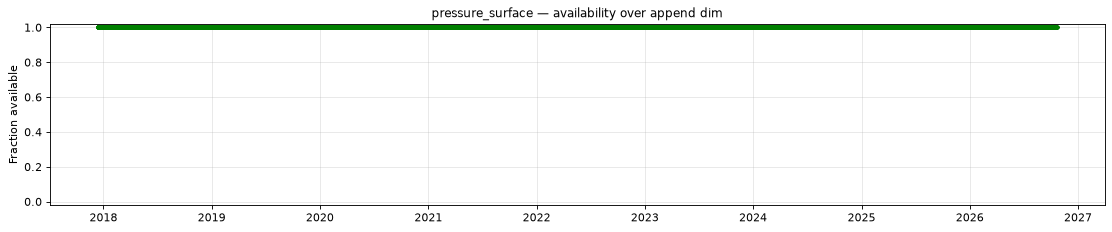
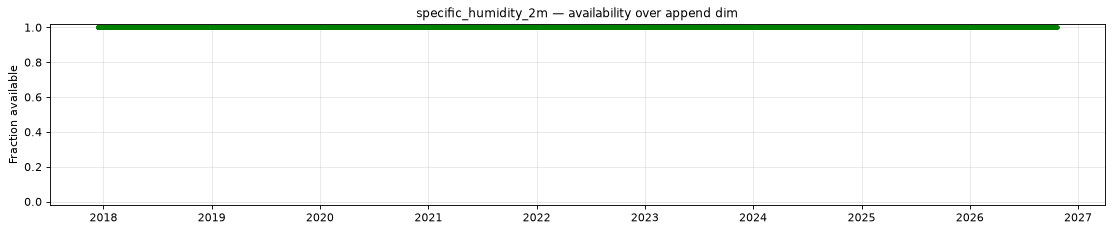
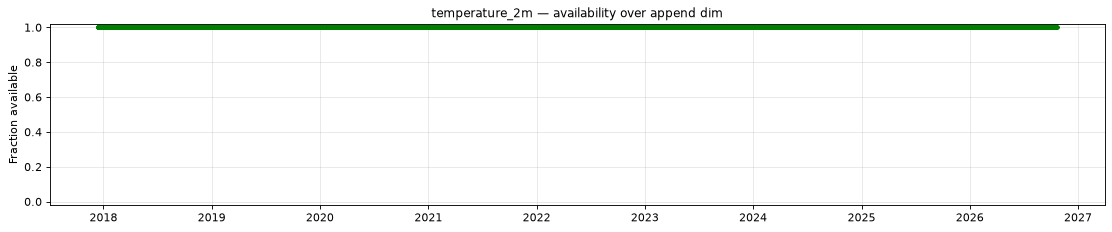
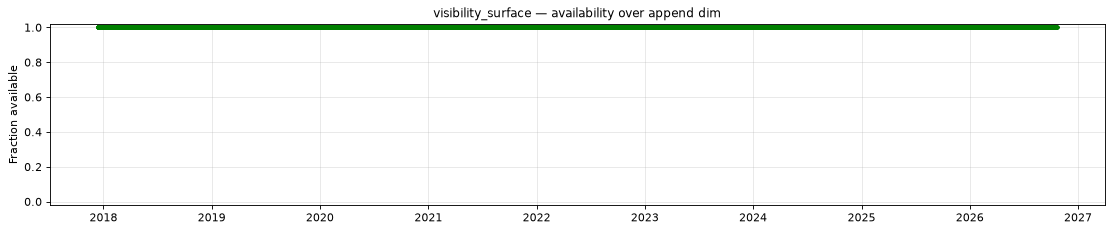
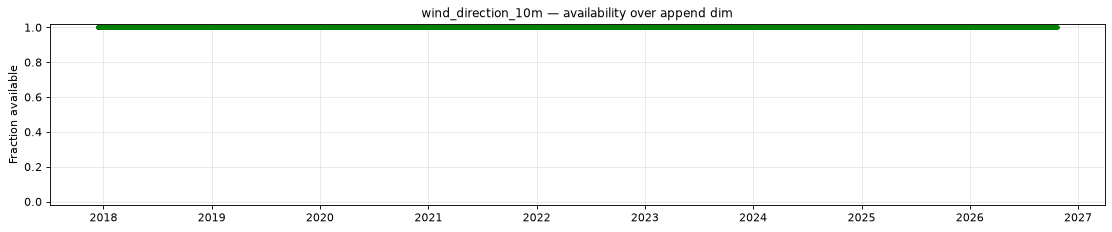
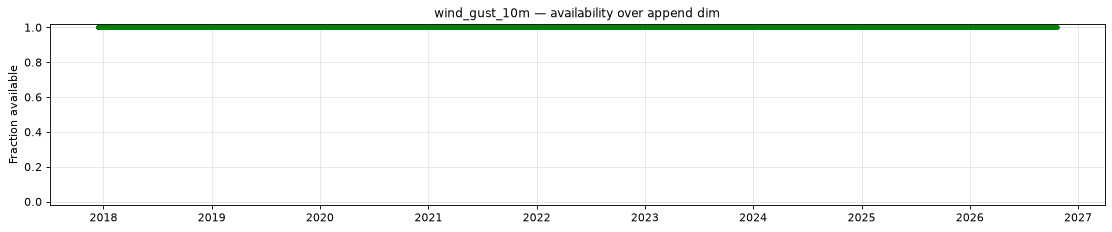
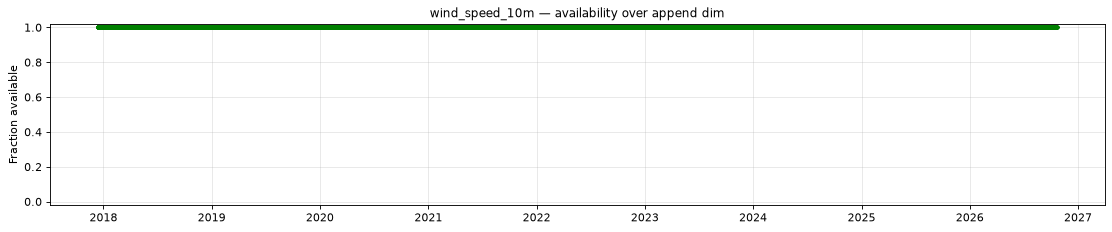
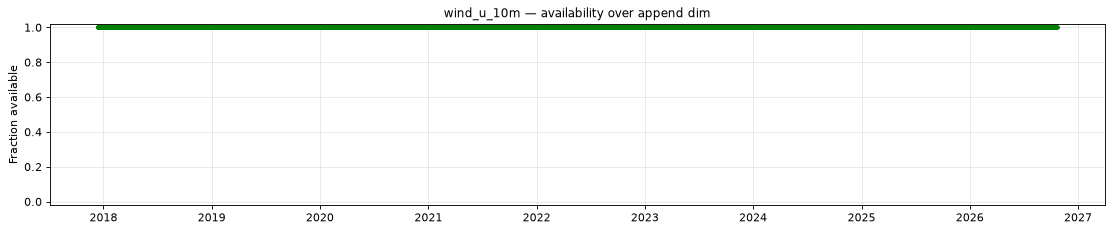
The plot below shows the availability of each variable over time — light red marks unavailable data, dark green marks present data.
| Variable | Complete positions | Incomplete % | First incomplete | Last incomplete |
|---|---|---|---|---|
cloud_ceiling_height |
310013/310464 | 0.15% | 2017-12-13T00:30 | 2026-09-14T16:45 |
dew_point_temperature_2m |
310013/310464 | 0.15% | 2017-12-13T00:30 | 2026-09-14T16:45 |
geopotential_height_surface |
310013/310464 | 0.15% | 2017-12-13T00:30 | 2026-09-14T16:45 |
pressure_surface |
310013/310464 | 0.15% | 2017-12-13T00:30 | 2026-09-14T16:45 |
specific_humidity_2m |
310013/310464 | 0.15% | 2017-12-13T00:30 | 2026-09-14T16:45 |
temperature_2m |
310013/310464 | 0.15% | 2017-12-13T00:30 | 2026-09-14T16:45 |
total_cloud_cover_atmosphere |
218477/310464 | 29.63% | 2017-12-13T00:00 | 2026-09-14T16:45 |
visibility_surface |
310013/310464 | 0.15% | 2017-12-13T00:30 | 2026-09-14T16:45 |
wind_direction_10m |
310013/310464 | 0.15% | 2017-12-13T00:30 | 2026-09-14T16:45 |
wind_gust_10m |
310013/310464 | 0.15% | 2017-12-13T00:30 | 2026-09-14T16:45 |
wind_speed_10m |
310013/310464 | 0.15% | 2017-12-13T00:30 | 2026-09-14T16:45 |
wind_u_10m |
310013/310464 | 0.15% | 2017-12-13T00:30 | 2026-09-14T16:45 |
wind_v_10m |
310013/310464 | 0.15% | 2017-12-13T00:30 | 2026-09-14T16:45 |
- Unavailable timestamps:
unavailable_timestamps.txt
Decode health
254 references decoded successfully across 20 sampled quarter-hour positions in the 310,464-position archive.
Per-variable details
cloud_ceiling_height
Metadata
| Field | Value |
|---|---|
| units | m |
| long_name | Ceiling |
| short_name | ceil |
| standard_name | n/a |
| step_type | instant |
Point time series — 2017-12-13T00:00 - 2026-10-20T23:45, sampled
| Point | min | mean | max |
|---|---|---|---|
| P1 | 21.4 | 1.233e+04 | 2e+04 |
| P2 | 39.9 | 1.184e+04 | 2e+04 |
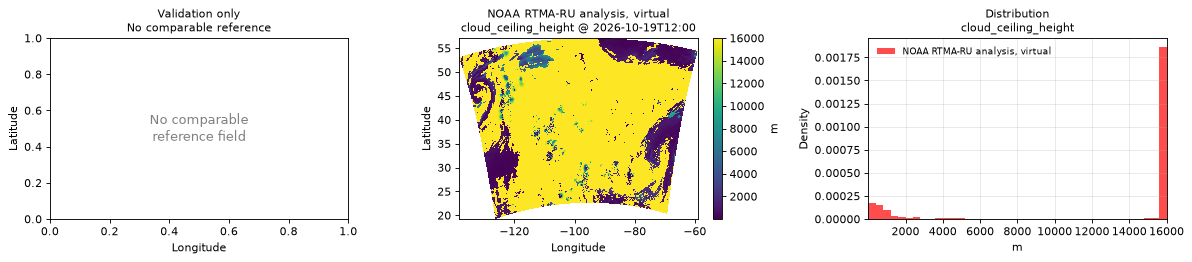
Spatial — 2026-10-19T12:00 (reference not available)
| Source | min | mean | max |
|---|---|---|---|
| Validation | 1 | 1.251e+04 | 1.6e+04 |
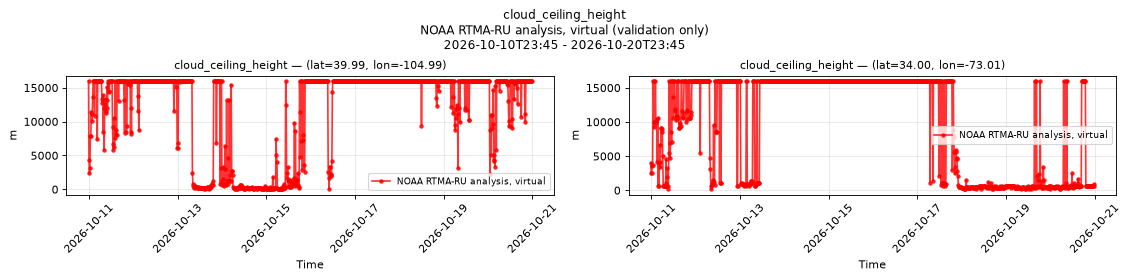
Temporal — 2026-10-10T23:45 - 2026-10-20T23:45
| Source | min | mean | max |
|---|---|---|---|
| P1 Validation | 28.8 | 1.179e+04 | 1.6e+04 |
| P2 Validation | 175.3 | 9786 | 1.6e+04 |
Availability — 310013 of 310464 positions complete (incomplete 2017-12-13T00:30 → 2026-09-14T16:45)
dew_point_temperature_2m
Metadata
| Field | Value |
|---|---|
| units | degree_Celsius |
| long_name | 2 metre dewpoint temperature |
| short_name | 2d |
| standard_name | dew_point_temperature |
| step_type | instant |
Point time series — 2017-12-13T00:00 - 2026-10-20T23:45, sampled
| Point | min | mean | max |
|---|---|---|---|
| P1 | -18.28 | -0.3293 | 16.17 |
| P2 | 2.54 | 17.66 | 27.01 |
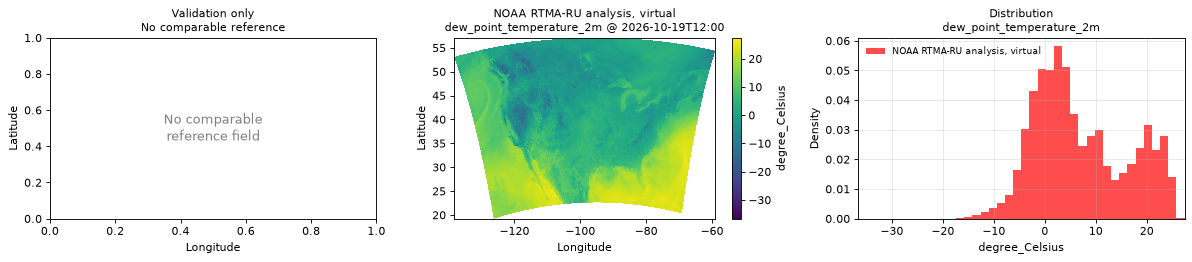
Spatial — 2026-10-19T12:00 (reference not available)
| Source | min | mean | max |
|---|---|---|---|
| Validation | -36.64 | 7.057 | 27.42 |
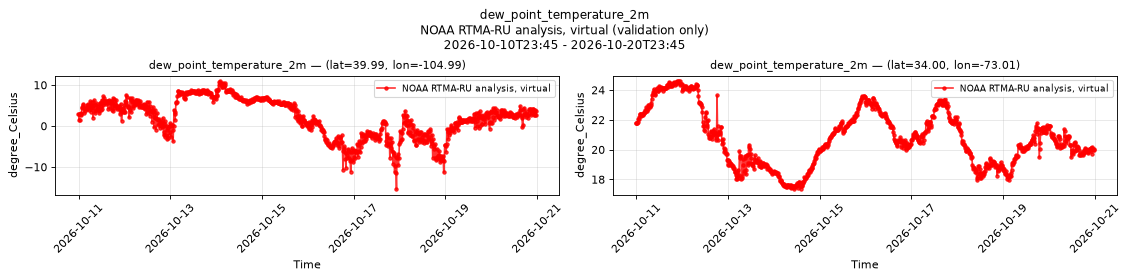
Temporal — 2026-10-10T23:45 - 2026-10-20T23:45
| Source | min | mean | max |
|---|---|---|---|
| P1 Validation | -15.4 | 2.038 | 10.99 |
| P2 Validation | 17.35 | 20.8 | 24.61 |
Availability — 310013 of 310464 positions complete (incomplete 2017-12-13T00:30 → 2026-09-14T16:45)
geopotential_height_surface
Metadata
| Field | Value |
|---|---|
| units | m |
| long_name | Geopotential height |
| short_name | gh |
| standard_name | geopotential_height |
| step_type | instant |
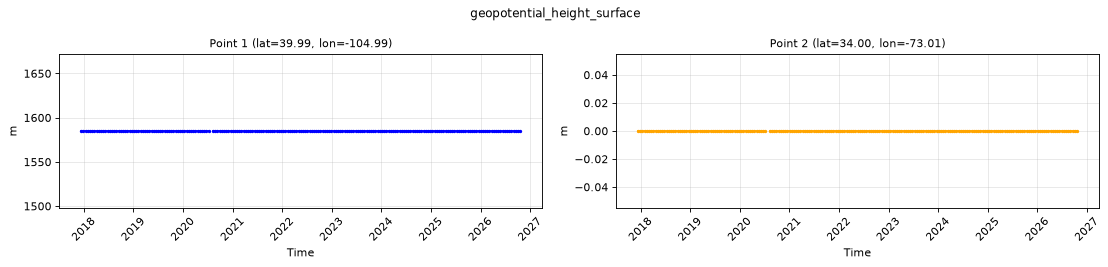
Point time series — 2017-12-13T00:00 - 2026-10-20T23:45, sampled
| Point | min | mean | max |
|---|---|---|---|
| P1 | 1585 | 1585 | 1585 |
| P2 | 0 | 0 | 0 |
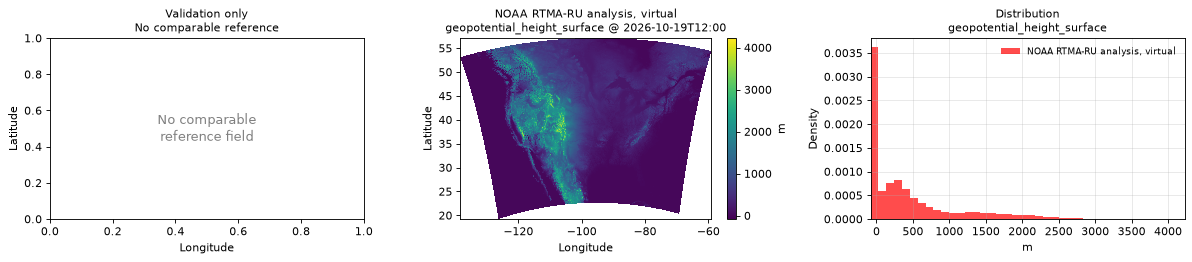
Spatial — 2026-10-19T12:00 (reference not available)
| Source | min | mean | max |
|---|---|---|---|
| Validation | -81 | 441.8 | 4226 |
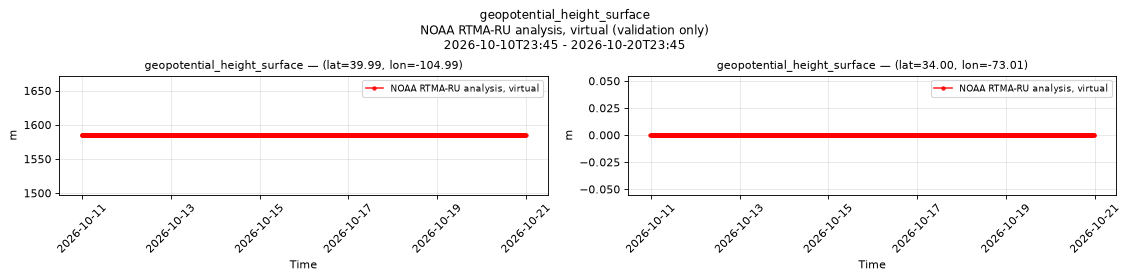
Temporal — 2026-10-10T23:45 - 2026-10-20T23:45
| Source | min | mean | max |
|---|---|---|---|
| P1 Validation | 1585 | 1585 | 1585 |
| P2 Validation | 0 | 0 | 0 |
Availability — 310013 of 310464 positions complete (incomplete 2017-12-13T00:30 → 2026-09-14T16:45)
pressure_surface
Metadata
| Field | Value |
|---|---|
| units | Pa |
| long_name | Surface pressure |
| short_name | sp |
| standard_name | surface_air_pressure |
| step_type | instant |
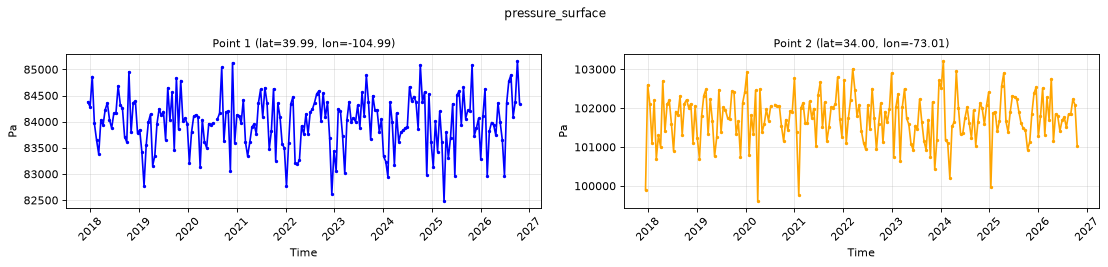
Point time series — 2017-12-13T00:00 - 2026-10-20T23:45, sampled
| Point | min | mean | max |
|---|---|---|---|
| P1 | 8.248e+04 | 8.398e+04 | 8.516e+04 |
| P2 | 9.961e+04 | 1.017e+05 | 1.032e+05 |
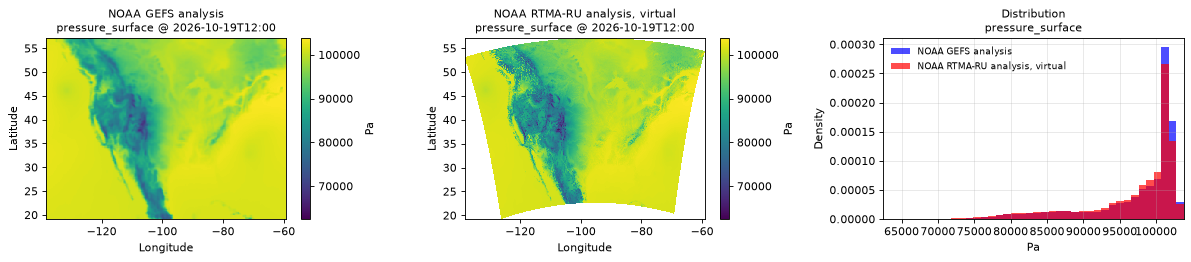
Spatial — 2026-10-19T12:00 (reference at 2026-10-19T12:00)
| Source | min | mean | max |
|---|---|---|---|
| Validation | 6.247e+04 | 9.697e+04 | 1.037e+05 |
| Reference | 6.822e+04 | 9.761e+04 | 1.038e+05 |
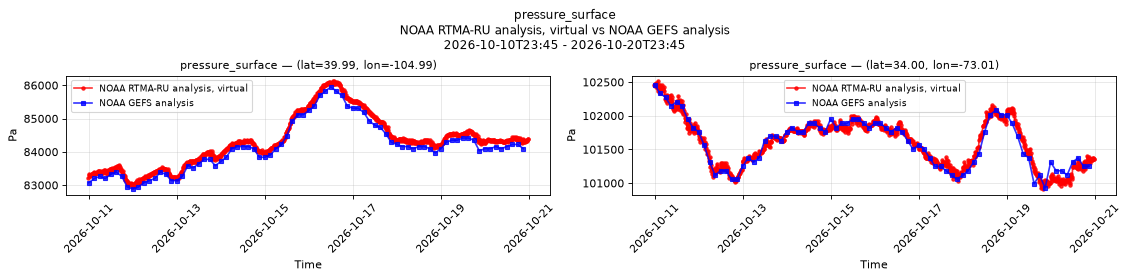
Temporal — 2026-10-10T23:45 - 2026-10-20T23:45
| Source | min | mean | max |
|---|---|---|---|
| P1 Validation | 8.299e+04 | 8.432e+04 | 8.613e+04 |
| P1 Reference | 8.288e+04 | 8.414e+04 | 8.595e+04 |
| P2 Validation | 1.009e+05 | 1.016e+05 | 1.025e+05 |
| P2 Reference | 1.009e+05 | 1.016e+05 | 1.025e+05 |
Availability — 310013 of 310464 positions complete (incomplete 2017-12-13T00:30 → 2026-09-14T16:45)
specific_humidity_2m
Metadata
| Field | Value |
|---|---|
| units | 1 |
| long_name | Specific humidity |
| short_name | q |
| standard_name | specific_humidity |
| step_type | instant |
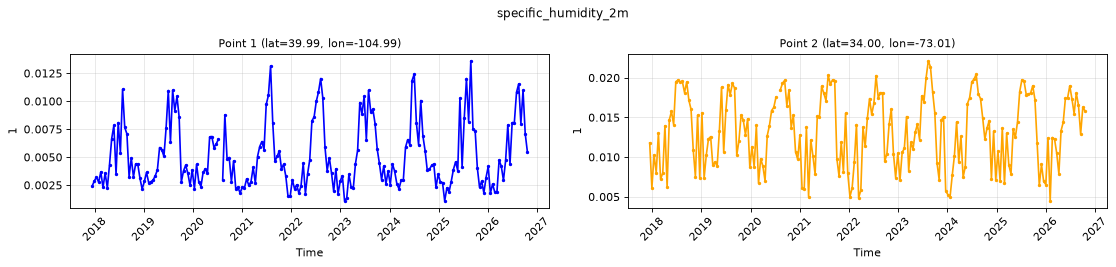
Point time series — 2017-12-13T00:00 - 2026-10-20T23:45, sampled
| Point | min | mean | max |
|---|---|---|---|
| P1 | 0.001078 | 0.005095 | 0.0136 |
| P2 | 0.004464 | 0.01319 | 0.02212 |
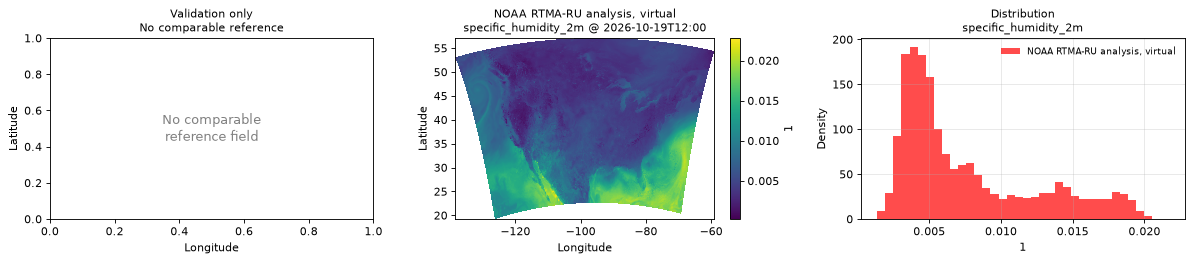
Spatial — 2026-10-19T12:00 (reference not available)
| Source | min | mean | max |
|---|---|---|---|
| Validation | 0.000244 | 0.007588 | 0.0228 |
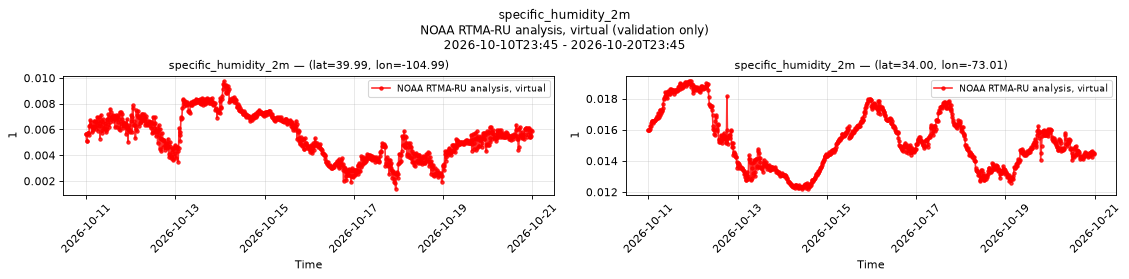
Temporal — 2026-10-10T23:45 - 2026-10-20T23:45
| Source | min | mean | max |
|---|---|---|---|
| P1 Validation | 0.001367 | 0.005496 | 0.009764 |
| P2 Validation | 0.01218 | 0.01527 | 0.01914 |
Availability — 310013 of 310464 positions complete (incomplete 2017-12-13T00:30 → 2026-09-14T16:45)
temperature_2m
Metadata
| Field | Value |
|---|---|
| units | degree_Celsius |
| long_name | 2 metre temperature |
| short_name | 2t |
| standard_name | air_temperature |
| step_type | instant |
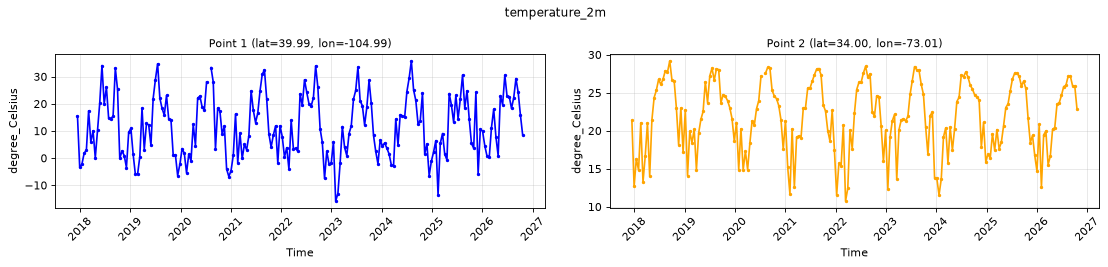
Point time series — 2017-12-13T00:00 - 2026-10-20T23:45, sampled
| Point | min | mean | max |
|---|---|---|---|
| P1 | -15.81 | 11.49 | 35.8 |
| P2 | 10.76 | 21.74 | 29.19 |
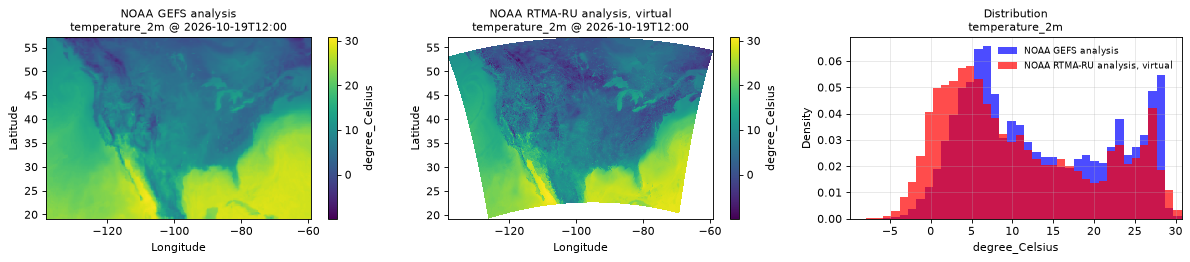
Spatial — 2026-10-19T12:00 (reference at 2026-10-19T12:00)
| Source | min | mean | max |
|---|---|---|---|
| Validation | -9.9 | 10.9 | 30.74 |
| Reference | -6.938 | 13.39 | 30 |
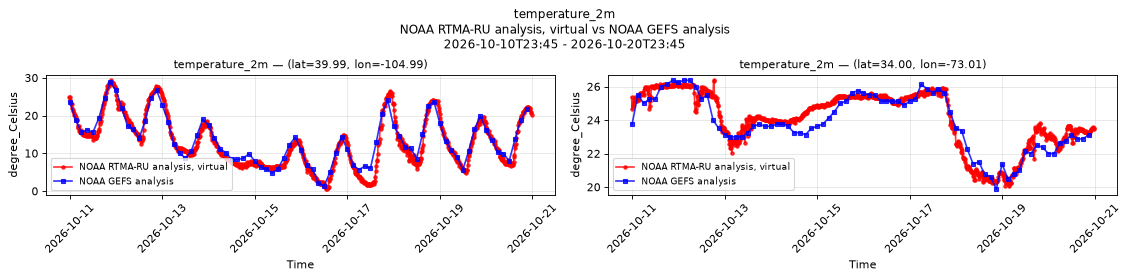
Temporal — 2026-10-10T23:45 - 2026-10-20T23:45
| Source | min | mean | max |
|---|---|---|---|
| P1 Validation | 0.52 | 13.1 | 29.34 |
| P1 Reference | 1.367 | 13.63 | 28.88 |
| P2 Validation | 20.07 | 24.09 | 26.37 |
| P2 Reference | 19.88 | 23.89 | 26.38 |
Availability — 310013 of 310464 positions complete (incomplete 2017-12-13T00:30 → 2026-09-14T16:45)
total_cloud_cover_atmosphere
Metadata
| Field | Value |
|---|---|
| units | percent |
| long_name | Total cloud cover |
| short_name | tcc |
| standard_name | cloud_area_fraction |
| step_type | instant |
Point time series — 2017-12-13T00:00 - 2026-10-20T23:45, sampled
| Point | min | mean | max |
|---|---|---|---|
| P1 | 0 | 39.83 | 100 |
| P2 | 0 | 51.93 | 100 |
Spatial — 2026-10-19T12:00 (reference at 2026-10-19T12:00)
| Source | min | mean | max |
|---|---|---|---|
| Validation | 0 | 41.85 | 100 |
| Reference | 0 | 43.98 | 100 |
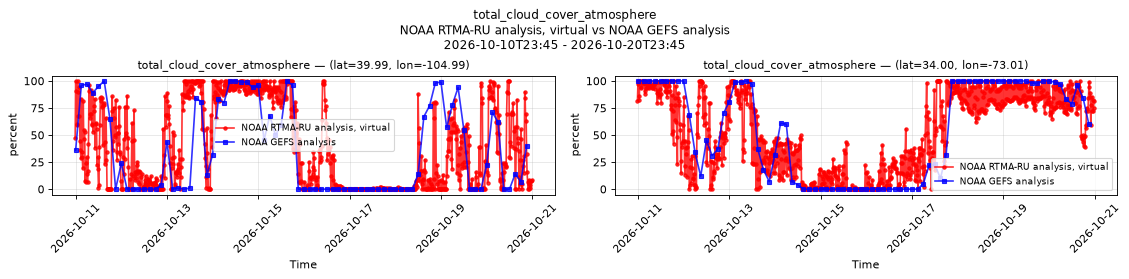
Temporal — 2026-10-10T23:45 - 2026-10-20T23:45
| Source | min | mean | max |
|---|---|---|---|
| P1 Validation | 0 | 39.47 | 100 |
| P1 Reference | 0 | 36.08 | 100 |
| P2 Validation | 0 | 53.61 | 100 |
| P2 Reference | 0 | 54.83 | 100 |
Availability — 218477 of 310464 positions complete (incomplete 2017-12-13T00:00 → 2026-09-14T16:45)
visibility_surface
Metadata
| Field | Value |
|---|---|
| units | m |
| long_name | Visibility |
| short_name | vis |
| standard_name | visibility_in_air |
| step_type | instant |
Point time series — 2017-12-13T00:00 - 2026-10-20T23:45, sampled
| Point | min | mean | max |
|---|---|---|---|
| P1 | 76 | 1.516e+04 | 2e+04 |
| P2 | 580 | 1.497e+04 | 1.998e+04 |
Spatial — 2026-10-19T12:00 (reference not available)
| Source | min | mean | max |
|---|---|---|---|
| Validation | 1 | 1.513e+04 | 1.6e+04 |
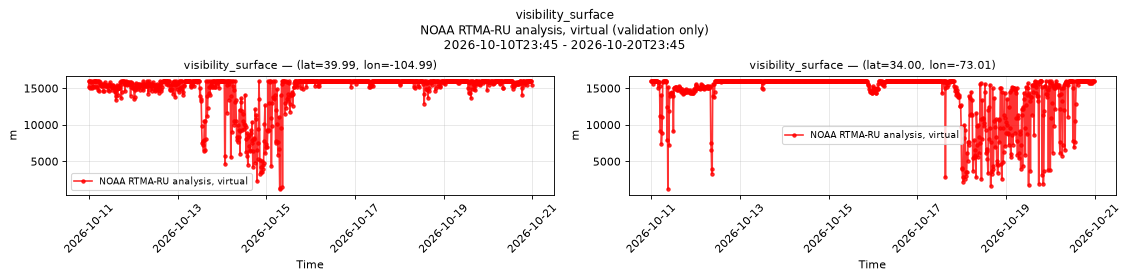
Temporal — 2026-10-10T23:45 - 2026-10-20T23:45
| Source | min | mean | max |
|---|---|---|---|
| P1 Validation | 1196 | 1.484e+04 | 1.6e+04 |
| P2 Validation | 1199 | 1.432e+04 | 1.6e+04 |
Availability — 310013 of 310464 positions complete (incomplete 2017-12-13T00:30 → 2026-09-14T16:45)
wind_direction_10m
Metadata
| Field | Value |
|---|---|
| units | degree |
| long_name | 10 metre wind direction |
| short_name | 10wdir |
| standard_name | wind_from_direction |
| step_type | instant |
| comment | Direction the wind blows from, clockwise from true north. |
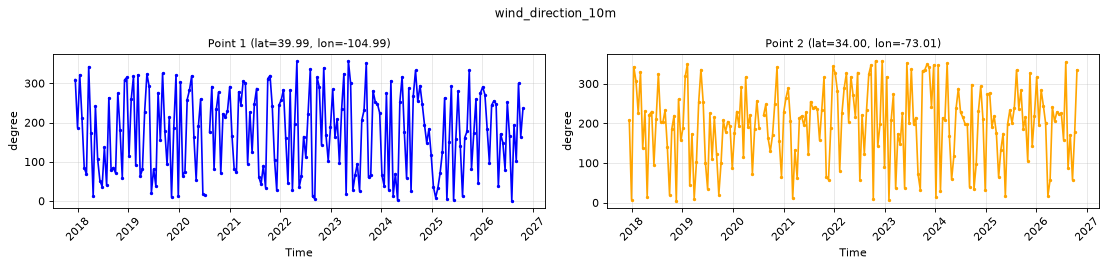
Point time series — 2017-12-13T00:00 - 2026-10-20T23:45, sampled
| Point | min | mean | max |
|---|---|---|---|
| P1 | 0 | 325.5 | 357.1 |
| P2 | 4.2 | 230.9 | 357.6 |
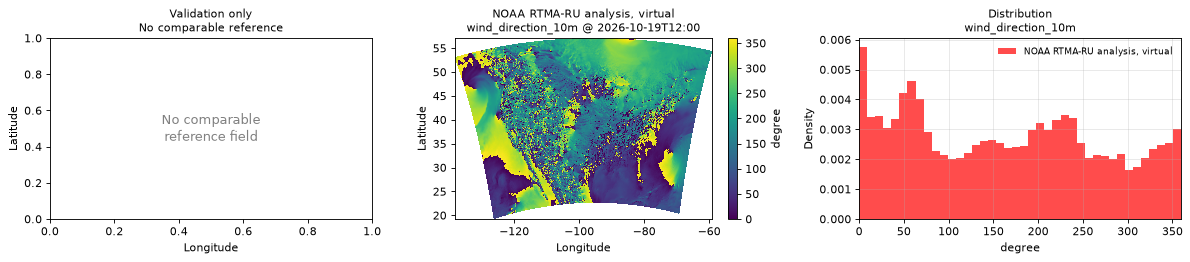
Spatial — 2026-10-19T12:00 (reference not available)
| Source | min | mean | max |
|---|---|---|---|
| Validation | 0 | 46.95 | 360 |
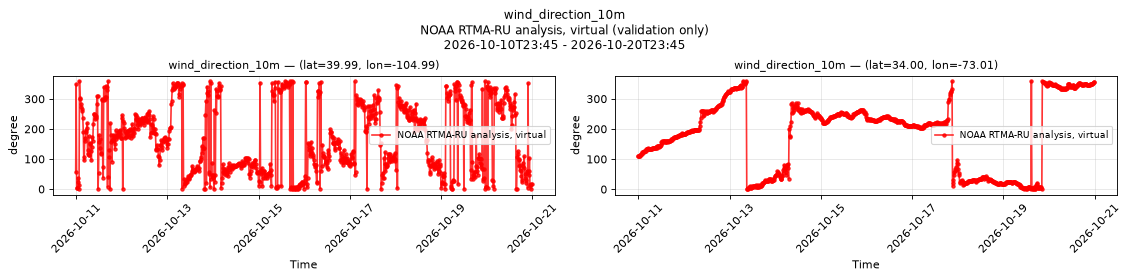
Temporal — 2026-10-10T23:45 - 2026-10-20T23:45
| Source | min | mean | max |
|---|---|---|---|
| P1 Validation | 0 | 37.77 | 359.9 |
| P2 Validation | 0.5 | 294.5 | 359.3 |
Availability — 310013 of 310464 positions complete (incomplete 2017-12-13T00:30 → 2026-09-14T16:45)
wind_gust_10m
Metadata
| Field | Value |
|---|---|
| units | m s-1 |
| long_name | Wind speed (gust) |
| short_name | gust |
| standard_name | wind_speed_of_gust |
| step_type | instant |
Point time series — 2017-12-13T00:00 - 2026-10-20T23:45, sampled
| Point | min | mean | max |
|---|---|---|---|
| P1 | 0.05 | 5.248 | 16.1 |
| P2 | 1.66 | 9.451 | 31.6 |
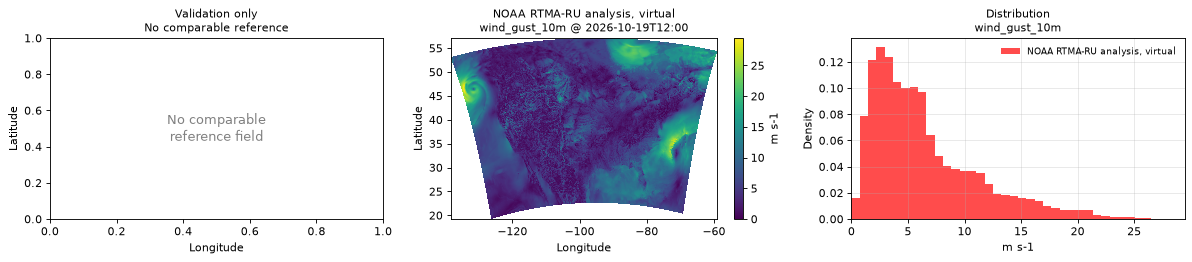
Spatial — 2026-10-19T12:00 (reference not available)
| Source | min | mean | max |
|---|---|---|---|
| Validation | 0 | 6.428 | 29.46 |
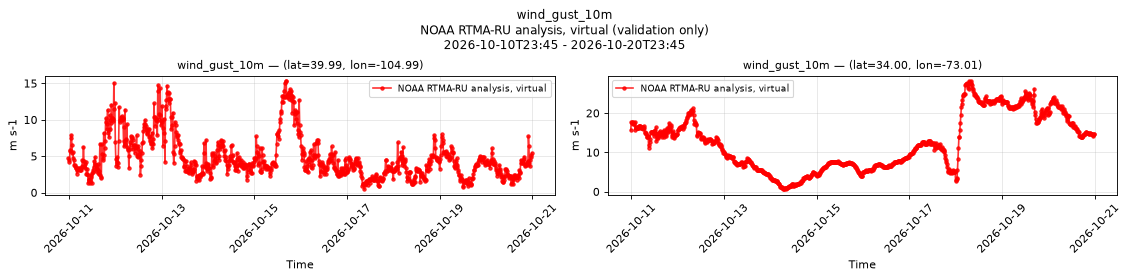
Temporal — 2026-10-10T23:45 - 2026-10-20T23:45
| Source | min | mean | max |
|---|---|---|---|
| P1 Validation | 0.47 | 4.827 | 15.32 |
| P2 Validation | 0.64 | 12.57 | 28.19 |
Availability — 310013 of 310464 positions complete (incomplete 2017-12-13T00:30 → 2026-09-14T16:45)
wind_speed_10m
Metadata
| Field | Value |
|---|---|
| units | m s-1 |
| long_name | 10 metre wind speed |
| short_name | 10si |
| standard_name | wind_speed |
| step_type | instant |
Point time series — 2017-12-13T00:00 - 2026-10-20T23:45, sampled
| Point | min | mean | max |
|---|---|---|---|
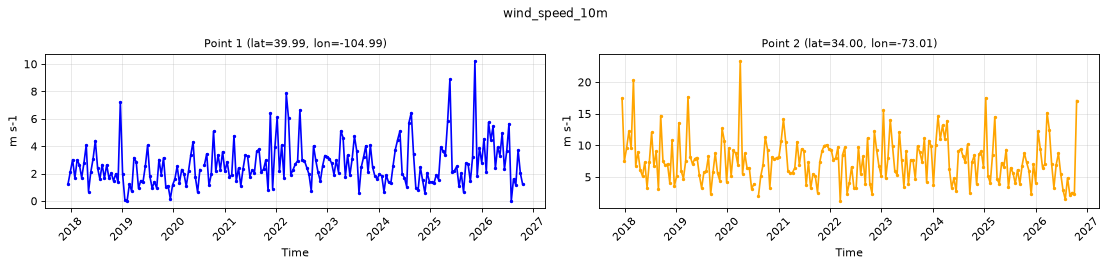
| P1 | 0 | 2.655 | 10.23 |
| P2 | 1.21 | 7.564 | 23.35 |
Spatial — 2026-10-19T12:00 (reference not available)
| Source | min | mean | max |
|---|---|---|---|
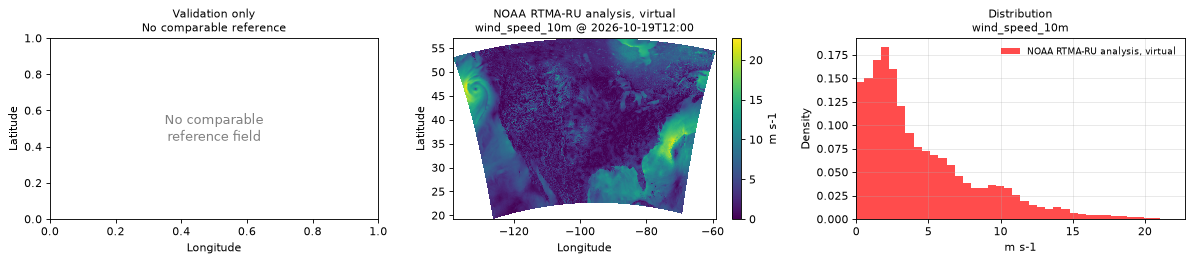
| Validation | 0 | 4.486 | 22.75 |
Temporal — 2026-10-10T23:45 - 2026-10-20T23:45
| Source | min | mean | max |
|---|---|---|---|
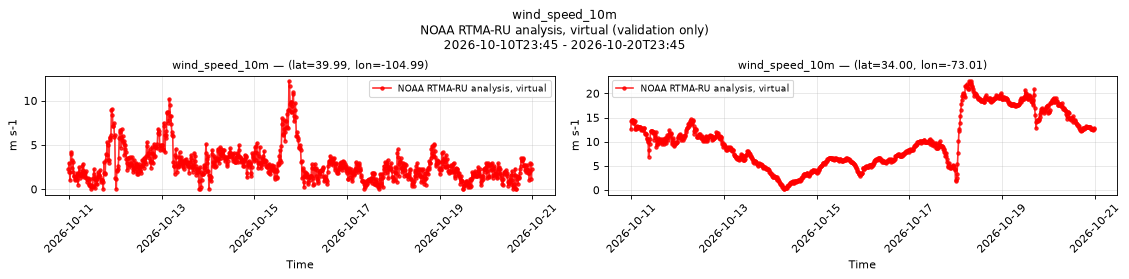
| P1 Validation | 0 | 2.745 | 12.23 |
| P2 Validation | 0.17 | 10.31 | 22.58 |
Availability — 310013 of 310464 positions complete (incomplete 2017-12-13T00:30 → 2026-09-14T16:45)
wind_u_10m
Metadata
| Field | Value |
|---|---|
| units | m s-1 |
| long_name | 10 metre U wind component |
| short_name | 10u |
| standard_name | x_wind |
| step_type | instant |
| comment | Velocity along the model grid's x dimension, not eastward velocity. |
Point time series — 2017-12-13T00:00 - 2026-10-20T23:45, sampled
| Point | min | mean | max |
|---|---|---|---|
| P1 | -6.04 | 0.1855 | 10.16 |
| P2 | -11.01 | 1.349 | 18.56 |
Spatial — 2026-10-19T12:00 (reference at 2026-10-19T12:00)
| Source | min | mean | max |
|---|---|---|---|
| Validation | -20.22 | -0.3779 | 16.8 |
| Reference | -23 | -0.454 | 18.25 |
Temporal — 2026-10-10T23:45 - 2026-10-20T23:45
| Source | min | mean | max |
|---|---|---|---|
| P1 Validation | -5.01 | -0.4706 | 5.91 |
| P1 Reference | -4.562 | -0.5538 | 4.062 |
| P2 Validation | -14.24 | 1.384 | 11.94 |
| P2 Reference | -14.5 | 0.9561 | 12.38 |
Availability — 310013 of 310464 positions complete (incomplete 2017-12-13T00:30 → 2026-09-14T16:45)
wind_v_10m
Metadata
| Field | Value |
|---|---|
| units | m s-1 |
| long_name | 10 metre V wind component |
| short_name | 10v |
| standard_name | y_wind |
| step_type | instant |
| comment | Velocity along the model grid's y dimension, not northward velocity. |
Point time series — 2017-12-13T00:00 - 2026-10-20T23:45, sampled
| Point | min | mean | max |
|---|---|---|---|
| P1 | -5.47 | -0.1334 | 6.51 |
| P2 | -17.66 | 1.119 | 16.55 |
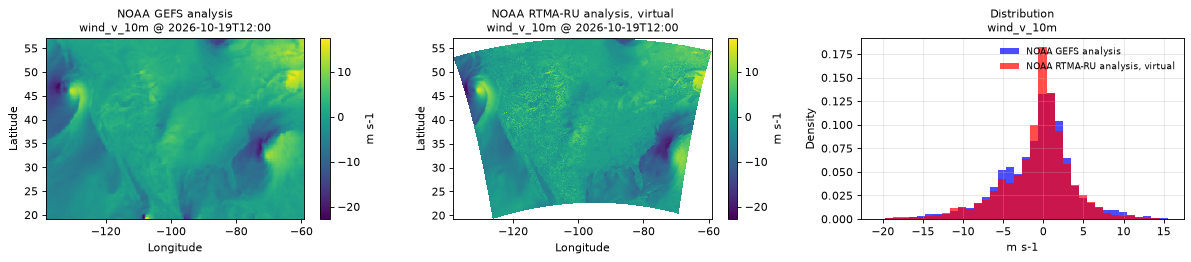
Spatial — 2026-10-19T12:00 (reference at 2026-10-19T12:00)
| Source | min | mean | max |
|---|---|---|---|
| Validation | -22.09 | -0.8078 | 15.42 |
| Reference | -22.75 | -0.7699 | 17.5 |
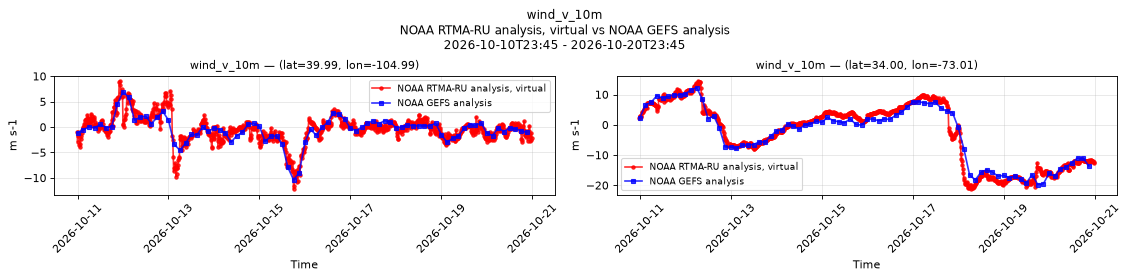
Temporal — 2026-10-10T23:45 - 2026-10-20T23:45
| Source | min | mean | max |
|---|---|---|---|
| P1 Validation | -12.22 | -0.4303 | 9.06 |
| P1 Reference | -10.38 | -0.4352 | 6.938 |
| P2 Validation | -21.28 | -2.719 | 14.49 |
| P2 Reference | -19.75 | -2.884 | 12.25 |
Availability — 310013 of 310464 positions complete (incomplete 2017-12-13T00:30 → 2026-09-14T16:45)