NOAA RTMA analysis, virtual validation report
This dataset validation report plots a sample of values from the NOAA RTMA analysis, virtual dataset over time and across space, comparing where possible to a previously validated reference dataset. It also reports the quantity of unavailable values and their associated timestamps. These analyses are one layer of a multi-layered dataset validation process we perform at dynamical.org and also provide users a preview of the dataset contents.
Report generation start time: 2026-10-19T20:44:17 UTC
Summary
This dataset has been reviewed and is ready for use.
What looks good
- All available source hours are included for all 13 variables.
- Sampled values are readable and match the source files.
- Spatial patterns, units and changes over time are consistent with the source and comparable reference data.
Review notes
-
111 hourly steps are missing from NOAA's public archive for all 13 variables on 17 dates. Most cluster in March–May 2020 (90 hours); the remaining gaps fall between July 2017 and November 2020, apart from September 23, 2026 at 19:00 UTC (see the missing timestamps file).
-
Treat capped ceiling and visibility values as bounds, not exact measurements or missing data.
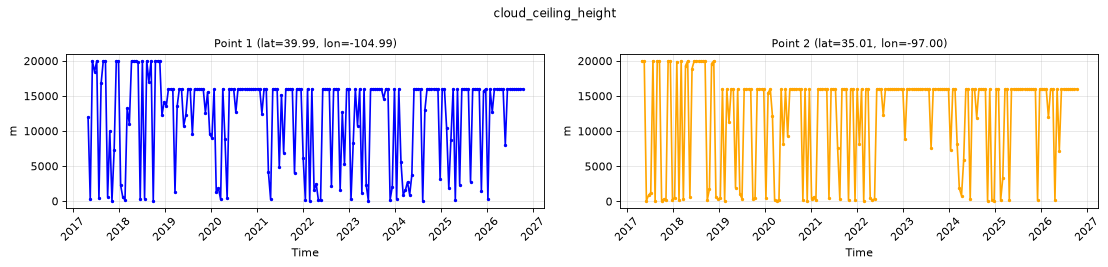
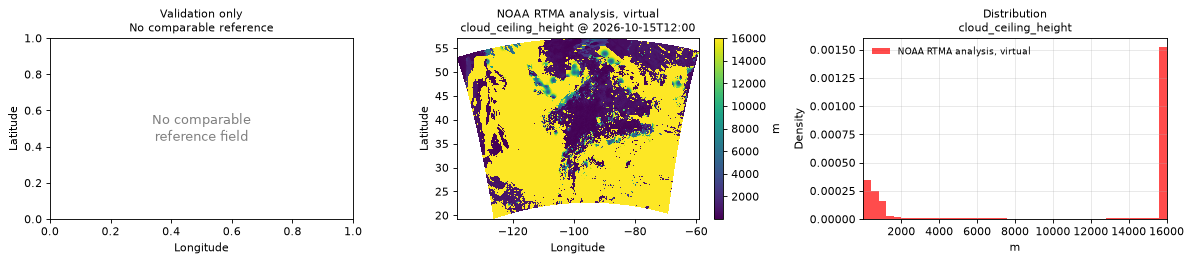
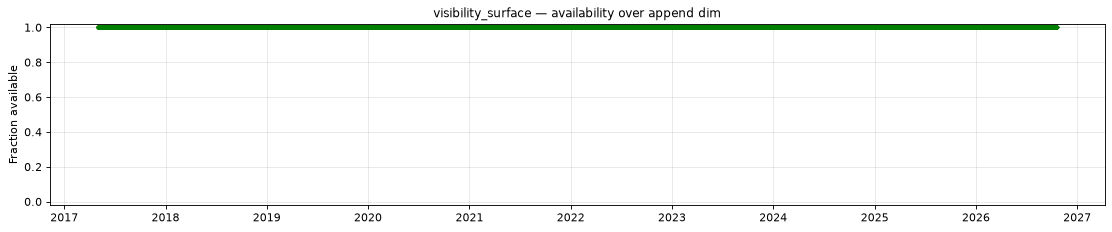
cloud_ceiling_height: the cap is 20,000 m through December 3, 2018 at 17:00 UTC and 16,000 m from 18:00 UTC that day. A value at the cap means a ceiling at least that high; current processing also uses it for no-ceiling conditions.visibility_surface: the cap is 20,000 m through December 3, 2018 at 17:00 UTC and 16,000 m from 18:00 UTC that day. A value at the cap means visibility at least that far.
Datasets
| Role | Name | ID | Version | URL |
|---|---|---|---|---|
| Validation | NOAA RTMA analysis, virtual | noaa-rtma-analysis-virtual |
v0.1.0 |
s3://dynamical-noaa-rtma/noaa-rtma-analysis-virtual/v0.1.0.icechunk |
| Reference | NOAA GEFS analysis | noaa-gefs-analysis |
0.1.2 |
s3://dynamical-noaa-gefs/noaa-gefs-analysis/v0.1.2.icechunk/ |
Run parameters
| Parameter | Value |
|---|---|
| Validation dataset type | analysis |
| Validation time range | time 2017-05-02T00:00 → 2026-10-18T23:00 |
| Reference time range | time 2000-01-01T00:00 → 2026-10-19T12:00 |
| Point 1 | lat=39.9932, lon=-104.9857 |
| Point 2 | lat=35.0104, lon=-97.0039 |
| Spatial comparison time | 2026-10-15T12:00 (reference at 2026-10-15T12:00) |
| Timeseries period | 2026-10-08T23:00 - 2026-10-18T23:00 |
| Store type | virtual — availability manifest-probed; value series sampled |
Availability
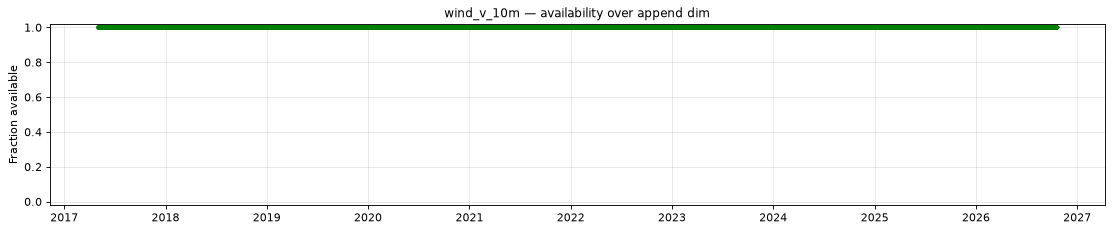
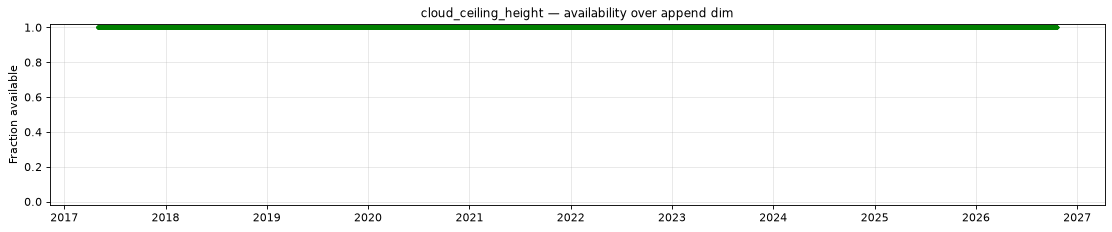
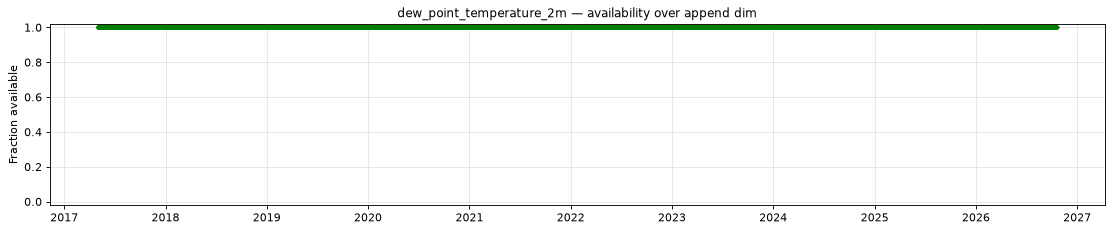
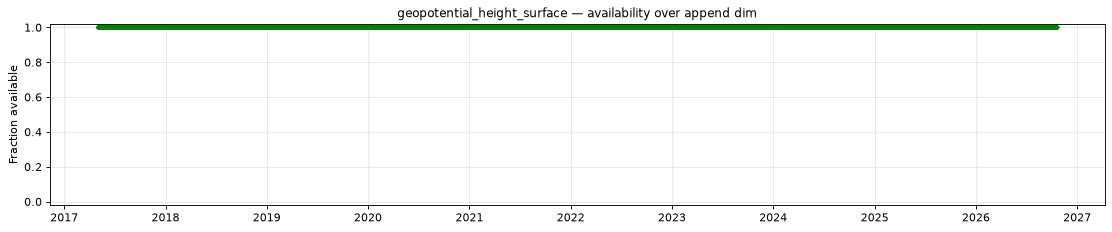
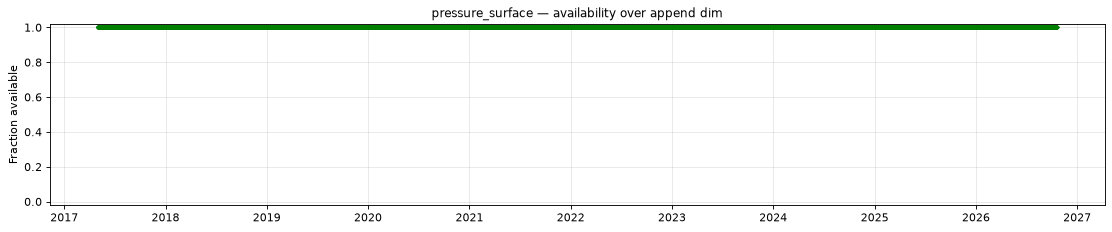
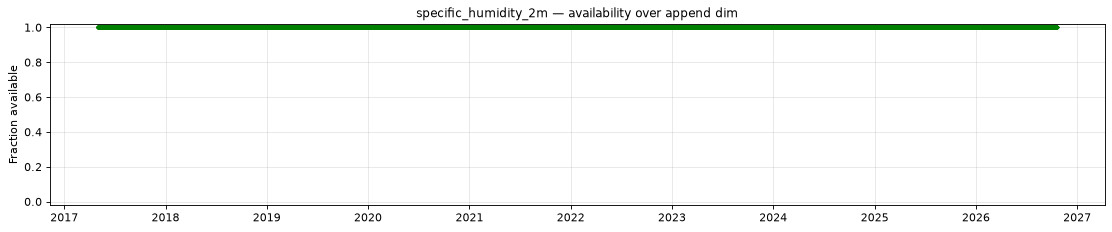
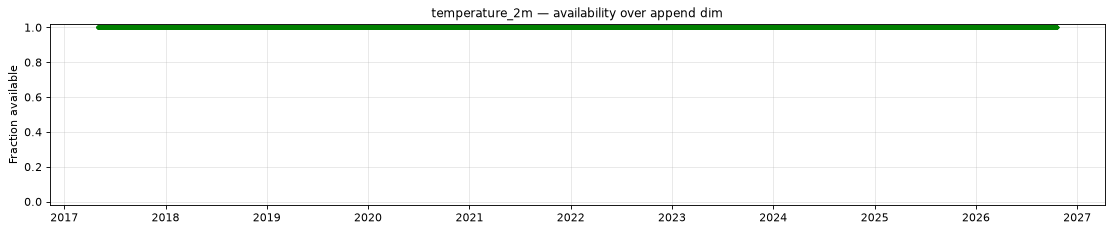
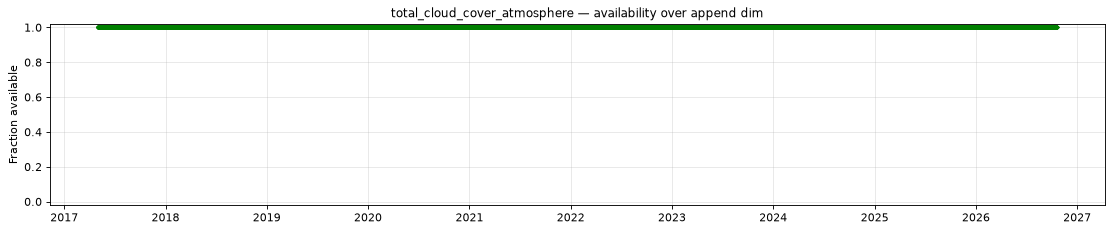
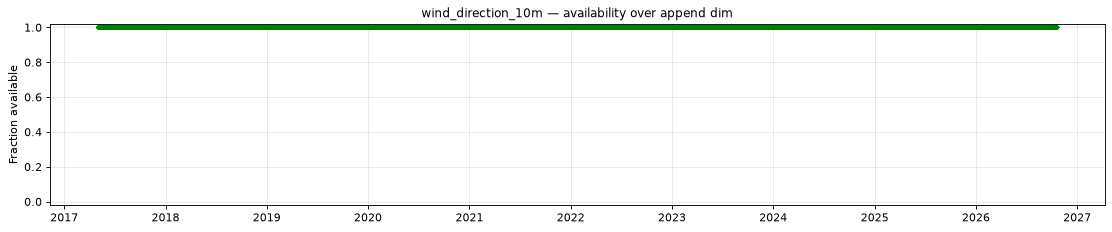
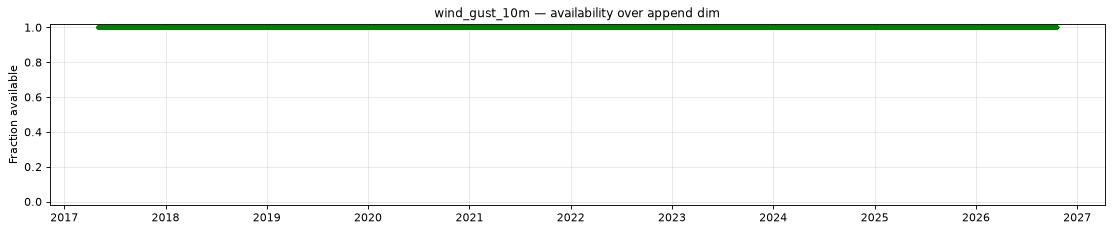
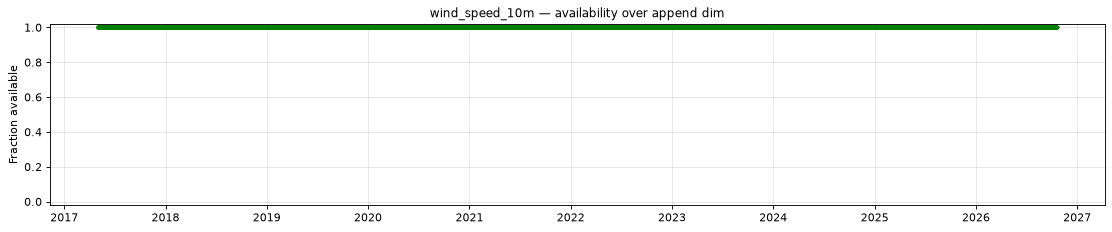
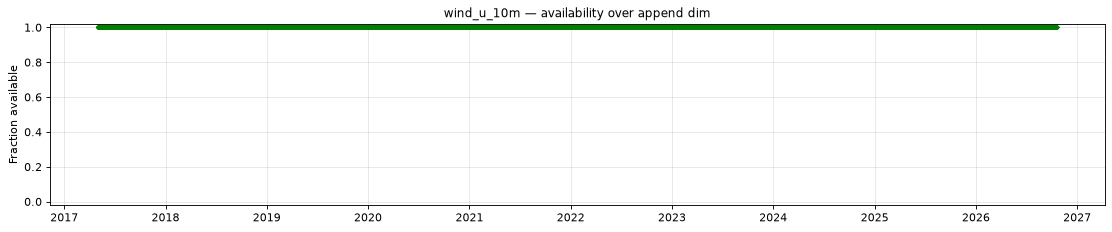
The plot below shows the availability of each variable over time — light red marks unavailable data, dark green marks present data.
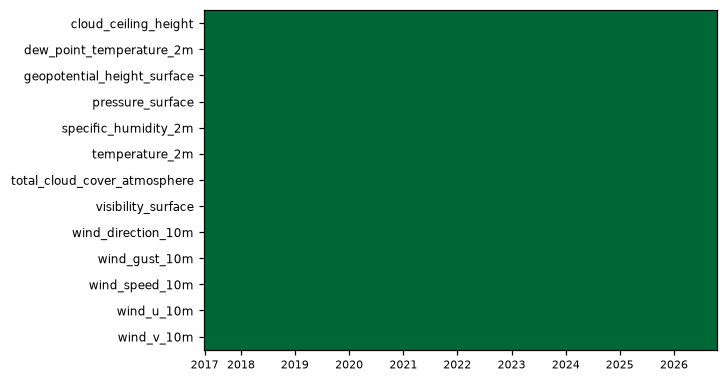
| Variable | Complete positions | Incomplete % | First incomplete | Last incomplete |
|---|---|---|---|---|
cloud_ceiling_height |
82857/82968 | 0.13% | 2017-07-11T14:00 | 2026-09-23T19:00 |
dew_point_temperature_2m |
82857/82968 | 0.13% | 2017-07-11T14:00 | 2026-09-23T19:00 |
geopotential_height_surface |
82857/82968 | 0.13% | 2017-07-11T14:00 | 2026-09-23T19:00 |
pressure_surface |
82857/82968 | 0.13% | 2017-07-11T14:00 | 2026-09-23T19:00 |
specific_humidity_2m |
82857/82968 | 0.13% | 2017-07-11T14:00 | 2026-09-23T19:00 |
temperature_2m |
82857/82968 | 0.13% | 2017-07-11T14:00 | 2026-09-23T19:00 |
total_cloud_cover_atmosphere |
82857/82968 | 0.13% | 2017-07-11T14:00 | 2026-09-23T19:00 |
visibility_surface |
82857/82968 | 0.13% | 2017-07-11T14:00 | 2026-09-23T19:00 |
wind_direction_10m |
82857/82968 | 0.13% | 2017-07-11T14:00 | 2026-09-23T19:00 |
wind_gust_10m |
82857/82968 | 0.13% | 2017-07-11T14:00 | 2026-09-23T19:00 |
wind_speed_10m |
82857/82968 | 0.13% | 2017-07-11T14:00 | 2026-09-23T19:00 |
wind_u_10m |
82857/82968 | 0.13% | 2017-07-11T14:00 | 2026-09-23T19:00 |
wind_v_10m |
82857/82968 | 0.13% | 2017-07-11T14:00 | 2026-09-23T19:00 |
- Unavailable timestamps:
unavailable_timestamps.txt
Decode health
260 references decoded successfully: all 13 fields at each of 20 sampled analysis positions out of 82,968. This analysis dataset has no forecast-lead or vertical-level dimension. This is sampled decode health, not an exhaustive value scan.
Per-variable details
cloud_ceiling_height
Metadata
| Field | Value |
|---|---|
| units | m |
| long_name | Ceiling |
| short_name | ceil |
| standard_name | n/a |
| step_type | instant |
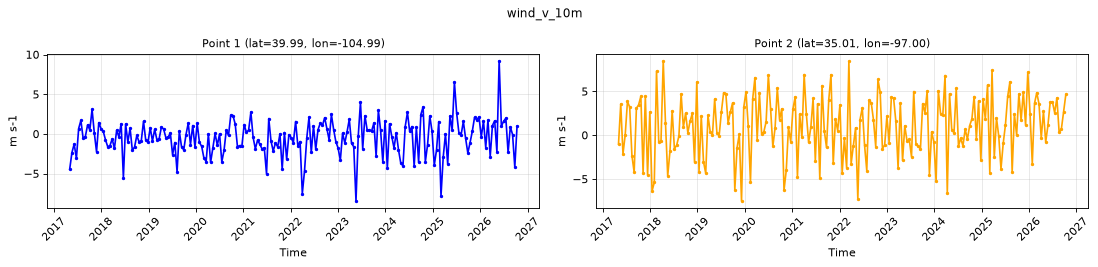
Point time series — 2017-05-02T00:00 - 2026-10-18T23:00, sampled lead=None
| Point | min | mean | max |
|---|---|---|---|
| P1 | 12.6 | 1.205e+04 | 2e+04 |
| P2 | 49.3 | 1.194e+04 | 2e+04 |
Spatial — 2026-10-15T12:00 (reference not available)
| Source | min | mean | max |
|---|---|---|---|
| Validation | 1 | 1.056e+04 | 1.6e+04 |
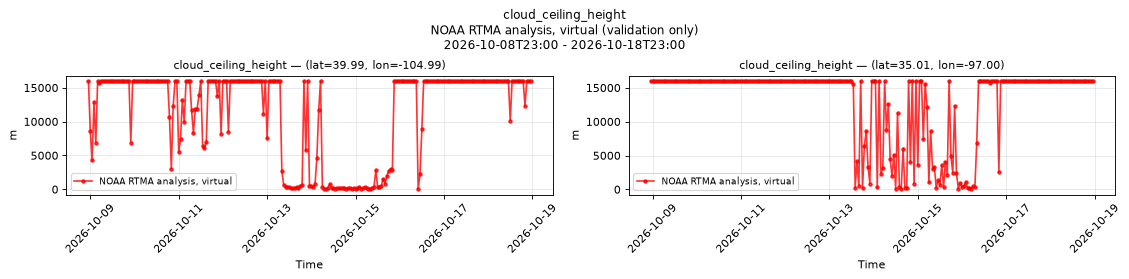
Temporal — 2026-10-08T23:00 - 2026-10-18T23:00
| Source | min | mean | max |
|---|---|---|---|
| P1 Validation | 24.7 | 1.146e+04 | 1.6e+04 |
| P2 Validation | 37.4 | 1.306e+04 | 1.6e+04 |
Availability — 82857 of 82968 positions complete (incomplete 2017-07-11T14:00 → 2026-09-23T19:00)
dew_point_temperature_2m
Metadata
| Field | Value |
|---|---|
| units | degree_Celsius |
| long_name | 2 metre dewpoint temperature |
| short_name | 2d |
| standard_name | dew_point_temperature |
| step_type | instant |
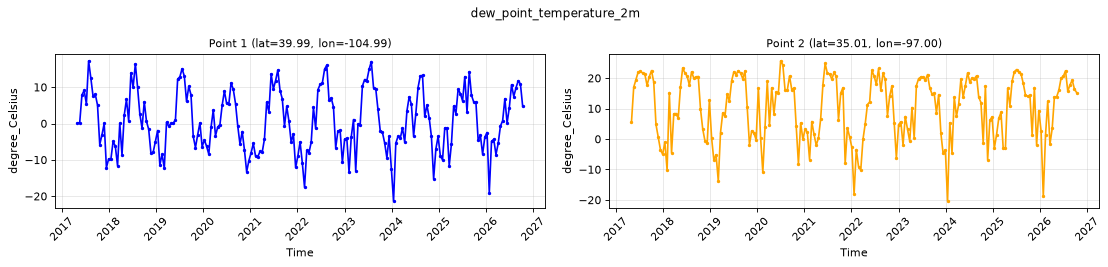
Point time series — 2017-05-02T00:00 - 2026-10-18T23:00, sampled lead=None
| Point | min | mean | max |
|---|---|---|---|
| P1 | -21.33 | 0.5902 | 17.24 |
| P2 | -20.35 | 10.18 | 25.66 |
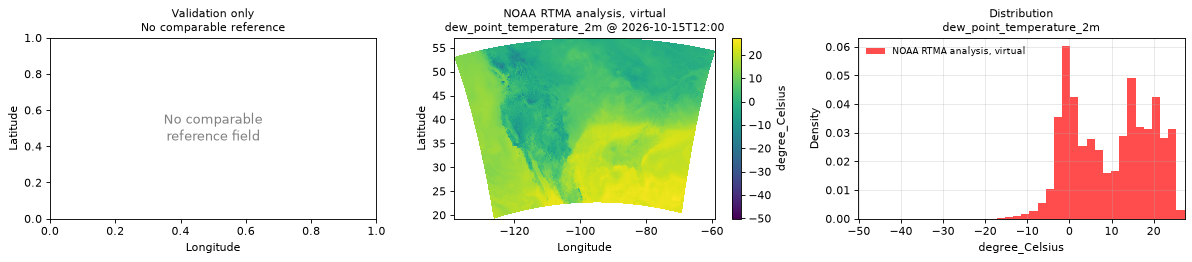
Spatial — 2026-10-15T12:00 (reference not available)
| Source | min | mean | max |
|---|---|---|---|
| Validation | -50.19 | 9.783 | 27.34 |
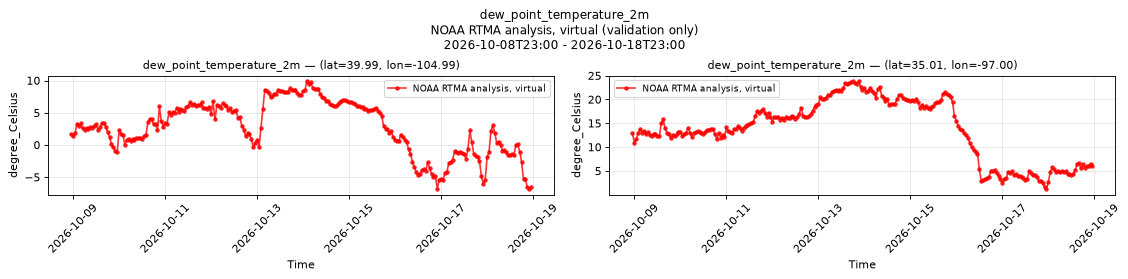
Temporal — 2026-10-08T23:00 - 2026-10-18T23:00
| Source | min | mean | max |
|---|---|---|---|
| P1 Validation | -6.87 | 2.684 | 9.93 |
| P2 Validation | 1.16 | 13.63 | 23.87 |
Availability — 82857 of 82968 positions complete (incomplete 2017-07-11T14:00 → 2026-09-23T19:00)
geopotential_height_surface
Metadata
| Field | Value |
|---|---|
| units | m |
| long_name | Geopotential height |
| short_name | gh |
| standard_name | geopotential_height |
| step_type | instant |
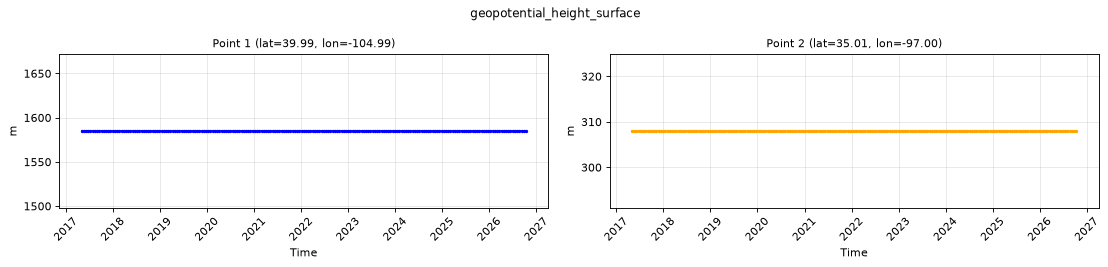
Point time series — 2017-05-02T00:00 - 2026-10-18T23:00, sampled lead=None
| Point | min | mean | max |
|---|---|---|---|
| P1 | 1585 | 1585 | 1585 |
| P2 | 308 | 308 | 308 |
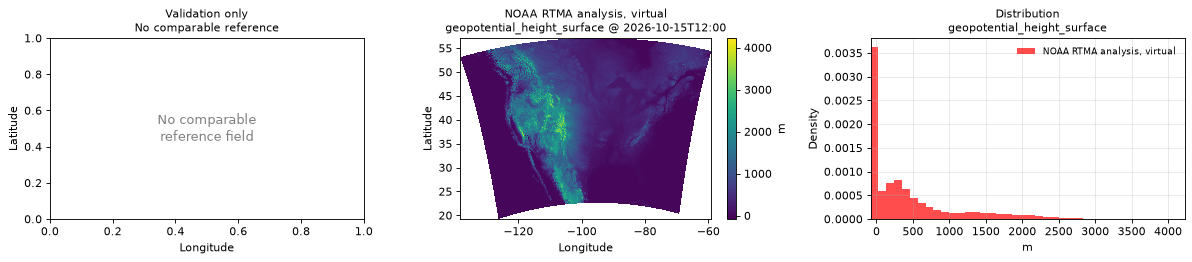
Spatial — 2026-10-15T12:00 (reference not available)
| Source | min | mean | max |
|---|---|---|---|
| Validation | -81 | 441.8 | 4226 |
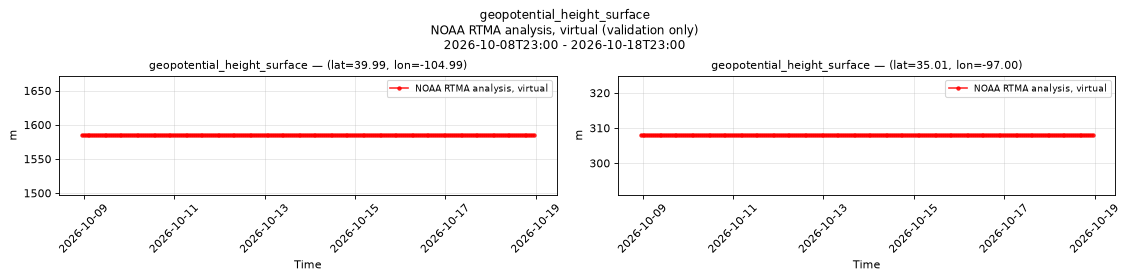
Temporal — 2026-10-08T23:00 - 2026-10-18T23:00
| Source | min | mean | max |
|---|---|---|---|
| P1 Validation | 1585 | 1585 | 1585 |
| P2 Validation | 308 | 308 | 308 |
Availability — 82857 of 82968 positions complete (incomplete 2017-07-11T14:00 → 2026-09-23T19:00)
pressure_surface
Metadata
| Field | Value |
|---|---|
| units | Pa |
| long_name | Surface pressure |
| short_name | sp |
| standard_name | surface_air_pressure |
| step_type | instant |
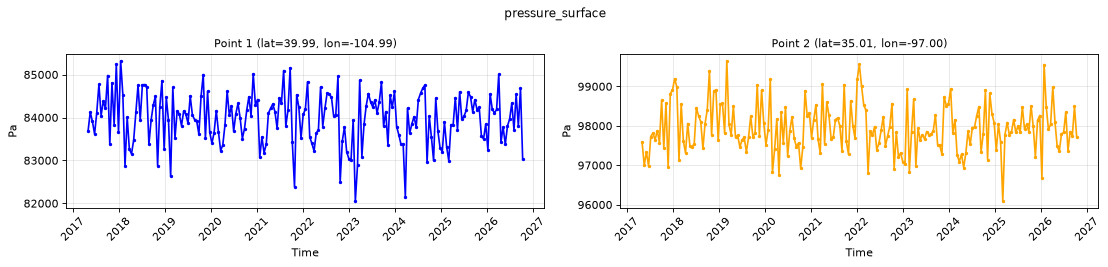
Point time series — 2017-05-02T00:00 - 2026-10-18T23:00, sampled lead=None
| Point | min | mean | max |
|---|---|---|---|
| P1 | 8.206e+04 | 8.397e+04 | 8.532e+04 |
| P2 | 9.609e+04 | 9.793e+04 | 9.965e+04 |
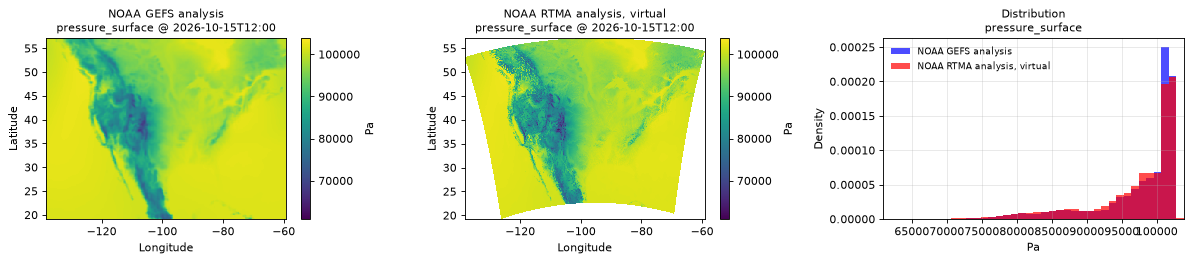
Spatial — 2026-10-15T12:00 (reference at 2026-10-15T12:00)
| Source | min | mean | max |
|---|---|---|---|
| Validation | 6.09e+04 | 9.699e+04 | 1.039e+05 |
| Reference | 6.797e+04 | 9.761e+04 | 1.028e+05 |
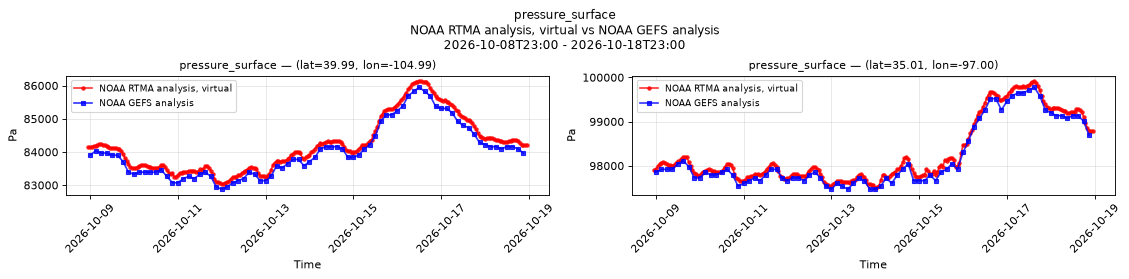
Temporal — 2026-10-08T23:00 - 2026-10-18T23:00
| Source | min | mean | max |
|---|---|---|---|
| P1 Validation | 8.303e+04 | 8.421e+04 | 8.614e+04 |
| P1 Reference | 8.288e+04 | 8.402e+04 | 8.595e+04 |
| P2 Validation | 9.75e+04 | 9.831e+04 | 9.992e+04 |
| P2 Reference | 9.747e+04 | 9.82e+04 | 9.978e+04 |
Availability — 82857 of 82968 positions complete (incomplete 2017-07-11T14:00 → 2026-09-23T19:00)
specific_humidity_2m
Metadata
| Field | Value |
|---|---|
| units | 1 |
| long_name | Specific humidity |
| short_name | q |
| standard_name | specific_humidity |
| step_type | instant |
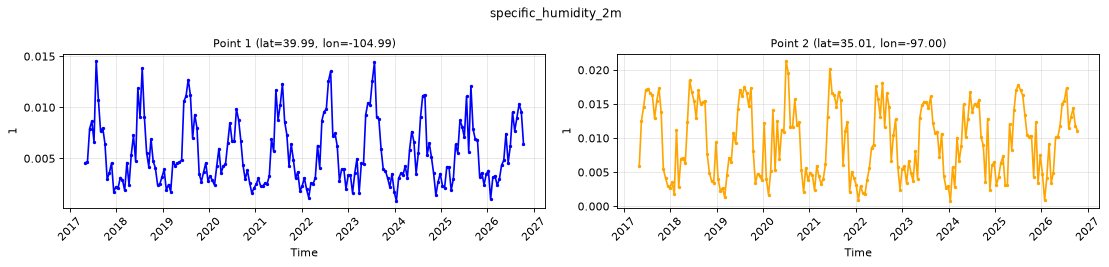
Point time series — 2017-05-02T00:00 - 2026-10-18T23:00, sampled lead=None
| Point | min | mean | max |
|---|---|---|---|
| P1 | 0.000832 | 0.005493 | 0.01455 |
| P2 | 0.000767 | 0.0095 | 0.02134 |
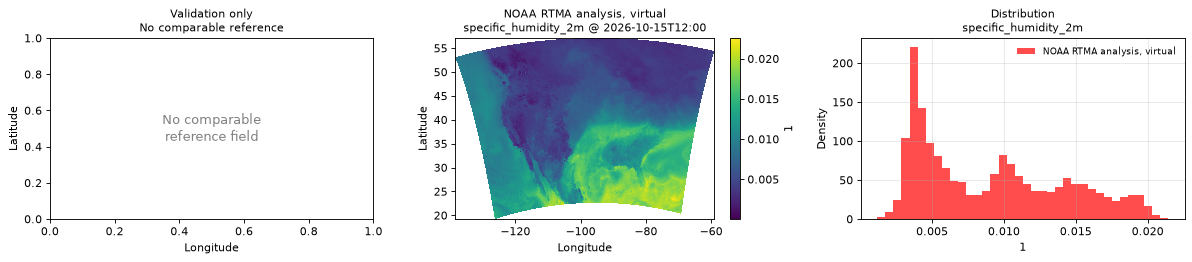
Spatial — 2026-10-15T12:00 (reference not available)
| Source | min | mean | max |
|---|---|---|---|
| Validation | 5.6e-05 | 0.009061 | 0.02257 |
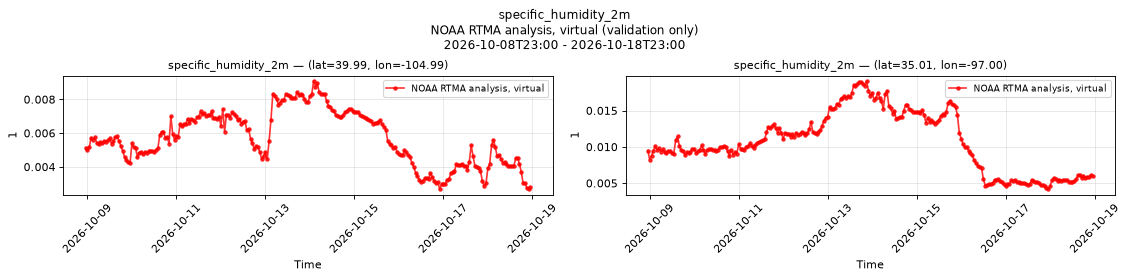
Temporal — 2026-10-08T23:00 - 2026-10-18T23:00
| Source | min | mean | max |
|---|---|---|---|
| P1 Validation | 0.002677 | 0.005702 | 0.009093 |
| P2 Validation | 0.004175 | 0.01068 | 0.01908 |
Availability — 82857 of 82968 positions complete (incomplete 2017-07-11T14:00 → 2026-09-23T19:00)
temperature_2m
Metadata
| Field | Value |
|---|---|
| units | degree_Celsius |
| long_name | 2 metre temperature |
| short_name | 2t |
| standard_name | air_temperature |
| step_type | instant |
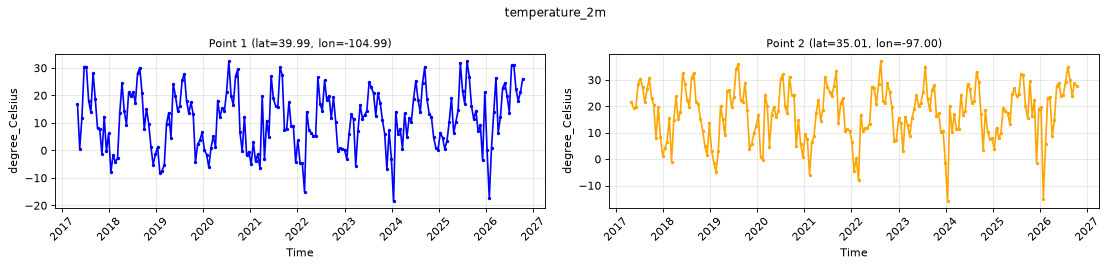
Point time series — 2017-05-02T00:00 - 2026-10-18T23:00, sampled lead=None
| Point | min | mean | max |
|---|---|---|---|
| P1 | -18.38 | 11.2 | 32.57 |
| P2 | -15.86 | 17.36 | 37.19 |
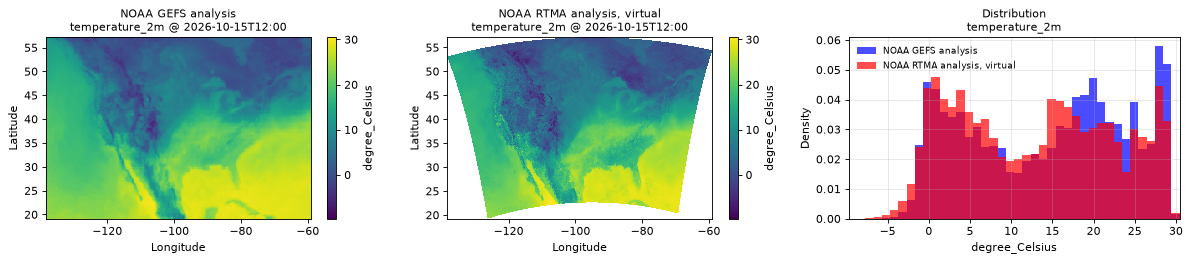
Spatial — 2026-10-15T12:00 (reference at 2026-10-15T12:00)
| Source | min | mean | max |
|---|---|---|---|
| Validation | -9.73 | 13.01 | 30.46 |
| Reference | -5.844 | 14.45 | 30 |
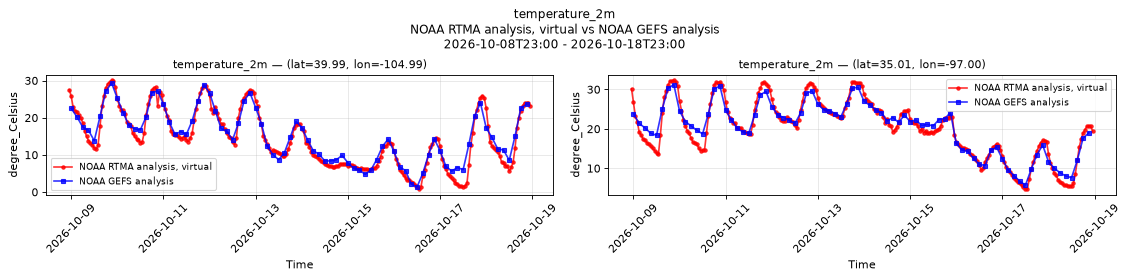
Temporal — 2026-10-08T23:00 - 2026-10-18T23:00
| Source | min | mean | max |
|---|---|---|---|
| P1 Validation | 0.79 | 14.6 | 30.09 |
| P1 Reference | 1.367 | 15.18 | 29.38 |
| P2 Validation | 4.74 | 20.24 | 32.32 |
| P2 Reference | 5.719 | 20.37 | 31.25 |
Availability — 82857 of 82968 positions complete (incomplete 2017-07-11T14:00 → 2026-09-23T19:00)
total_cloud_cover_atmosphere
Metadata
| Field | Value |
|---|---|
| units | percent |
| long_name | Total cloud cover |
| short_name | tcc |
| standard_name | cloud_area_fraction |
| step_type | instant |
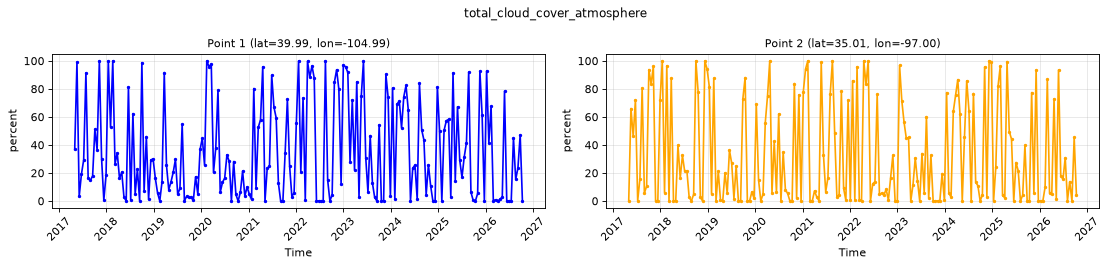
Point time series — 2017-05-02T00:00 - 2026-10-18T23:00, sampled lead=None
| Point | min | mean | max |
|---|---|---|---|
| P1 | 0 | 35.28 | 100 |
| P2 | 0 | 32.95 | 100 |
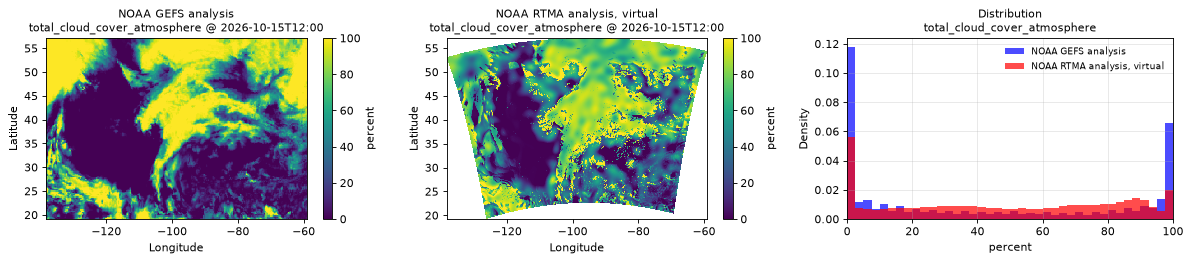
Spatial — 2026-10-15T12:00 (reference at 2026-10-15T12:00)
| Source | min | mean | max |
|---|---|---|---|
| Validation | 0 | 48.31 | 100 |
| Reference | 0 | 42.08 | 100 |
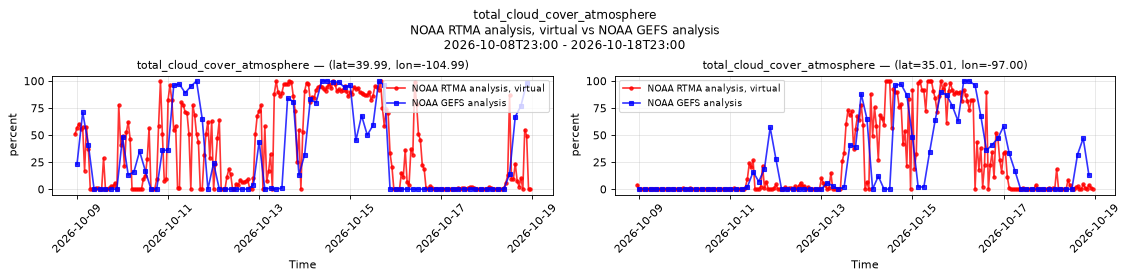
Temporal — 2026-10-08T23:00 - 2026-10-18T23:00
| Source | min | mean | max |
|---|---|---|---|
| P1 Validation | 0 | 37.42 | 100 |
| P1 Reference | 0 | 32.34 | 100 |
| P2 Validation | 0 | 23.72 | 100 |
| P2 Reference | 0 | 22.75 | 100 |
Availability — 82857 of 82968 positions complete (incomplete 2017-07-11T14:00 → 2026-09-23T19:00)
visibility_surface
Metadata
| Field | Value |
|---|---|
| units | m |
| long_name | Visibility |
| short_name | vis |
| standard_name | visibility_in_air |
| step_type | instant |
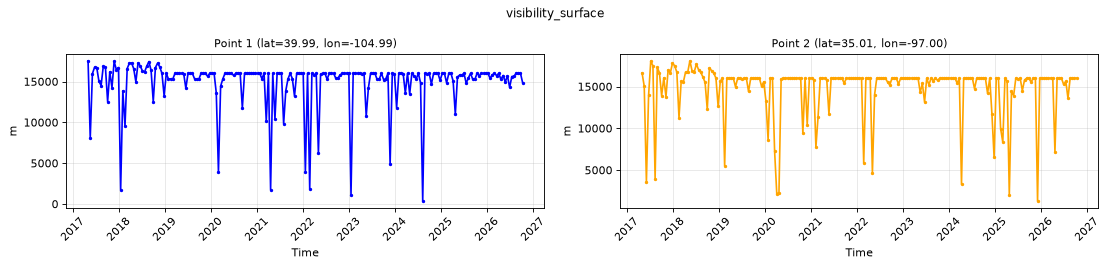
Point time series — 2017-05-02T00:00 - 2026-10-18T23:00, sampled lead=None
| Point | min | mean | max |
|---|---|---|---|
| P1 | 360 | 1.493e+04 | 1.753e+04 |
| P2 | 1290 | 1.482e+04 | 1.807e+04 |
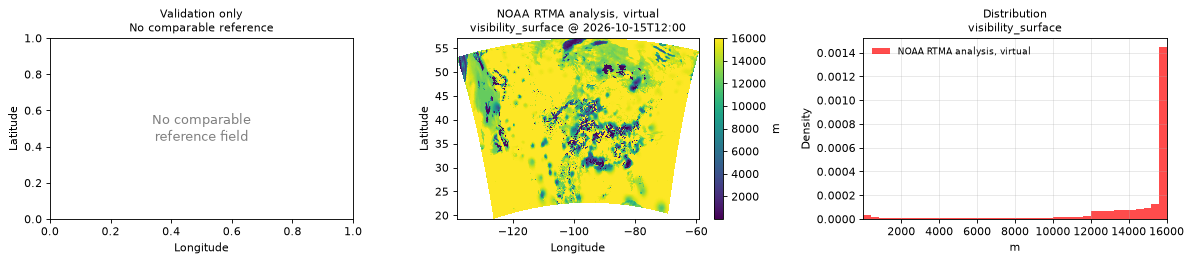
Spatial — 2026-10-15T12:00 (reference not available)
| Source | min | mean | max |
|---|---|---|---|
| Validation | 1 | 1.419e+04 | 1.6e+04 |
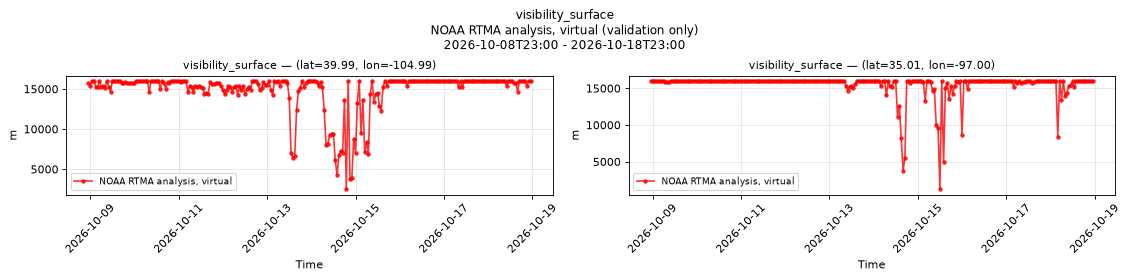
Temporal — 2026-10-08T23:00 - 2026-10-18T23:00
| Source | min | mean | max |
|---|---|---|---|
| P1 Validation | 2510 | 1.479e+04 | 1.6e+04 |
| P2 Validation | 1256 | 1.548e+04 | 1.6e+04 |
Availability — 82857 of 82968 positions complete (incomplete 2017-07-11T14:00 → 2026-09-23T19:00)
wind_direction_10m
Metadata
| Field | Value |
|---|---|
| units | degree |
| long_name | 10 metre wind direction |
| short_name | 10wdir |
| standard_name | wind_from_direction |
| step_type | instant |
| comment | Direction the wind blows from, clockwise from true north. |
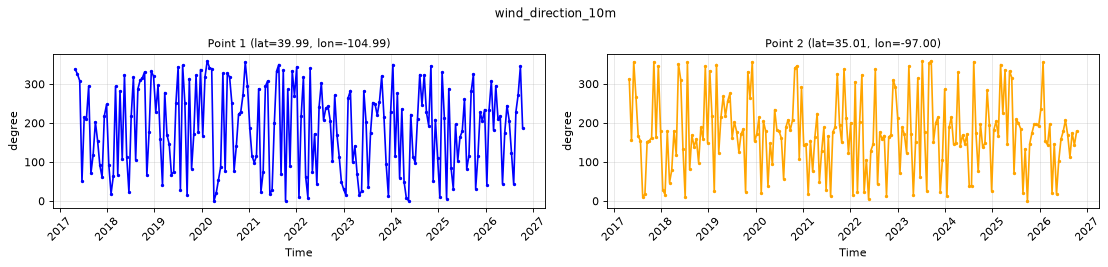
Point time series — 2017-05-02T00:00 - 2026-10-18T23:00, sampled lead=None
| Point | min | mean | max |
|---|---|---|---|
| P1 | 0 | 186.2 | 359.5 |
| P2 | 0 | 174.3 | 358.9 |
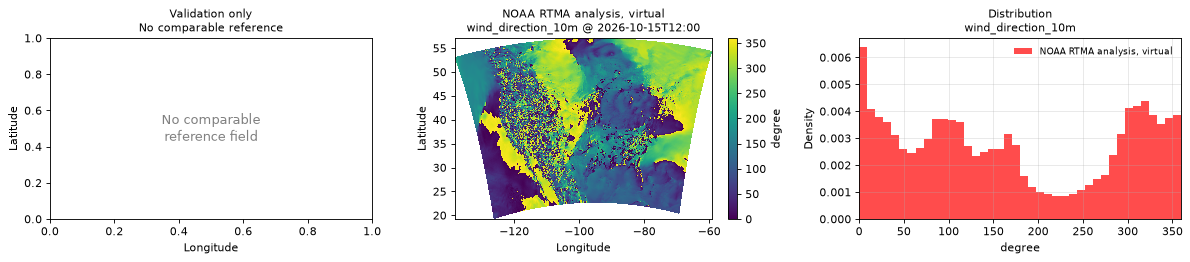
Spatial — 2026-10-15T12:00 (reference not available)
| Source | min | mean | max |
|---|---|---|---|
| Validation | 0 | 170.6 | 360 |
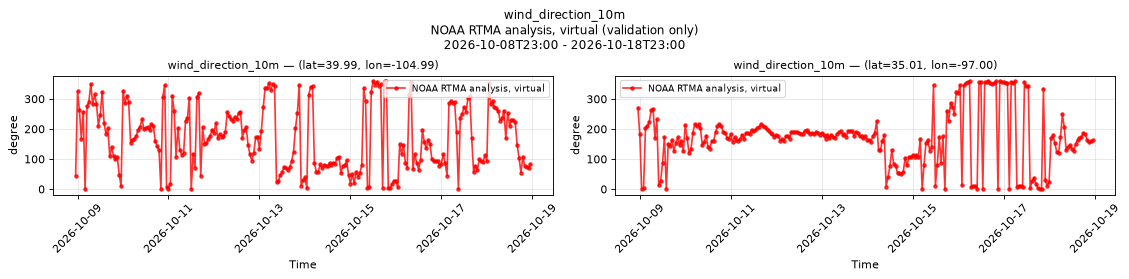
Temporal — 2026-10-08T23:00 - 2026-10-18T23:00
| Source | min | mean | max |
|---|---|---|---|
| P1 Validation | 0 | 167.7 | 359.7 |
| P2 Validation | 0 | 170.5 | 360 |
Availability — 82857 of 82968 positions complete (incomplete 2017-07-11T14:00 → 2026-09-23T19:00)
wind_gust_10m
Metadata
| Field | Value |
|---|---|
| units | m s-1 |
| long_name | Wind speed (gust) |
| short_name | gust |
| standard_name | wind_speed_of_gust |
| step_type | instant |
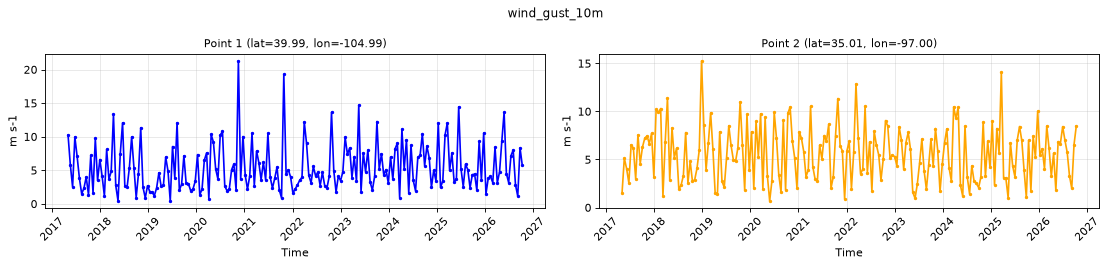
Point time series — 2017-05-02T00:00 - 2026-10-18T23:00, sampled lead=None
| Point | min | mean | max |
|---|---|---|---|
| P1 | 0.42 | 5.399 | 21.29 |
| P2 | 0.68 | 5.584 | 15.26 |
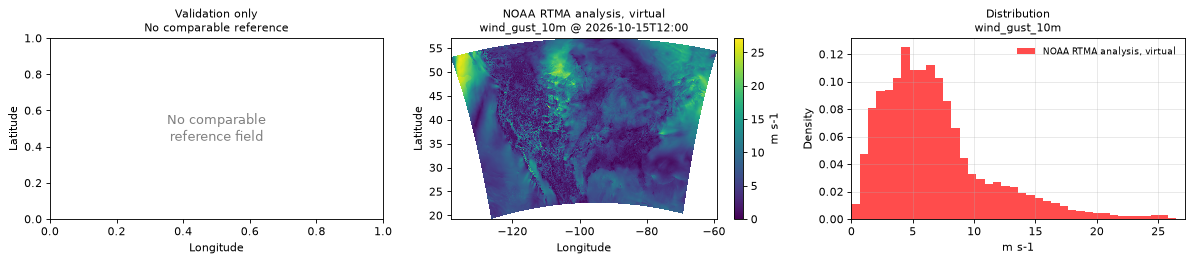
Spatial — 2026-10-15T12:00 (reference not available)
| Source | min | mean | max |
|---|---|---|---|
| Validation | 0 | 6.768 | 27.15 |
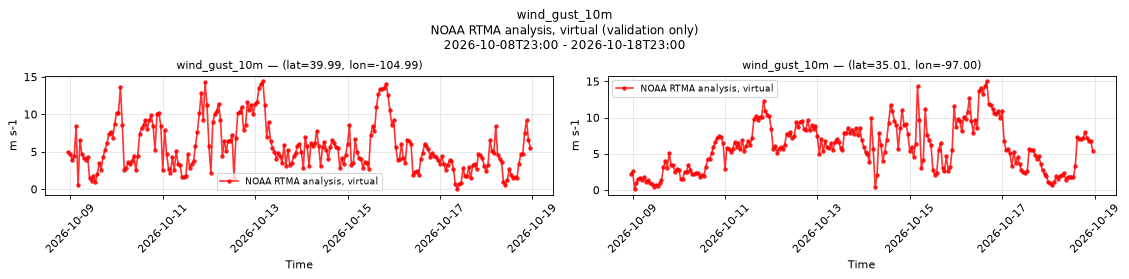
Temporal — 2026-10-08T23:00 - 2026-10-18T23:00
| Source | min | mean | max |
|---|---|---|---|
| P1 Validation | 0 | 5.636 | 14.45 |
| P2 Validation | 0.12 | 5.953 | 15.05 |
Availability — 82857 of 82968 positions complete (incomplete 2017-07-11T14:00 → 2026-09-23T19:00)
wind_speed_10m
Metadata
| Field | Value |
|---|---|
| units | m s-1 |
| long_name | 10 metre wind speed |
| short_name | 10si |
| standard_name | wind_speed |
| step_type | instant |
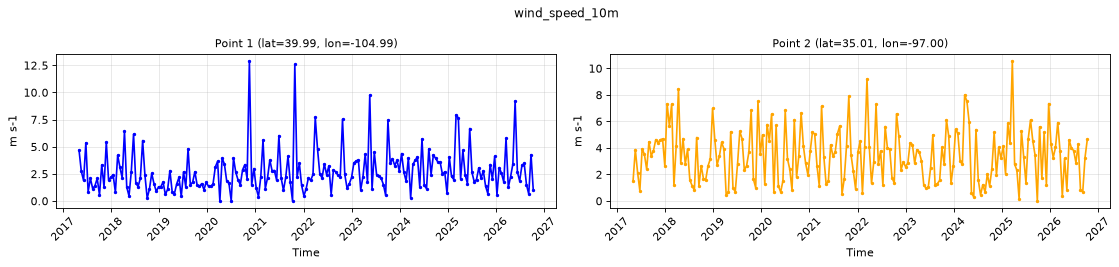
Point time series — 2017-05-02T00:00 - 2026-10-18T23:00, sampled lead=None
| Point | min | mean | max |
|---|---|---|---|
| P1 | 0 | 2.727 | 12.91 |
| P2 | 0 | 3.44 | 10.57 |
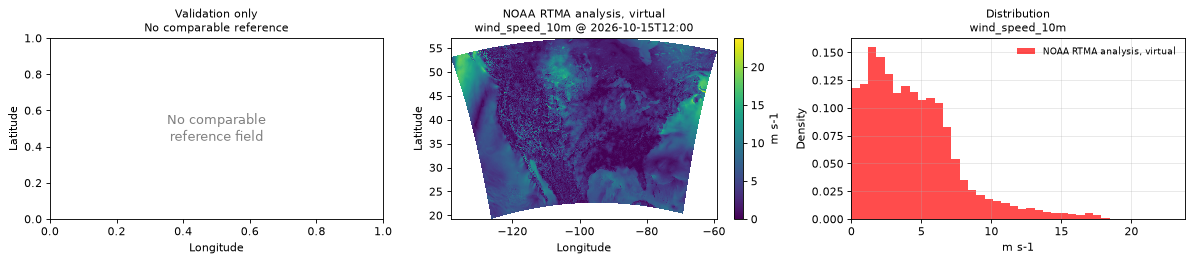
Spatial — 2026-10-15T12:00 (reference not available)
| Source | min | mean | max |
|---|---|---|---|
| Validation | 0 | 4.382 | 23.8 |
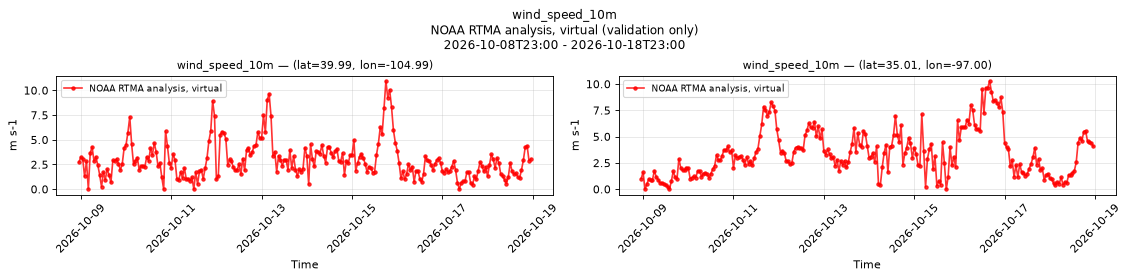
Temporal — 2026-10-08T23:00 - 2026-10-18T23:00
| Source | min | mean | max |
|---|---|---|---|
| P1 Validation | 0 | 2.929 | 10.95 |
| P2 Validation | 0 | 3.414 | 10.29 |
Availability — 82857 of 82968 positions complete (incomplete 2017-07-11T14:00 → 2026-09-23T19:00)
wind_u_10m
Metadata
| Field | Value |
|---|---|
| units | m s-1 |
| long_name | 10 metre U wind component |
| short_name | 10u |
| standard_name | x_wind |
| step_type | instant |
| comment | Velocity along the model grid's x dimension, not eastward velocity. |
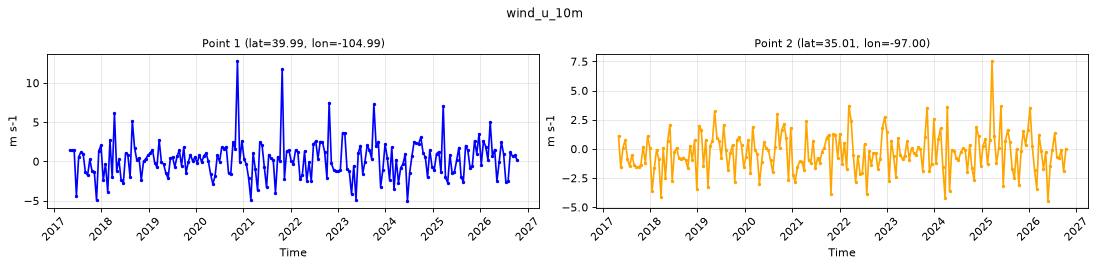
Point time series — 2017-05-02T00:00 - 2026-10-18T23:00, sampled lead=None
| Point | min | mean | max |
|---|---|---|---|
| P1 | -5.04 | 0.249 | 12.81 |
| P2 | -4.47 | -0.3268 | 7.55 |
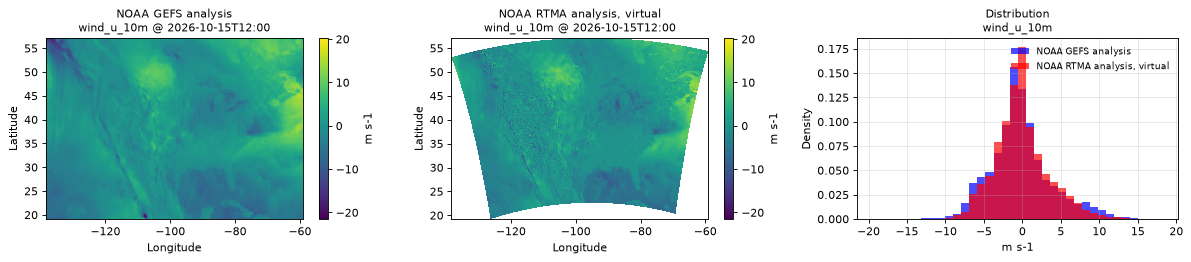
Spatial — 2026-10-15T12:00 (reference at 2026-10-15T12:00)
| Source | min | mean | max |
|---|---|---|---|
| Validation | -17.63 | -0.1206 | 20.24 |
| Reference | -21.5 | -0.1977 | 15.38 |
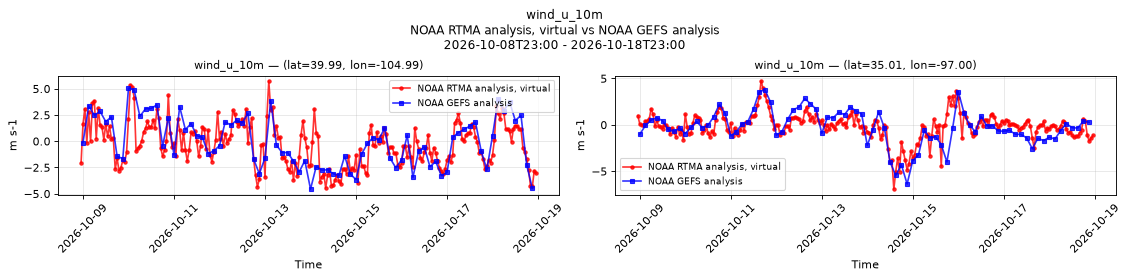
Temporal — 2026-10-08T23:00 - 2026-10-18T23:00
| Source | min | mean | max |
|---|---|---|---|
| P1 Validation | -4.45 | -0.3093 | 5.74 |
| P1 Reference | -4.562 | -0.02473 | 5.062 |
| P2 Validation | -6.93 | -0.1769 | 4.73 |
| P2 Reference | -6.375 | -0.2388 | 3.781 |
Availability — 82857 of 82968 positions complete (incomplete 2017-07-11T14:00 → 2026-09-23T19:00)
wind_v_10m
Metadata
| Field | Value |
|---|---|
| units | m s-1 |
| long_name | 10 metre V wind component |
| short_name | 10v |
| standard_name | y_wind |
| step_type | instant |
| comment | Velocity along the model grid's y dimension, not northward velocity. |
Point time series — 2017-05-02T00:00 - 2026-10-18T23:00, sampled lead=None
| Point | min | mean | max |
|---|---|---|---|
| P1 | -8.46 | -0.4972 | 9.2 |
| P2 | -7.52 | 1.006 | 8.47 |
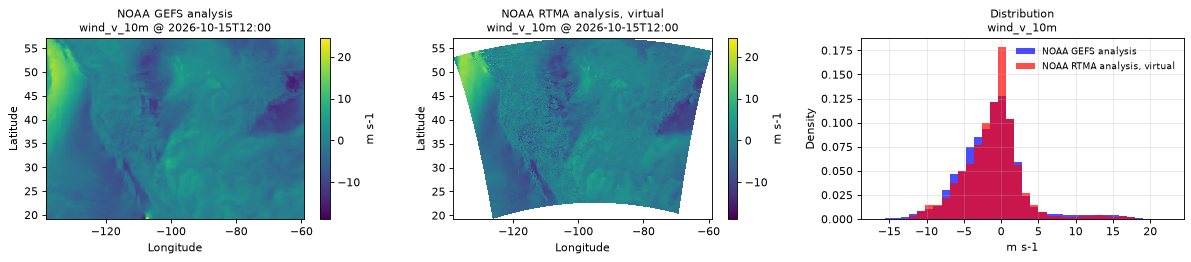
Spatial — 2026-10-15T12:00 (reference at 2026-10-15T12:00)
| Source | min | mean | max |
|---|---|---|---|
| Validation | -18.84 | -1.108 | 20.92 |
| Reference | -15.75 | -1.192 | 24.5 |
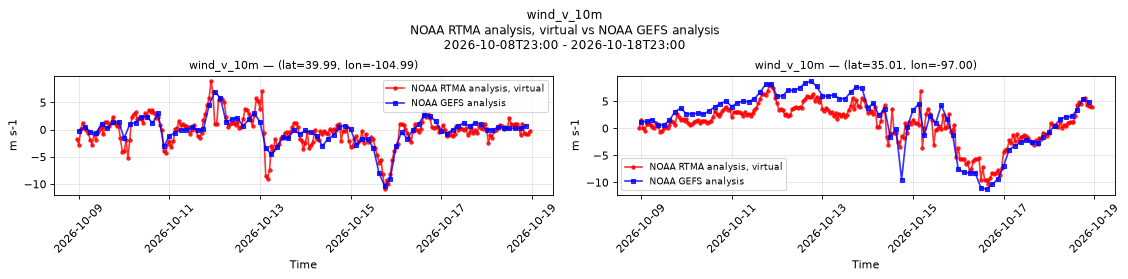
Temporal — 2026-10-08T23:00 - 2026-10-18T23:00
| Source | min | mean | max |
|---|---|---|---|
| P1 Validation | -10.93 | -0.2384 | 8.94 |
| P1 Reference | -10.38 | -0.1407 | 6.938 |
| P2 Validation | -10.29 | 0.859 | 8.04 |
| P2 Reference | -11.25 | 1.688 | 8.75 |
Availability — 82857 of 82968 positions complete (incomplete 2017-07-11T14:00 → 2026-09-23T19:00)