ECMWF IFS ENS forecast, 46 day, 6 hourly, 1.5 degree validation report
This dataset validation report plots a sample of values from the ECMWF IFS ENS forecast, 46 day, 6 hourly, 1.5 degree dataset over time and across space, comparing where possible to a previously validated reference dataset. It also reports the quantity of unavailable values and their associated timestamps. These analyses are one layer of a multi-layered dataset validation process we perform at dynamical.org and also provide users a preview of the dataset contents.
Report generation start time: 2026-09-17T16:54:03 UTC
Summary
This dataset has been reviewed and is ready for use.
What looks good
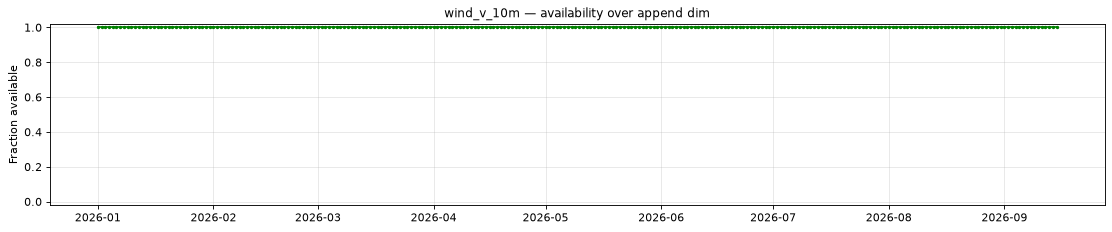
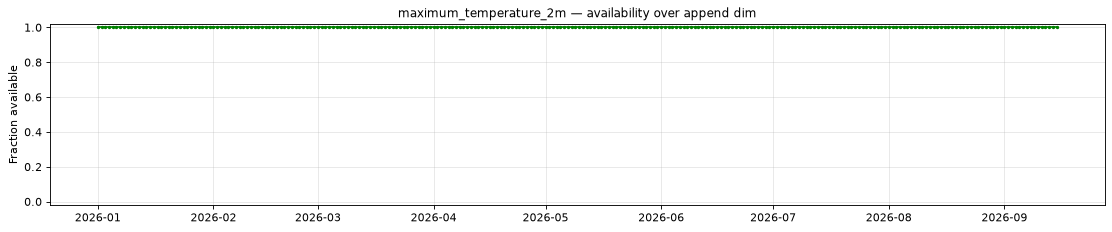
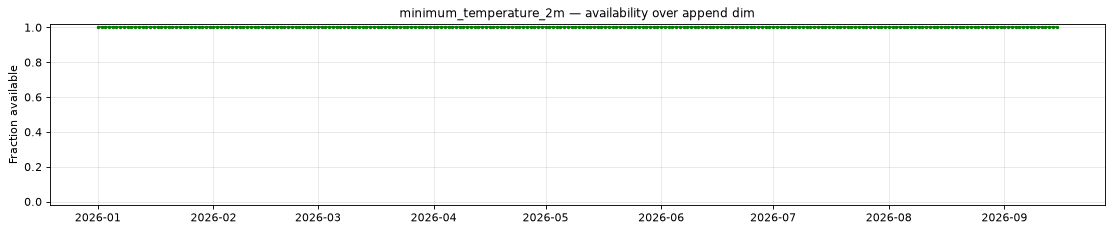
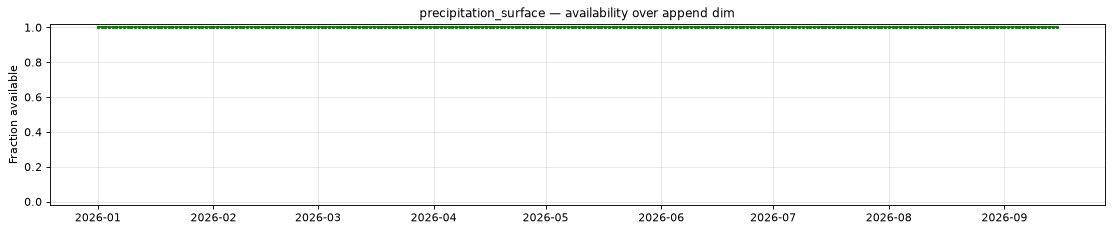
- Every initialization from 2026-01-01 through 2026-09-15 is complete for all five variables (heatmap).
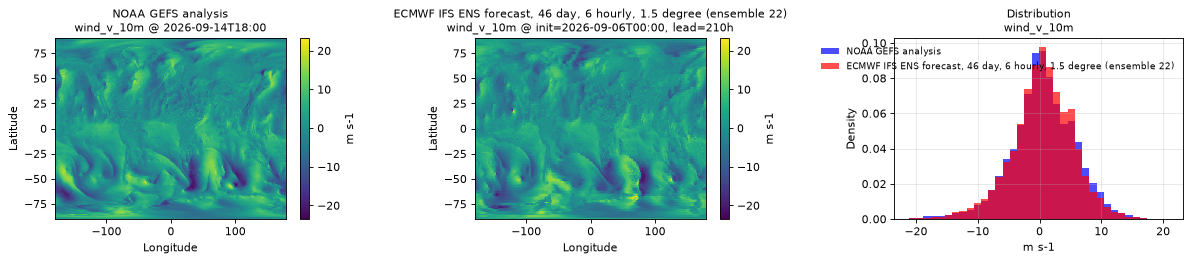
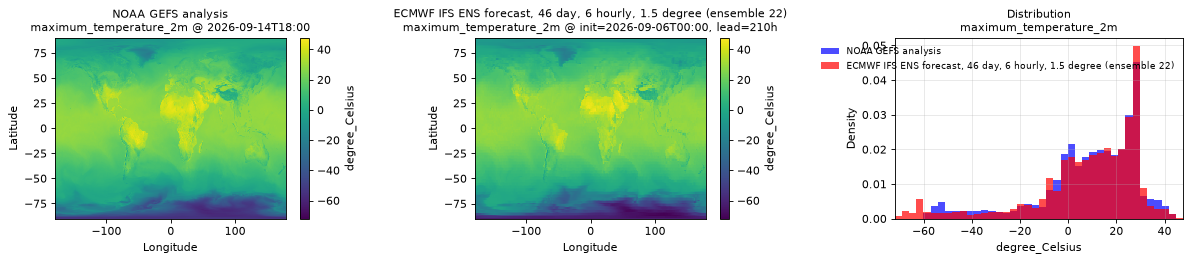
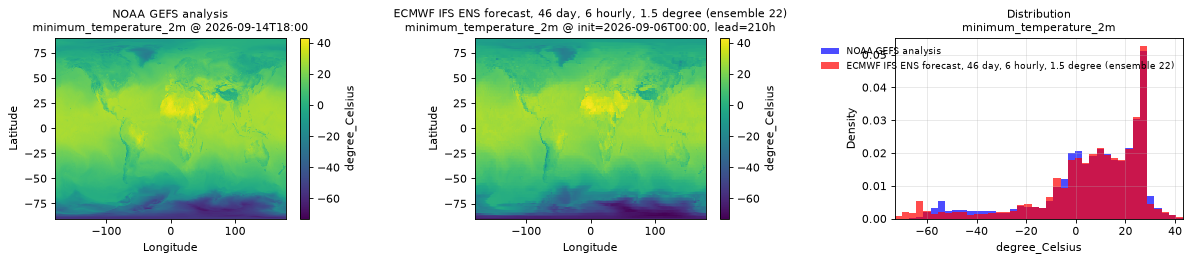
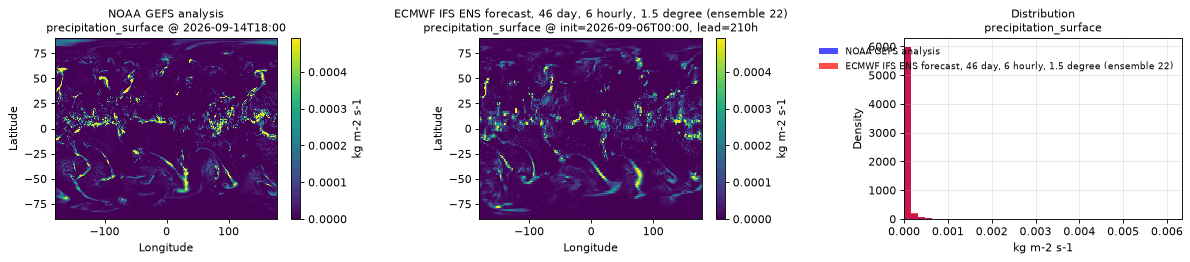
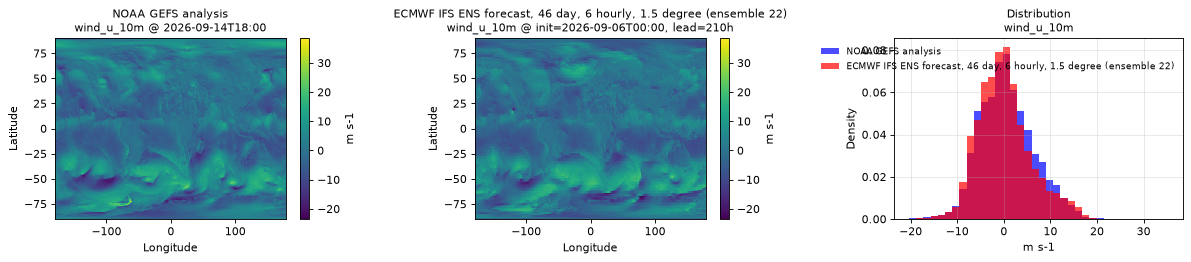
- Maps align with the reference with no flips, offsets, or scale mismatches, and value histograms overlap the NOAA GEFS analysis for all five variables (spatial_maximum_temperature_2m.png, spatial_precipitation_surface.png, spatial_wind_u_10m.png).
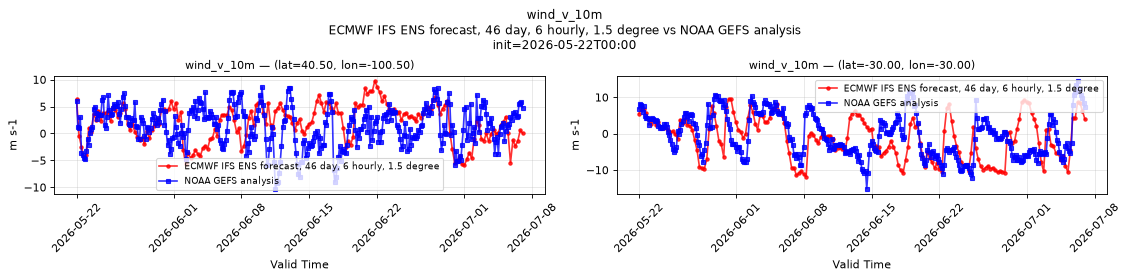
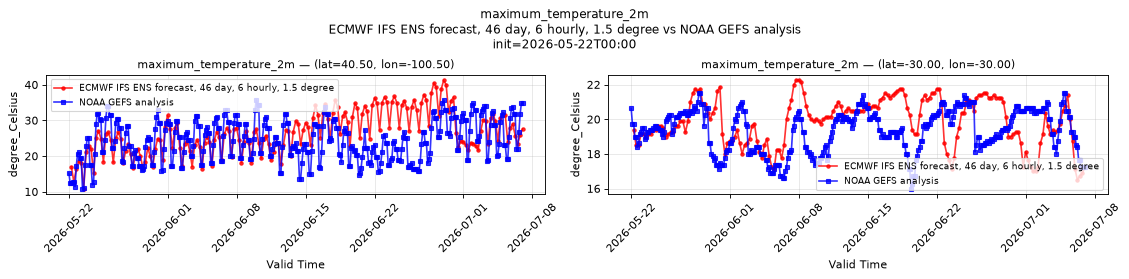
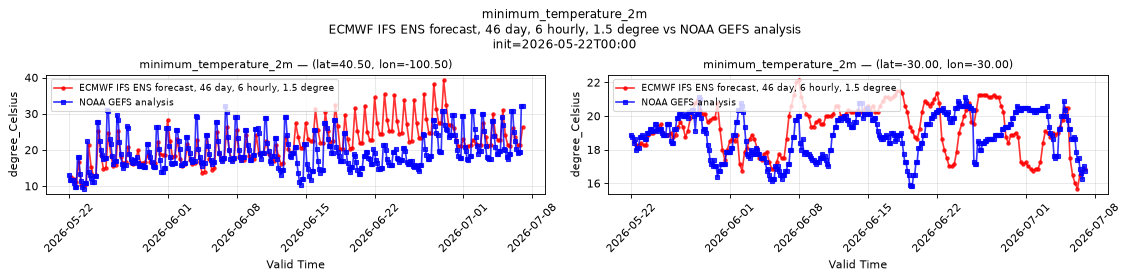
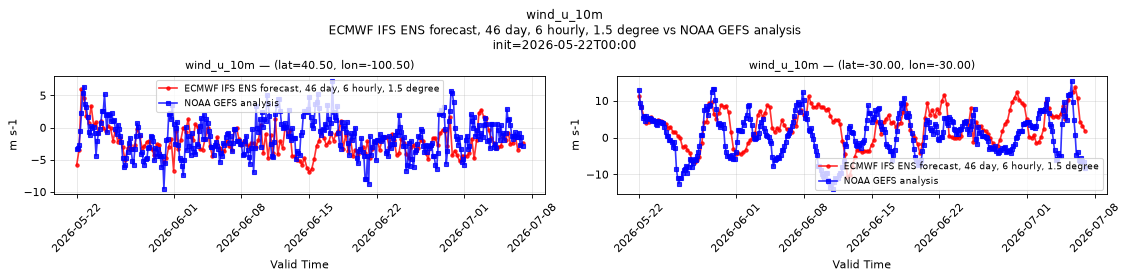
- Forecasts track the reference at short leads and diverge with lead time as a forecast should, with the diurnal cycle in phase (temporal_minimum_temperature_2m.png).
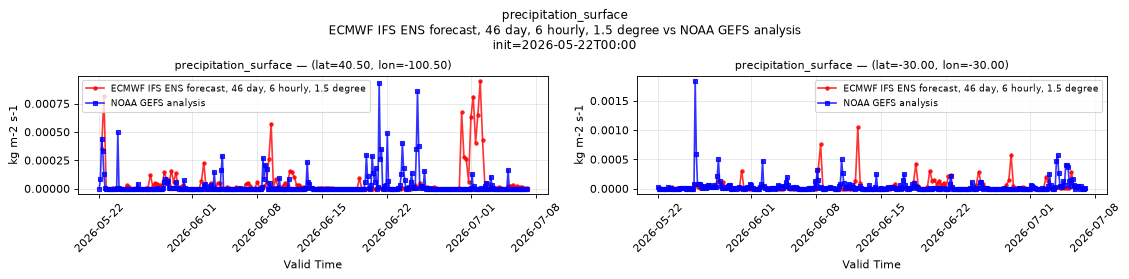
- Deaccumulated precipitation rates match the reference's magnitude and stay physically plausible at long leads (temporal_precipitation_surface.png); pinned values were also recomputed by hand from the raw archive messages.
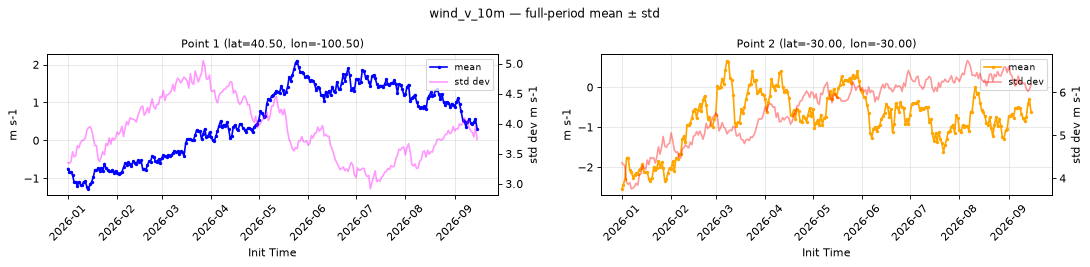
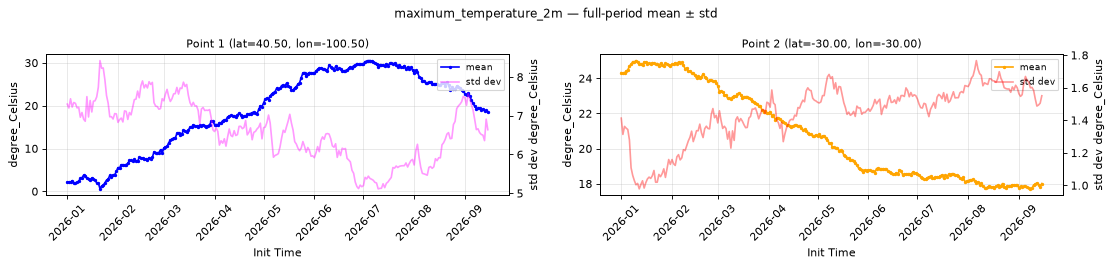
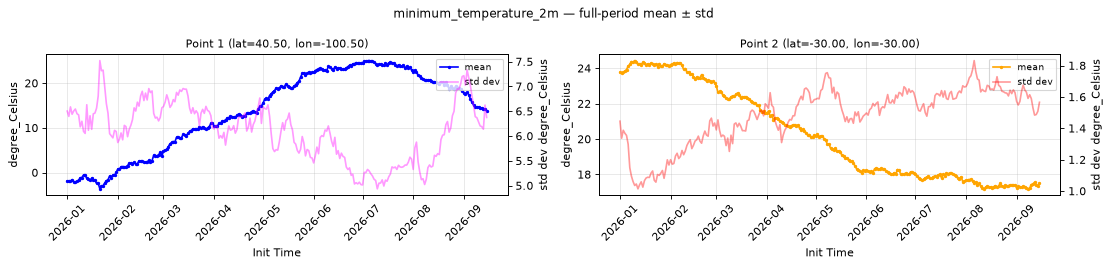
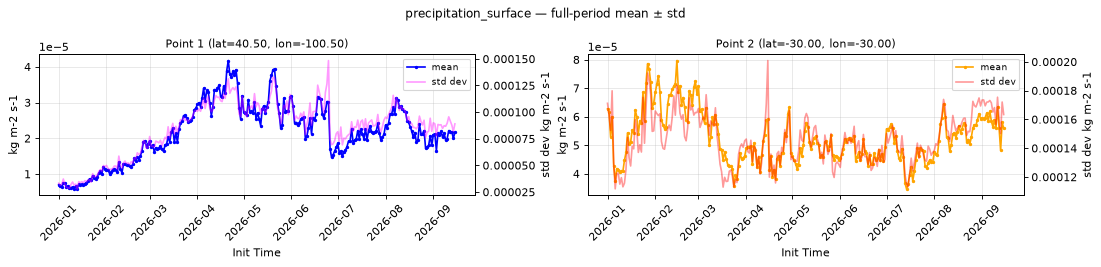
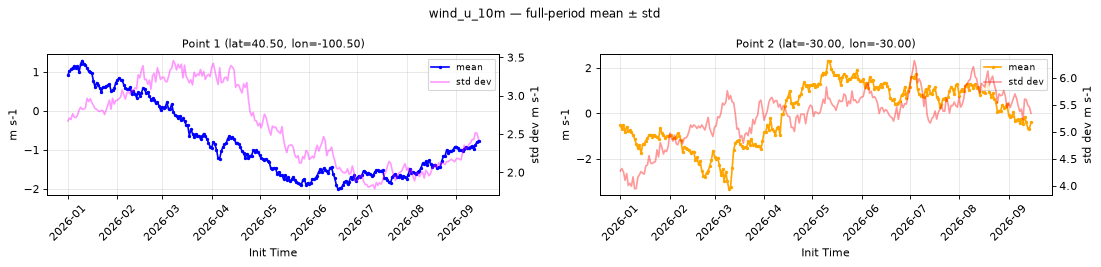
- Full-period point series show smooth seasonal cycles with no steps or drifts at both points (value_timeseries_maximum_temperature_2m.png).
- Lead-zero NaN is confined to the variables that define it that way: precipitation rate and the 6-hour temperature extremes have no lead-zero value; winds are instantaneous and do.
- The colder Antarctic winter floor than the reference is inherent to the IFS model: the published daily product from the same source shows the same floor at the same init and lead.
Datasets
| Role | Name | ID | Version | URL |
|---|---|---|---|---|
| Validation | ECMWF IFS ENS forecast, 46 day, 6 hourly, 1.5 degree | ecmwf-ifs-ens-forecast-46-day-6-hourly-1-5-degree |
v0.1.0 |
s3://dynamical-ecmwf-ifs-ens/ecmwf-ifs-ens-forecast-46-day-6-hourly-1-5-degree/v0.1.0.icechunk |
| Reference | NOAA GEFS analysis | noaa-gefs-analysis |
0.1.2 |
s3://dynamical-noaa-gefs/noaa-gefs-analysis/v0.1.2.icechunk/ |
Run parameters
| Parameter | Value |
|---|---|
| Validation dataset type | forecast |
| Validation time range | init_time 2026-01-01T00:00 → 2026-09-15T00:00 |
| Reference time range | time 2000-01-01T00:00 → 2026-09-17T12:00 |
| Point 1 | lat=40.5000, lon=-100.5000 |
| Point 2 | lat=-30.0000, lon=-30.0000 |
| Ensemble member | 22 |
| Spatial comparison time | init=2026-09-06T00:00, lead=210h (reference at 2026-09-14T18:00) |
| Timeseries period | init=2026-05-22T00:00 |
Availability
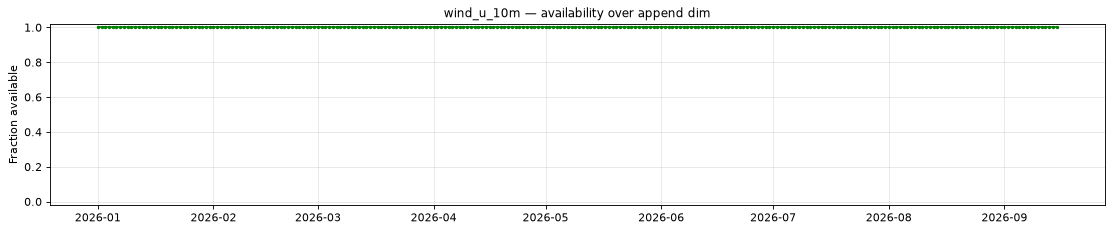
The plot below shows the availability of each variable over time — light red marks unavailable data, dark green marks present data.
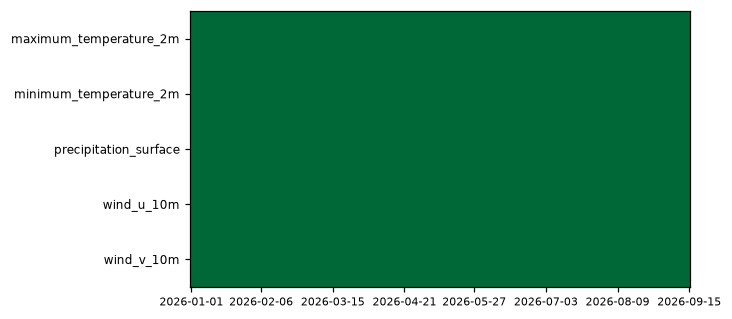
Every variable is complete at every scanned position.
Per-variable details
maximum_temperature_2m
Metadata
| Field | Value |
|---|---|
| units | degree_Celsius |
| long_name | Maximum temperature |
| short_name | tmax |
| standard_name | air_temperature |
| step_type | max |
| comment | Maximum temperature at 2 metres over the previous 6 hours. |
Point time series — 2026-01-01T00:00 - 2026-09-15T00:00
| Point | min | mean | std | max |
|---|---|---|---|---|
| P1 | 0.5883 | 18.91 | 6.599 | 30.53 |
| P2 | 17.71 | 20.79 | 1.443 | 25.01 |
Spatial — init=2026-09-06T00:00, lead=210h (reference at 2026-09-14T18:00)
| Source | min | mean | max |
|---|---|---|---|
| Validation | -72 | 7.827 | 45.75 |
| Reference | -60.5 | 8.805 | 47.75 |
Temporal — init=2026-05-22T00:00
| Source | min | mean | max |
|---|---|---|---|
| P1 Validation | 10.88 | 26.52 | 41.25 |
| P1 Reference | 10.88 | 24.3 | 35.75 |
| P2 Validation | 16.5 | 19.86 | 22.25 |
| P2 Reference | 16 | 19.35 | 21.5 |
Availability — 258 of 258 positions complete; nulls P1 0/4794672, P2 0/4794672
minimum_temperature_2m
Metadata
| Field | Value |
|---|---|
| units | degree_Celsius |
| long_name | Minimum temperature |
| short_name | tmin |
| standard_name | air_temperature |
| step_type | min |
| comment | Minimum temperature at 2 metres over the previous 6 hours. |
Point time series — 2026-01-01T00:00 - 2026-09-15T00:00
| Point | min | mean | std | max |
|---|---|---|---|---|
| P1 | -3.66 | 13.84 | 6.095 | 25.04 |
| P2 | 17.18 | 20.23 | 1.479 | 24.43 |
Spatial — init=2026-09-06T00:00, lead=210h (reference at 2026-09-14T18:00)
| Source | min | mean | max |
|---|---|---|---|
| Validation | -73 | 6.086 | 43.25 |
| Reference | -67 | 6.752 | 41.75 |
Temporal — init=2026-05-22T00:00
| Source | min | mean | max |
|---|---|---|---|
| P1 Validation | 10 | 21.86 | 39.25 |
| P1 Reference | 9.312 | 19.56 | 32.25 |
| P2 Validation | 15.69 | 19.3 | 22.12 |
| P2 Reference | 15.81 | 18.88 | 21.12 |
Availability — 258 of 258 positions complete; nulls P1 0/4794672, P2 0/4794672
precipitation_surface
Metadata
| Field | Value |
|---|---|
| units | kg m-2 s-1 |
| long_name | Precipitation rate |
| short_name | prate |
| standard_name | precipitation_flux |
| step_type | avg |
| comment | Average precipitation rate over the previous 6 hours. Units equivalent to mm/s. |
Point time series — 2026-01-01T00:00 - 2026-09-15T00:00
| Point | min | mean | std | max |
|---|---|---|---|---|
| P1 | 5.856e-06 | 2.165e-05 | 8.433e-05 | 4.174e-05 |
| P2 | 3.467e-05 | 5.251e-05 | 0.0001462 | 7.968e-05 |
Spatial — init=2026-09-06T00:00, lead=210h (reference at 2026-09-14T18:00)
| Source | min | mean | max |
|---|---|---|---|
| Validation | 0 | 3.043e-05 | 0.004059 |
| Reference | 0 | 3.054e-05 | 0.006348 |
Temporal — init=2026-05-22T00:00
| Source | min | mean | max |
|---|---|---|---|
| P1 Validation | 0 | 5.538e-05 | 0.0009499 |
| P1 Reference | 0 | 2.927e-05 | 0.0009346 |
| P2 Validation | 0 | 4.461e-05 | 0.001045 |
| P2 Reference | 0 | 3.919e-05 | 0.001839 |
Availability — 258 of 258 positions complete; nulls P1 0/4794672, P2 0/4794672
wind_u_10m
Metadata
| Field | Value |
|---|---|
| units | m s-1 |
| long_name | 10 metre U wind component |
| short_name | 10u |
| standard_name | eastward_wind |
| step_type | instant |
Point time series — 2026-01-01T00:00 - 2026-09-15T00:00
| Point | min | mean | std | max |
|---|---|---|---|---|
| P1 | -2.001 | -0.8038 | 2.595 | 1.292 |
| P2 | -3.324 | 0.005234 | 5.315 | 2.32 |
Spatial — init=2026-09-06T00:00, lead=210h (reference at 2026-09-14T18:00)
| Source | min | mean | max |
|---|---|---|---|
| Validation | -23 | 0.1363 | 23.75 |
| Reference | -23.5 | 0.6479 | 38.5 |
Temporal — init=2026-05-22T00:00
| Source | min | mean | max |
|---|---|---|---|
| P1 Validation | -6.938 | -2.266 | 5.938 |
| P1 Reference | -9.5 | -1.372 | 7.25 |
| P2 Validation | -10.62 | 3.299 | 13.62 |
| P2 Reference | -13.88 | 0.5769 | 15.38 |
Availability — 258 of 258 positions complete; nulls P1 0/4820730, P2 0/4820730
wind_v_10m
Metadata
| Field | Value |
|---|---|
| units | m s-1 |
| long_name | 10 metre V wind component |
| short_name | 10v |
| standard_name | northward_wind |
| step_type | instant |
Point time series — 2026-01-01T00:00 - 2026-09-15T00:00
| Point | min | mean | std | max |
|---|---|---|---|---|
| P1 | -1.276 | 0.5215 | 3.902 | 2.104 |
| P2 | -2.544 | -0.7716 | 5.631 | 0.6674 |
Spatial — init=2026-09-06T00:00, lead=210h (reference at 2026-09-14T18:00)
| Source | min | mean | max |
|---|---|---|---|
| Validation | -21.5 | 0.4464 | 23 |
| Reference | -23.5 | 0.5464 | 23.25 |
Temporal — init=2026-05-22T00:00
| Source | min | mean | max |
|---|---|---|---|
| P1 Validation | -5.938 | 1.961 | 9.75 |
| P1 Reference | -10.25 | 1.307 | 8.625 |
| P2 Validation | -11.88 | -1.191 | 9.5 |
| P2 Reference | -15.12 | -0.2887 | 14.5 |
Availability — 258 of 258 positions complete; nulls P1 0/4820730, P2 0/4820730