ECMWF AIFS ENS forecast, virtual validation report
This dataset validation report plots a sample of values from the ECMWF AIFS ENS forecast, virtual dataset over time and across space, comparing where possible to a previously validated reference dataset. It also reports the quantity of unavailable values and their associated timestamps. These analyses are one layer of a multi-layered dataset validation process we perform at dynamical.org and also provide users a preview of the dataset contents.
Report generation start time: 2026-11-13T04:53:58 UTC
Summary
This dataset has been reviewed and is ready for use.
What looks good
- Every expected source file is present, and every variable is present at every initialization in its coverage period.
- Values match the source and the ECMWF AIFS ENS forecast dataset, allowing for rounding and conversion of accumulated totals to rates.
- Maps, coordinates and units are correct.
Review notes
Variable coverage
- Some variables cover only part of the archive, matching when ECMWF open data started publishing them. Initializations outside a variable's range hold NaN.
- From 2026-05-12T06:
convective_precipitation_run_total_surface,snow_area_fraction_surface,volumetric_soil_moisture_layer_1,volumetric_soil_moisture_layer_2.
- From 2026-05-12T06:
- Not every pressure level covers the whole archive. 10 hPa starts at 2026-05-12T06 for geopotential height, temperature, horizontal wind and vertical velocity. Earlier initializations hold NaN at that level; specific humidity has no 10 hPa values.
Source changes over time
- The ECMWF upgrade at 2026-05-12T06 changes runoff. Account for this change when comparing runoff across that date.
Datasets
| Role | Name | ID | Version | URL |
|---|---|---|---|---|
| Validation | ECMWF AIFS ENS forecast, virtual | ecmwf-aifs-ens-forecast-virtual |
v0.1.0 |
s3://dynamical-ecmwf-aifs-ens/ecmwf-aifs-ens-forecast-virtual/v0.1.0.icechunk |
| Reference | NOAA GEFS analysis | noaa-gefs-analysis |
0.1.2 |
s3://dynamical-noaa-gefs/noaa-gefs-analysis/v0.1.2.icechunk/ |
Run parameters
| Parameter | Value |
|---|---|
| Validation dataset type | forecast |
| Validation time range | init_time 2025-07-01T06:00 → 2026-11-11T18:00 |
| Reference time range | time 2000-01-01T00:00 → 2026-11-13T03:00 |
| Point 1 | lat=40.0000, lon=-100.0000 |
| Point 2 | lat=45.0000, lon=-30.0000 |
| Ensemble member | 50 |
| Additional member check | All 35 variables reviewed at member 25, initialization 2026-11-06T00:00 and spatial lead 6 hours; full-period series use member 0 in both runs. |
| Spatial comparison time | init=2026-11-06T00:00, lead=6h (member, lead and reference time recorded per variable) |
| Timeseries period | init=2026-11-06T00:00 |
| Vertical level | 400 hPa for pressure-level variables |
| Store type | virtual — availability manifest-probed; value series sampled |
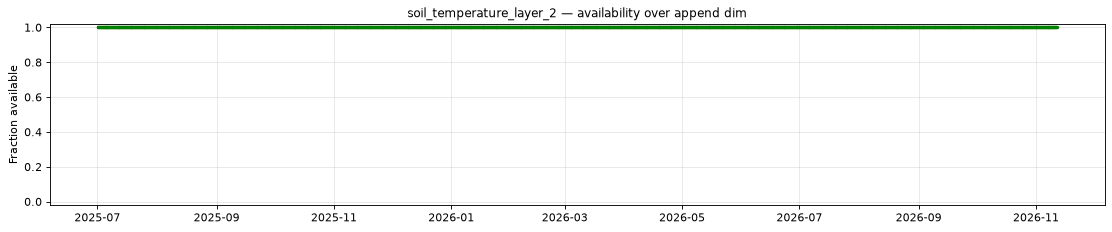
Availability
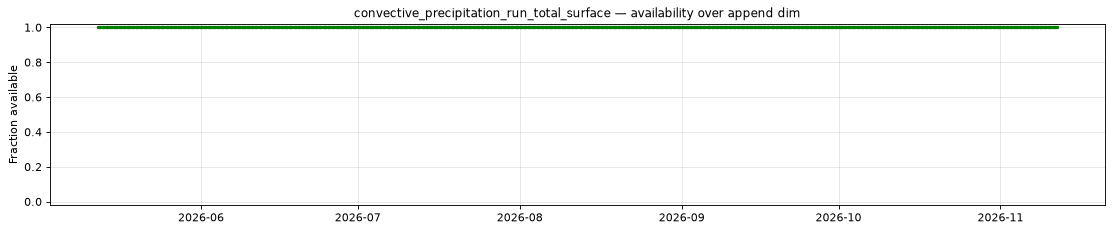
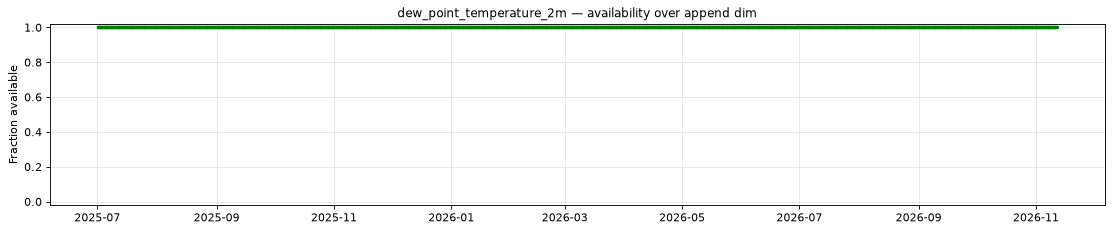
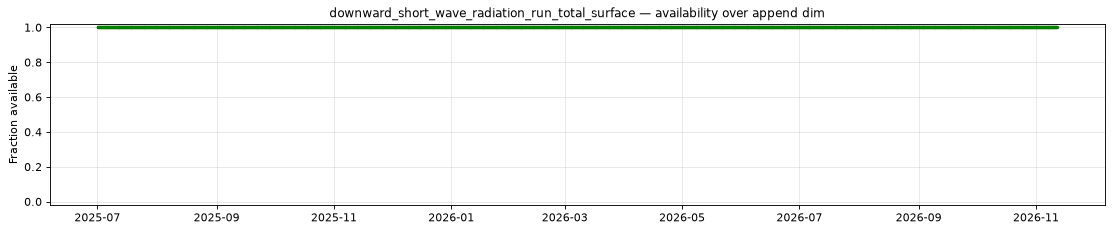
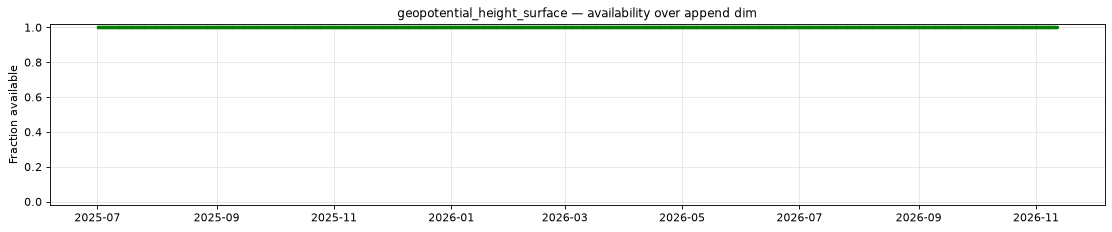
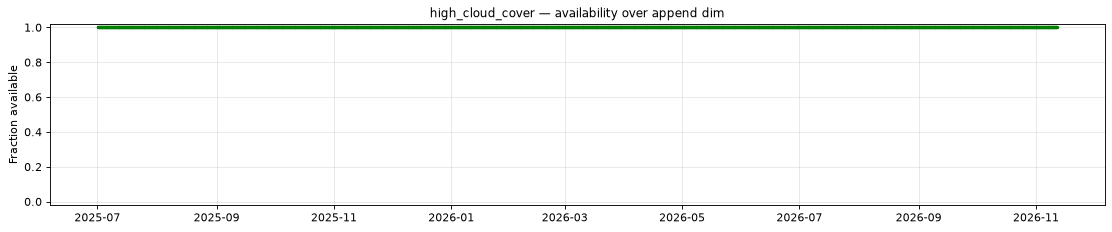
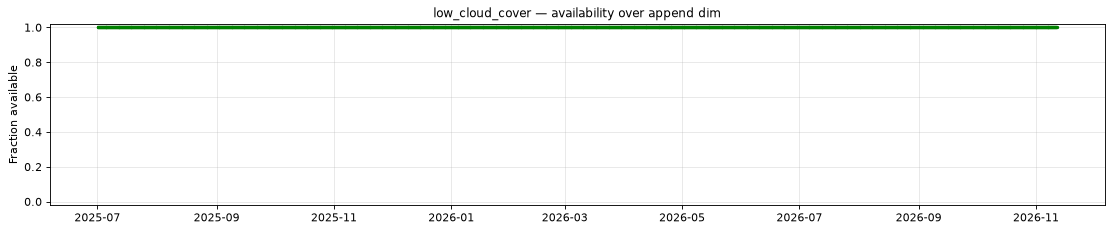
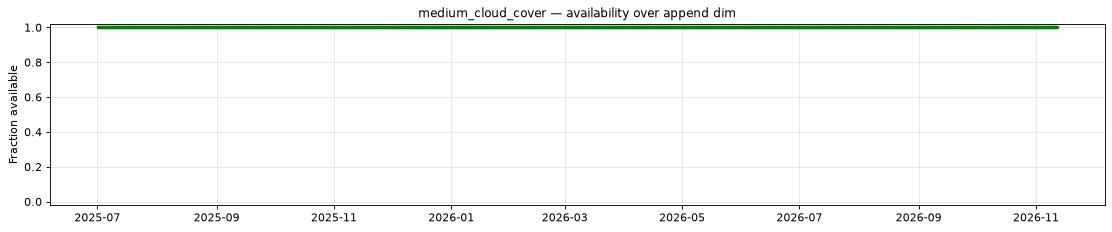
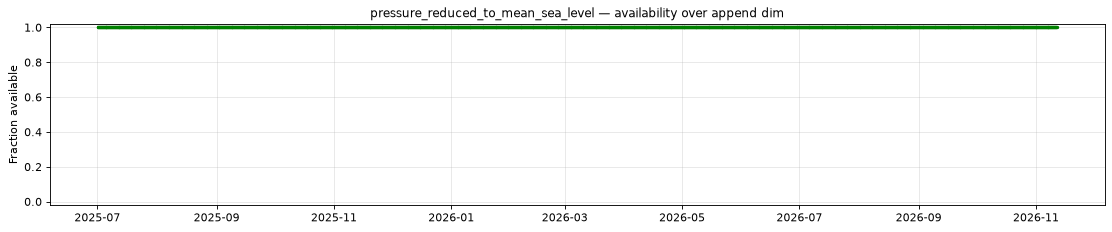
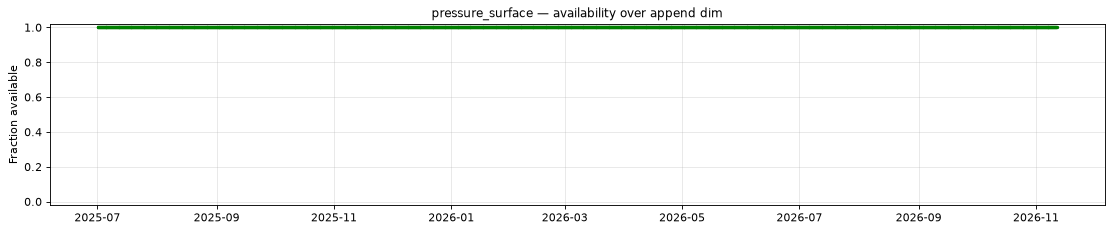
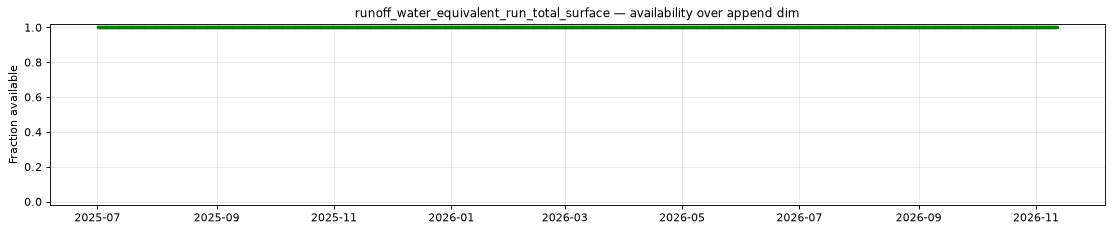
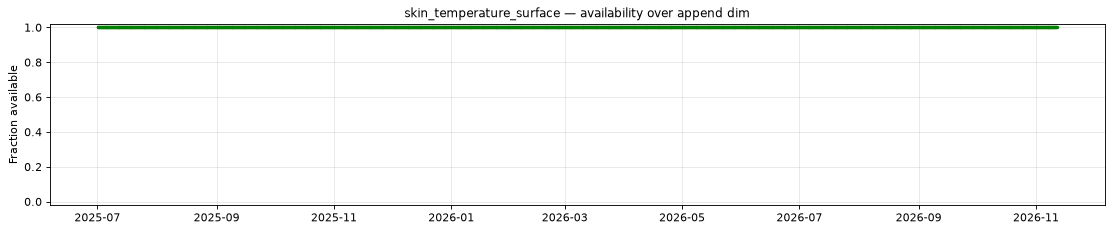
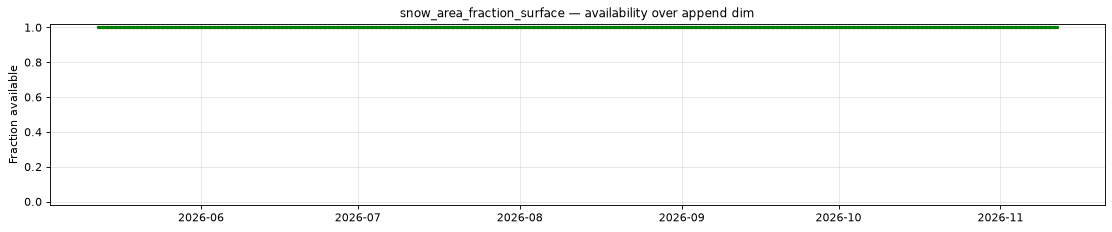
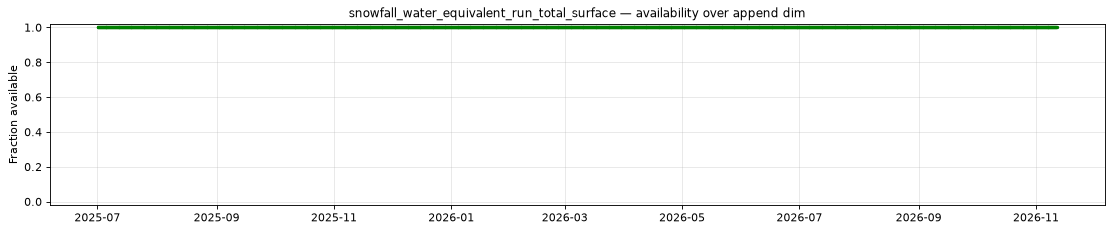
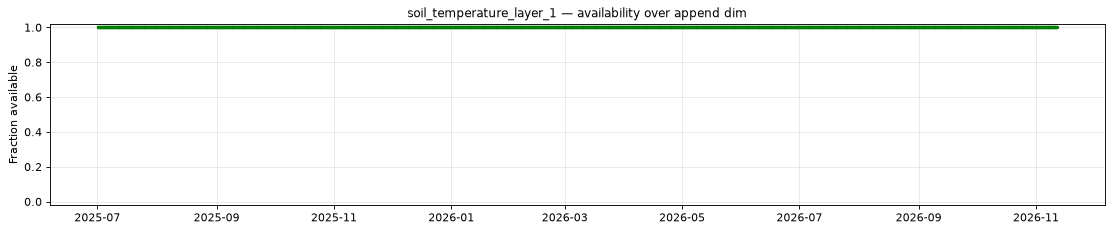
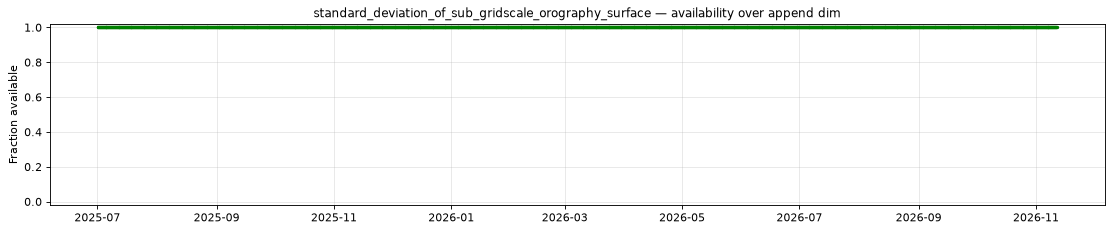
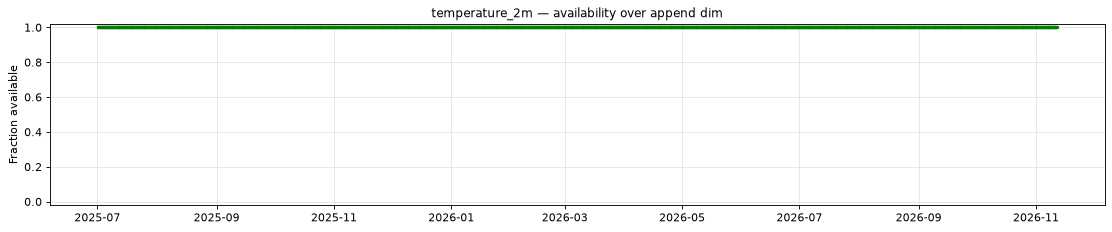
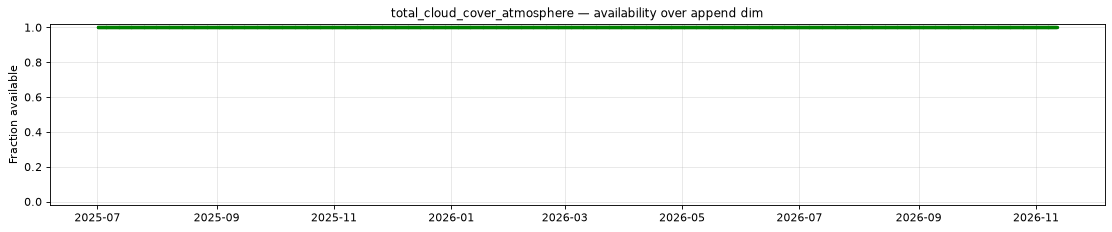
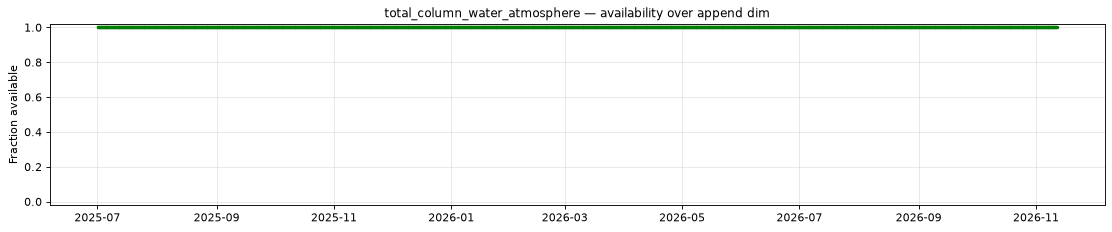
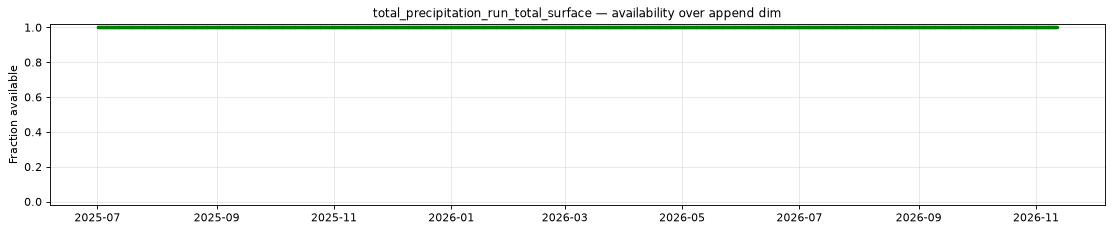
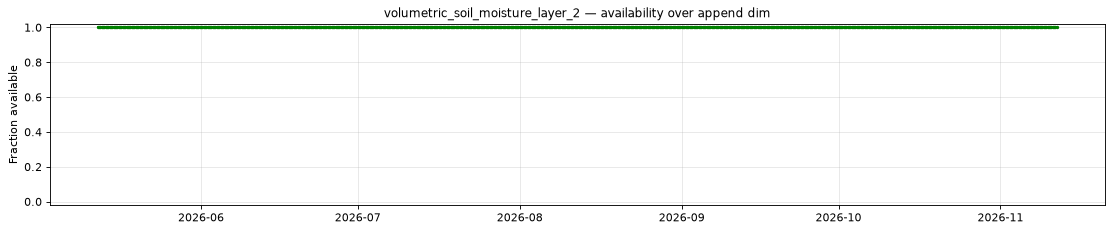
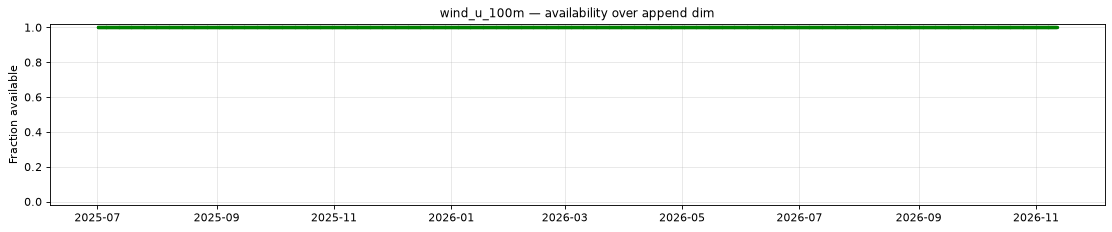
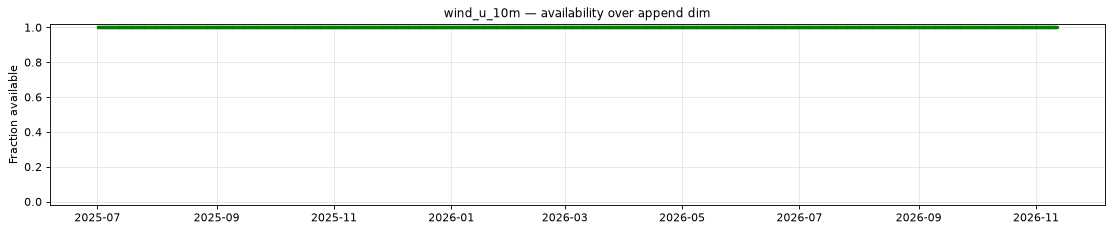
The plot below shows the availability of each variable over time — light red marks unavailable data, dark green marks present data.
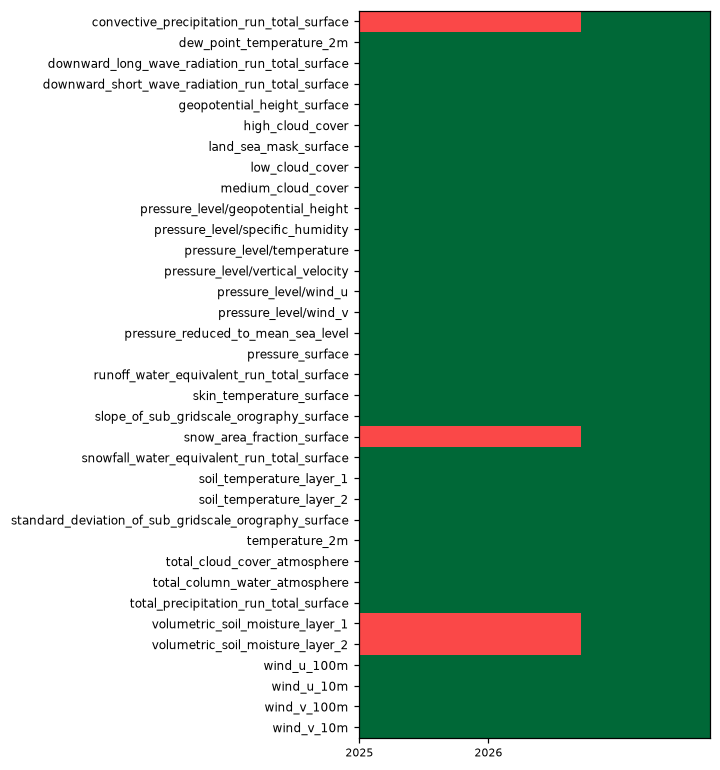
| Variable | Complete positions | Incomplete % | First incomplete | Last incomplete |
|---|---|---|---|---|
convective_precipitation_run_total_surface |
735/1995 | 63.16% | 2025-07-01T06:00 | 2026-05-12T00:00 |
snow_area_fraction_surface |
735/1995 | 63.16% | 2025-07-01T06:00 | 2026-05-12T00:00 |
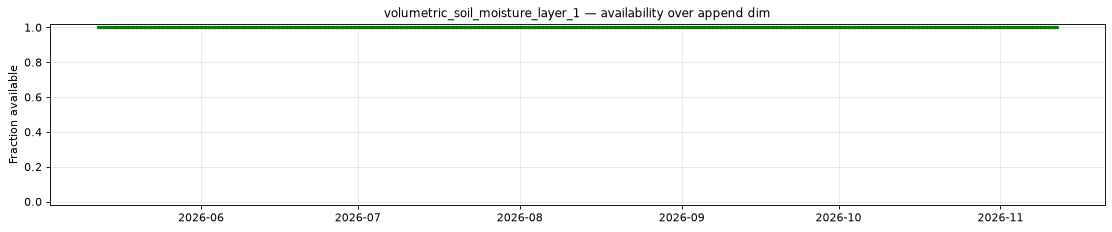
volumetric_soil_moisture_layer_1 |
735/1995 | 63.16% | 2025-07-01T06:00 | 2026-05-12T00:00 |
volumetric_soil_moisture_layer_2 |
735/1995 | 63.16% | 2025-07-01T06:00 | 2026-05-12T00:00 |
Decode health
5,840 variable/source-file array checks passed across 20 of 1,995 append-dim regions, five leads and up to two present pressure levels. The sampled members are 0, 1 and 50; one array check can span multiple member/level chunks. File completeness is exhaustive; decode health is sampled.
Per-variable details
convective_precipitation_run_total_surface
Metadata
| Field | Value |
|---|---|
| units | kg m-2 |
| long_name | Convective precipitation |
| short_name | cp |
| standard_name | convective_precipitation_amount |
| step_type | accum |
| comment | Accumulated since forecast initialization. |
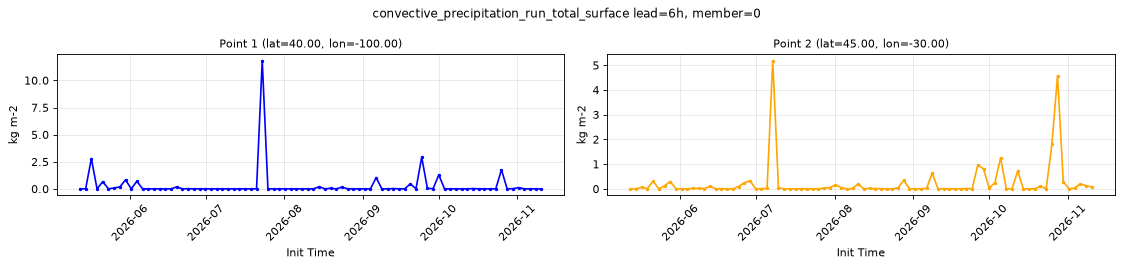
Point time series — 2025-07-01T06:00 - 2026-11-11T18:00, sampled lead=6h, member=0
| Point | min | mean | max |
|---|---|---|---|
| P1 | 0 | 0.3105 | 11.83 |
| P2 | 0 | 0.2414 | 5.187 |
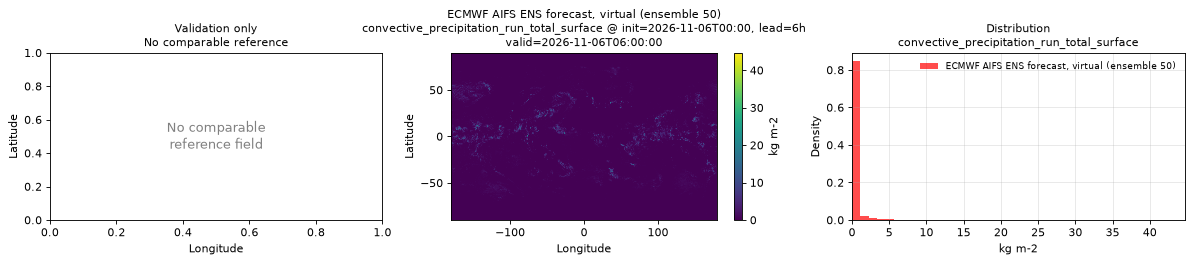
Spatial — init=2026-11-06T00:00, lead=6h, valid=2026-11-06T06:00:00, member=50 (reference not available)
| Source | min | mean | max |
|---|---|---|---|
| Validation | 0 | 0.2327 | 44.67 |
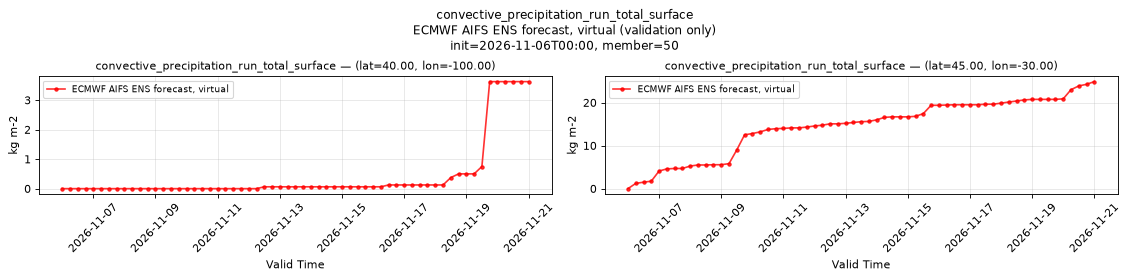
Temporal — init=2026-11-06T00:00, member=50
| Source | min | mean | max |
|---|---|---|---|
| P1 Validation | 0 | 0.4324 | 3.625 |
| P2 Validation | 0 | 14.46 | 24.88 |
Availability — 735 of 1995 positions complete (incomplete 2025-07-01T06:00 → 2026-05-12T00:00)
dew_point_temperature_2m
Metadata
| Field | Value |
|---|---|
| units | degree_Celsius |
| long_name | 2 metre dewpoint temperature |
| short_name | 2d |
| standard_name | dew_point_temperature |
| step_type | instant |
| comment | Dew point can exceed air temperature, so derived relative humidity can exceed 100%. |
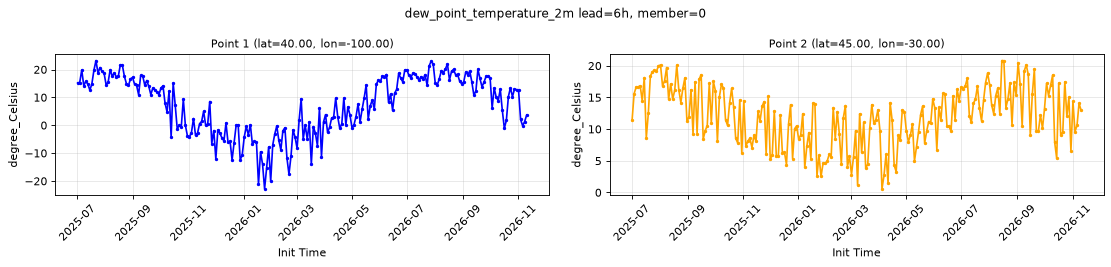
Point time series — 2025-07-01T06:00 - 2026-11-11T18:00, sampled lead=6h, member=0
| Point | min | mean | max |
|---|---|---|---|
| P1 | -22.8 | 7.271 | 23.21 |
| P2 | 0.5704 | 11.93 | 20.82 |
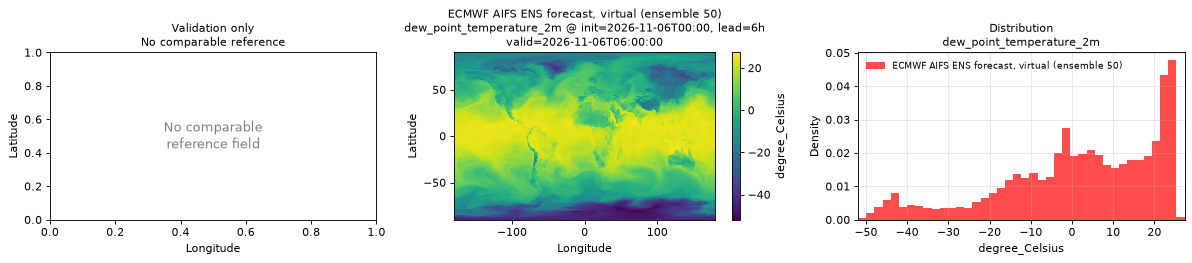
Spatial — init=2026-11-06T00:00, lead=6h, valid=2026-11-06T06:00:00, member=50 (reference not available)
| Source | min | mean | max |
|---|---|---|---|
| Validation | -51.92 | 1.7 | 27.33 |
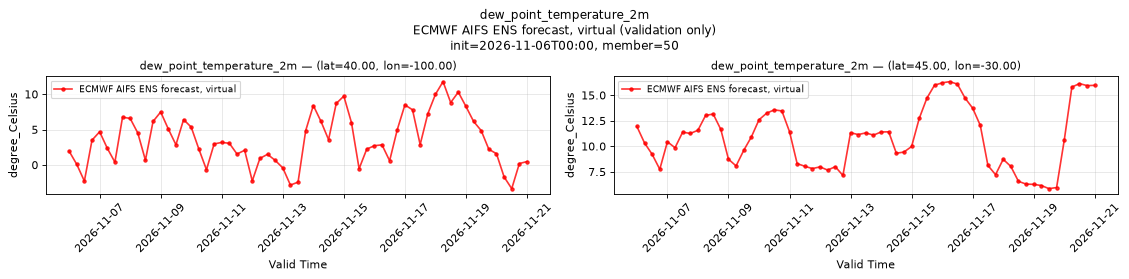
Temporal — init=2026-11-06T00:00, member=50
| Source | min | mean | max |
|---|---|---|---|
| P1 Validation | -3.361 | 3.572 | 11.78 |
| P2 Validation | 5.848 | 10.83 | 16.33 |
Availability — 1995 of 1995 positions complete
downward_long_wave_radiation_run_total_surface
Metadata
| Field | Value |
|---|---|
| units | W s m-2 |
| long_name | Surface long-wave (thermal) radiation downwards |
| short_name | strd |
| standard_name | integral_wrt_time_of_surface_downwelling_longwave_flux_in_air |
| step_type | accum |
| comment | Accumulated since forecast initialization. |
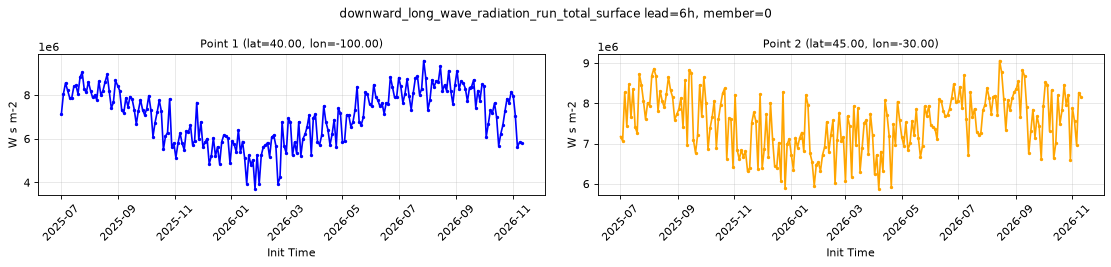
Point time series — 2025-07-01T06:00 - 2026-11-11T18:00, sampled lead=6h, member=0
| Point | min | mean | max |
|---|---|---|---|
| P1 | 3.707e+06 | 7.041e+06 | 9.576e+06 |
| P2 | 5.875e+06 | 7.516e+06 | 9.061e+06 |
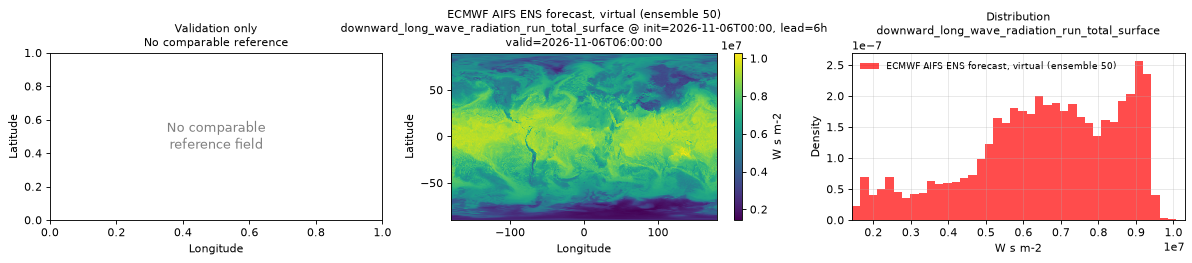
Spatial — init=2026-11-06T00:00, lead=6h, valid=2026-11-06T06:00:00, member=50 (reference not available)
| Source | min | mean | max |
|---|---|---|---|
| Validation | 1.432e+06 | 6.552e+06 | 1.03e+07 |
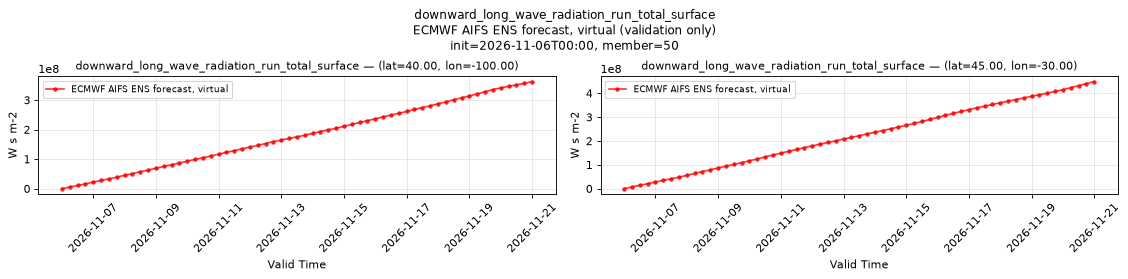
Temporal — init=2026-11-06T00:00, member=50
| Source | min | mean | max |
|---|---|---|---|
| P1 Validation | 0 | 1.78e+08 | 3.622e+08 |
| P2 Validation | 0 | 2.228e+08 | 4.487e+08 |
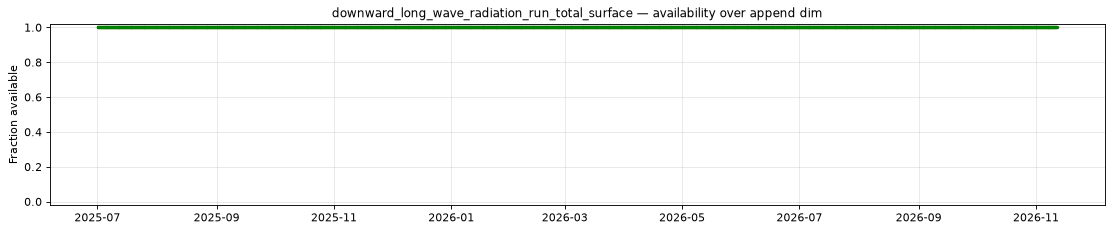
Availability — 1995 of 1995 positions complete
downward_short_wave_radiation_run_total_surface
Metadata
| Field | Value |
|---|---|
| units | W s m-2 |
| long_name | Surface short-wave (solar) radiation downwards |
| short_name | ssrd |
| standard_name | integral_wrt_time_of_surface_downwelling_shortwave_flux_in_air |
| step_type | accum |
| comment | Accumulated since forecast initialization. |
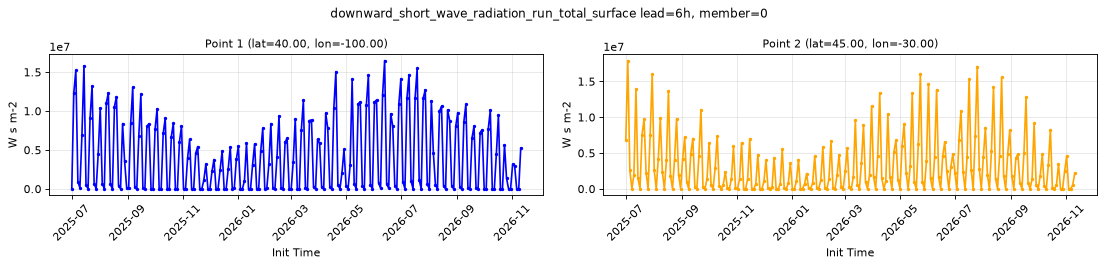
Point time series — 2025-07-01T06:00 - 2026-11-11T18:00, sampled lead=6h, member=0
| Point | min | mean | max |
|---|---|---|---|
| P1 | 0 | 4.157e+06 | 1.648e+07 |
| P2 | 0 | 3.254e+06 | 1.791e+07 |
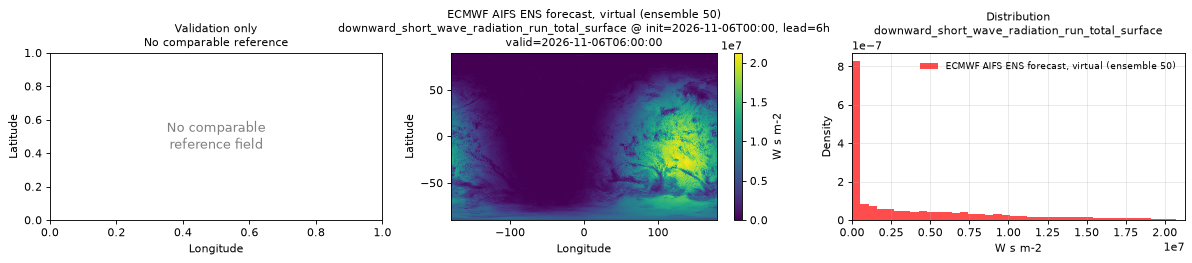
Spatial — init=2026-11-06T00:00, lead=6h, valid=2026-11-06T06:00:00, member=50 (reference not available)
| Source | min | mean | max |
|---|---|---|---|
| Validation | 0 | 3.854e+06 | 2.127e+07 |
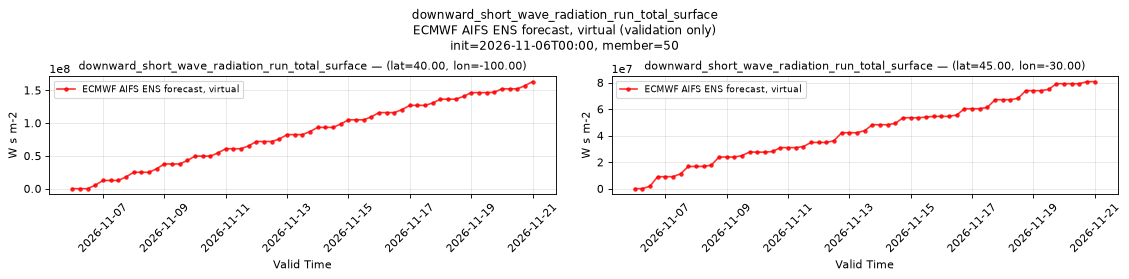
Temporal — init=2026-11-06T00:00, member=50
| Source | min | mean | max |
|---|---|---|---|
| P1 Validation | 0 | 8.346e+07 | 1.631e+08 |
| P2 Validation | 0 | 4.369e+07 | 8.074e+07 |
Availability — 1995 of 1995 positions complete
geopotential_height_surface
Metadata
| Field | Value |
|---|---|
| units | m |
| long_name | Geopotential height |
| short_name | gh |
| standard_name | geopotential_height |
| step_type | instant |
| comment | Surface (orography) geopotential height. Time-invariant field published at lead time 0 only. |
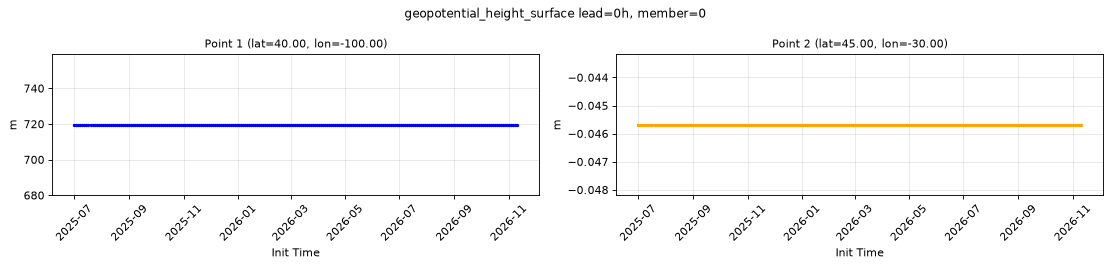
Point time series — 2025-07-01T06:00 - 2026-11-11T18:00, sampled lead=0h, member=0
| Point | min | mean | max |
|---|---|---|---|
| P1 | 719.6 | 719.6 | 719.6 |
| P2 | -0.04568 | -0.04568 | -0.04568 |
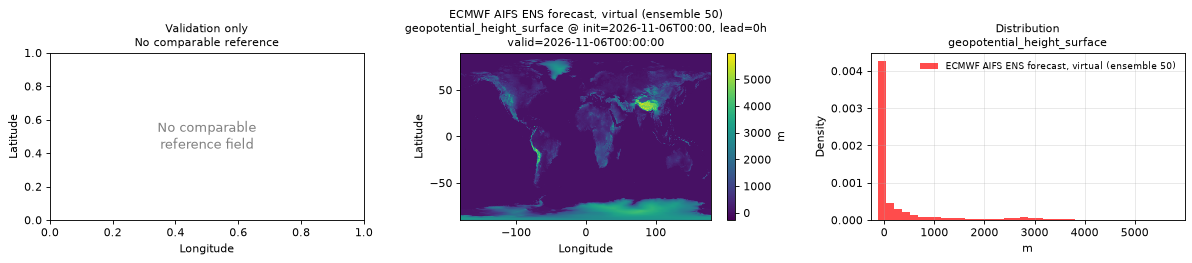
Spatial — init=2026-11-06T00:00, lead=0h, valid=2026-11-06T00:00:00, member=50 (reference not available)
| Source | min | mean | max |
|---|---|---|---|
| Validation | -271.4 | 379.8 | 5996 |
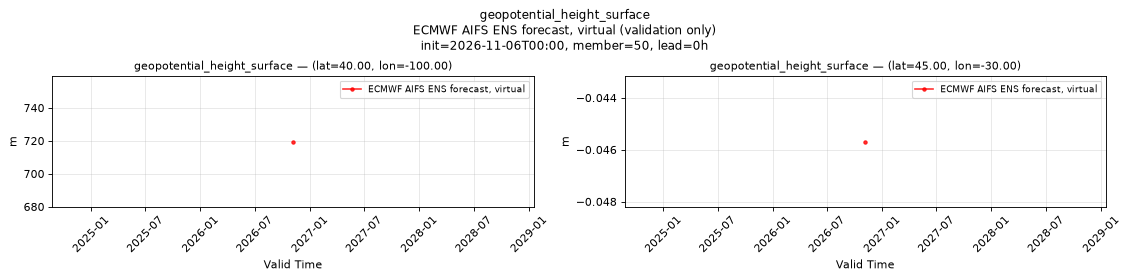
Temporal — init=2026-11-06T00:00, member=50, lead=0h
| Source | min | mean | max |
|---|---|---|---|
| P1 Validation | 719.6 | 719.6 | 719.6 |
| P2 Validation | -0.04568 | -0.04568 | -0.04568 |
Availability — 1995 of 1995 positions complete
high_cloud_cover
Metadata
| Field | Value |
|---|---|
| units | percent |
| long_name | High cloud cover |
| short_name | hcc |
| standard_name | cloud_area_fraction_in_atmosphere_layer |
| step_type | instant |
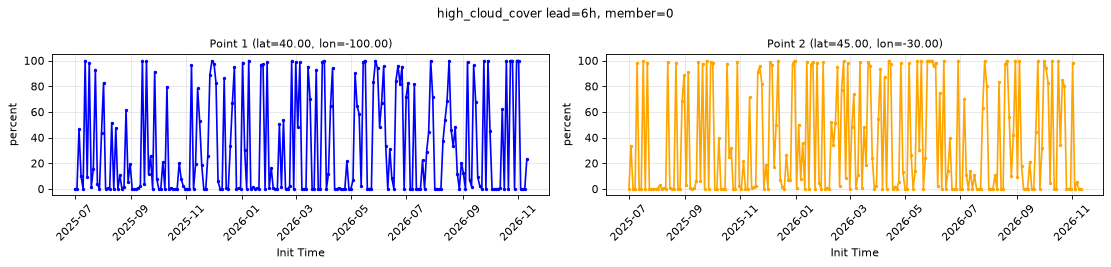
Point time series — 2025-07-01T06:00 - 2026-11-11T18:00, sampled lead=6h, member=0
| Point | min | mean | max |
|---|---|---|---|
| P1 | 0 | 32.23 | 100 |
| P2 | 0 | 35.74 | 100 |
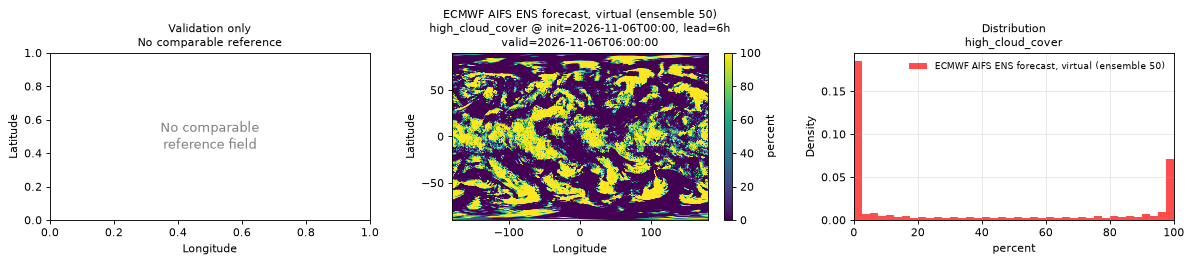
Spatial — init=2026-11-06T00:00, lead=6h, valid=2026-11-06T06:00:00, member=50 (reference not available)
| Source | min | mean | max |
|---|---|---|---|
| Validation | 0 | 35.73 | 100 |
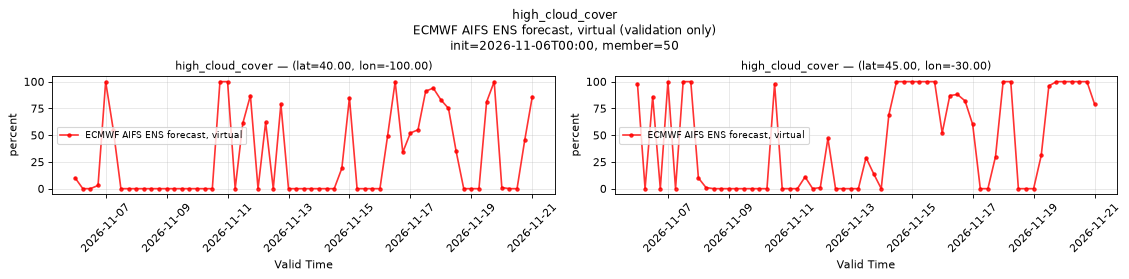
Temporal — init=2026-11-06T00:00, member=50
| Source | min | mean | max |
|---|---|---|---|
| P1 Validation | 0 | 28.56 | 100 |
| P2 Validation | 0 | 43.75 | 100 |
Availability — 1995 of 1995 positions complete
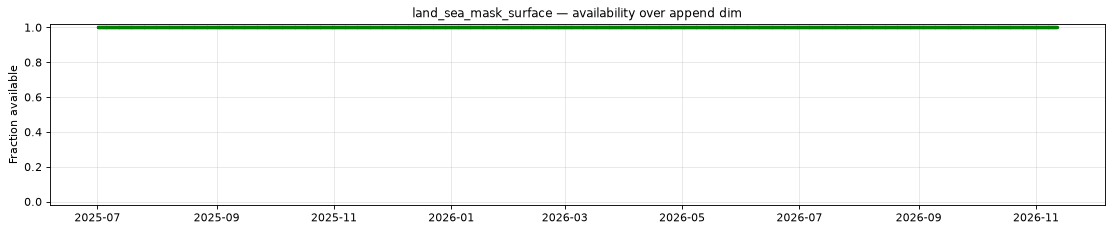
land_sea_mask_surface
Metadata
| Field | Value |
|---|---|
| units | 1 |
| long_name | Land-sea mask |
| short_name | lsm |
| standard_name | land_area_fraction |
| step_type | instant |
| comment | Fraction (0-1) of the grid box that is land. Time-invariant field published at lead time 0 only. |
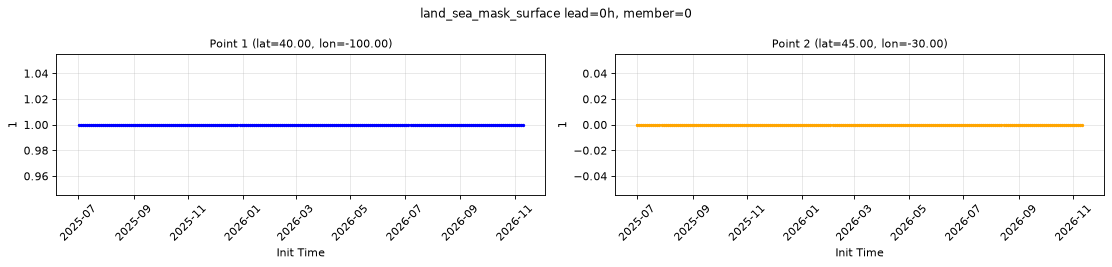
Point time series — 2025-07-01T06:00 - 2026-11-11T18:00, sampled lead=0h, member=0
| Point | min | mean | max |
|---|---|---|---|
| P1 | 1 | 1 | 1 |
| P2 | 0 | 0 | 0 |
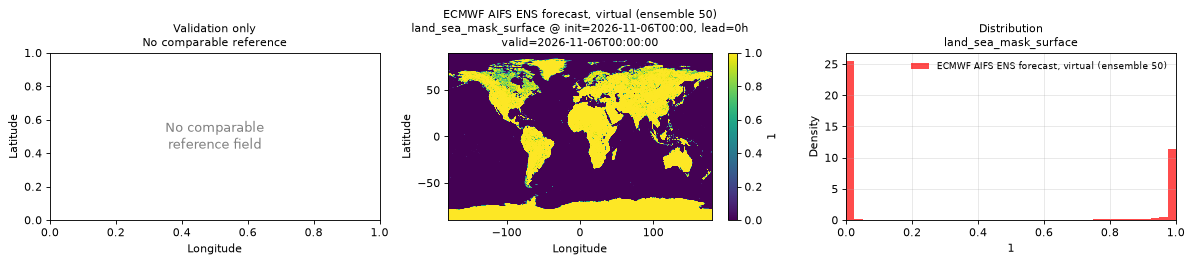
Spatial — init=2026-11-06T00:00, lead=0h, valid=2026-11-06T00:00:00, member=50 (reference not available)
| Source | min | mean | max |
|---|---|---|---|
| Validation | 0 | 0.3344 | 1 |
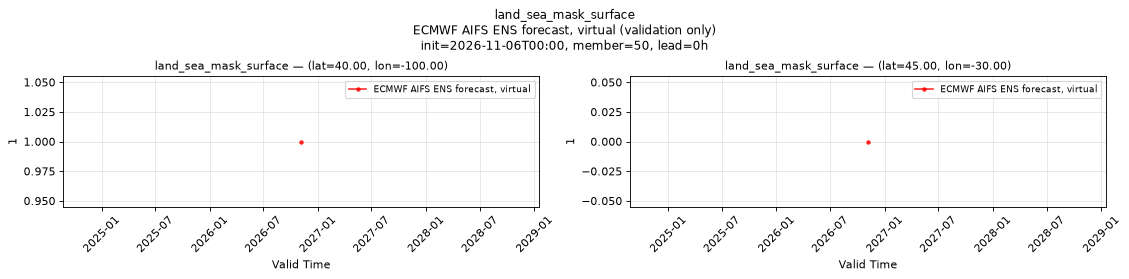
Temporal — init=2026-11-06T00:00, member=50, lead=0h
| Source | min | mean | max |
|---|---|---|---|
| P1 Validation | 1 | 1 | 1 |
| P2 Validation | 0 | 0 | 0 |
Availability — 1995 of 1995 positions complete
low_cloud_cover
Metadata
| Field | Value |
|---|---|
| units | percent |
| long_name | Low cloud cover |
| short_name | lcc |
| standard_name | cloud_area_fraction_in_atmosphere_layer |
| step_type | instant |
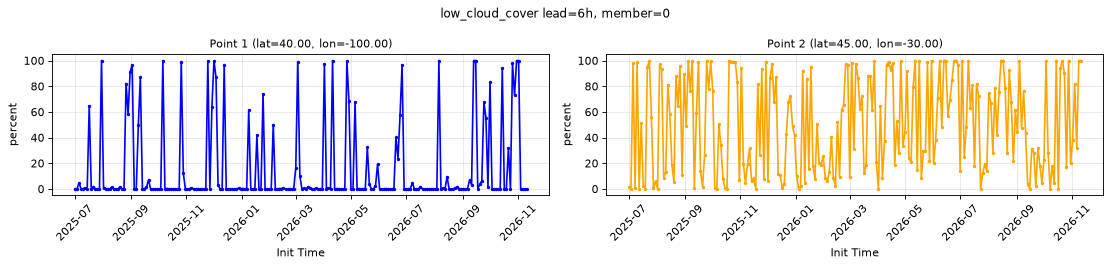
Point time series — 2025-07-01T06:00 - 2026-11-11T18:00, sampled lead=6h, member=0
| Point | min | mean | max |
|---|---|---|---|
| P1 | 0 | 15.41 | 100 |
| P2 | 0 | 50 | 100 |
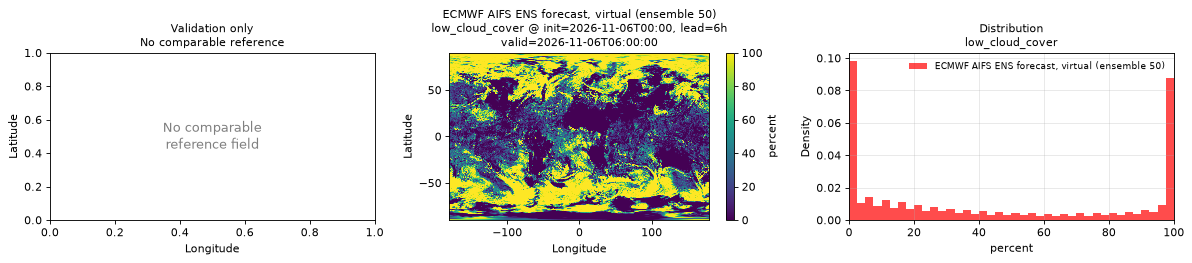
Spatial — init=2026-11-06T00:00, lead=6h, valid=2026-11-06T06:00:00, member=50 (reference not available)
| Source | min | mean | max |
|---|---|---|---|
| Validation | 0 | 43.87 | 100 |
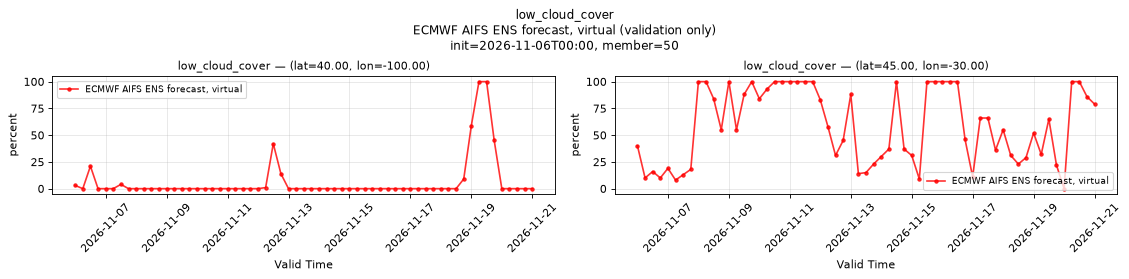
Temporal — init=2026-11-06T00:00, member=50
| Source | min | mean | max |
|---|---|---|---|
| P1 Validation | 0 | 6.525 | 100 |
| P2 Validation | 0 | 58.9 | 100 |
Availability — 1995 of 1995 positions complete
medium_cloud_cover
Metadata
| Field | Value |
|---|---|
| units | percent |
| long_name | Medium cloud cover |
| short_name | mcc |
| standard_name | cloud_area_fraction_in_atmosphere_layer |
| step_type | instant |
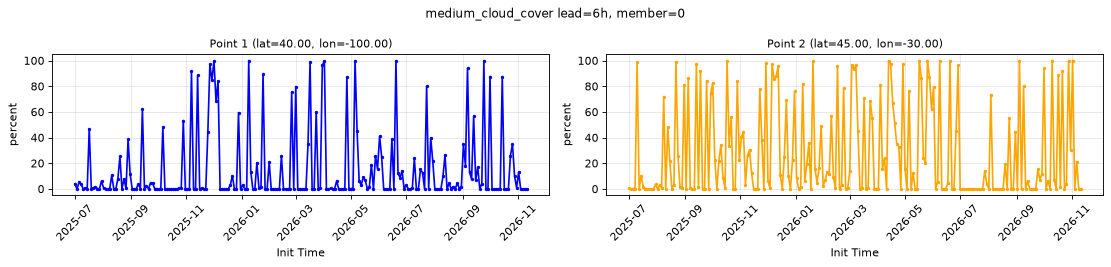
Point time series — 2025-07-01T06:00 - 2026-11-11T18:00, sampled lead=6h, member=0
| Point | min | mean | max |
|---|---|---|---|
| P1 | 0 | 14.99 | 100 |
| P2 | 0 | 27.85 | 100 |
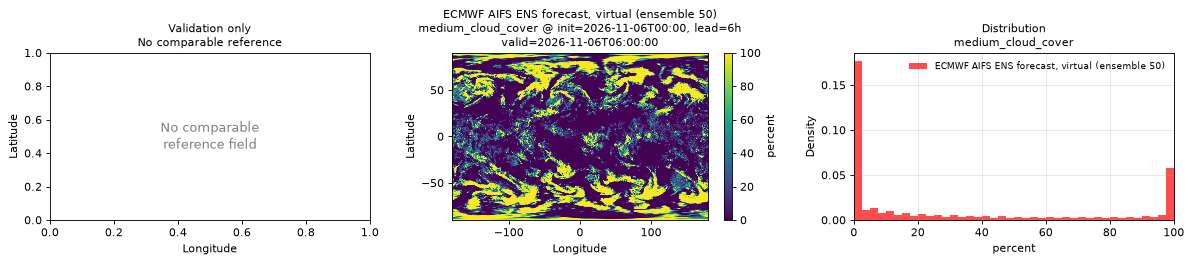
Spatial — init=2026-11-06T00:00, lead=6h, valid=2026-11-06T06:00:00, member=50 (reference not available)
| Source | min | mean | max |
|---|---|---|---|
| Validation | 0 | 30.34 | 100 |
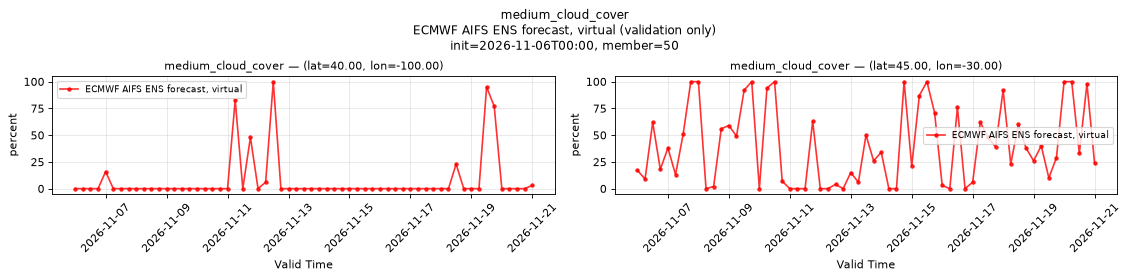
Temporal — init=2026-11-06T00:00, member=50
| Source | min | mean | max |
|---|---|---|---|
| P1 Validation | 0 | 7.393 | 100 |
| P2 Validation | 0 | 40.18 | 100 |
Availability — 1995 of 1995 positions complete
pressure_level/geopotential_height [pressure_level=400]
Metadata
| Field | Value |
|---|---|
| units | m |
| long_name | Geopotential height |
| short_name | gh |
| standard_name | geopotential_height |
| step_type | instant |
| sampled level | pressure_level=400 |
Point time series — 2025-07-01T06:00 - 2026-11-11T18:00, sampled lead=6h, member=0, pressure_level=400
| Point | min | mean | max |
|---|---|---|---|
| P1 | 6936 | 7444 | 7717 |
| P2 | 6669 | 7356 | 7662 |
Spatial — init=2026-11-06T00:00, lead=6h, valid=2026-11-06T06:00:00, member=50 (reference not available)
| Source | min | mean | max |
|---|---|---|---|
| Validation | 6253 | 7127 | 7663 |
Temporal — init=2026-11-06T00:00, member=50
| Source | min | mean | max |
|---|---|---|---|
| P1 Validation | 7200 | 7365 | 7467 |
| P2 Validation | 6958 | 7239 | 7487 |
Availability — 1995 of 1995 positions complete
pressure_level/specific_humidity [pressure_level=400]
Metadata
| Field | Value |
|---|---|
| units | 1 |
| long_name | Specific humidity |
| short_name | q |
| standard_name | specific_humidity |
| step_type | instant |
| sampled level | pressure_level=400 |
| comment | The source provides no 10 hPa level for this variable; that level is always NaN. |
Point time series — 2025-07-01T06:00 - 2026-11-11T18:00, sampled lead=6h, member=0, pressure_level=400
| Point | min | mean | max |
|---|---|---|---|
| P1 | 1.067e-05 | 0.0005534 | 0.003086 |
| P2 | 0 | 0.0005422 | 0.002022 |
Spatial — init=2026-11-06T00:00, lead=6h, valid=2026-11-06T06:00:00, member=50 (reference not available)
| Source | min | mean | max |
|---|---|---|---|
| Validation | 0 | 0.0003952 | 0.003761 |
Temporal — init=2026-11-06T00:00, member=50
| Source | min | mean | max |
|---|---|---|---|
| P1 Validation | 3.052e-05 | 0.0002809 | 0.0008545 |
| P2 Validation | 0 | 0.0004529 | 0.002014 |
Availability — 1995 of 1995 positions complete
pressure_level/temperature [pressure_level=400]
Metadata
| Field | Value |
|---|---|
| units | degree_Celsius |
| long_name | Temperature |
| short_name | t |
| standard_name | air_temperature |
| step_type | instant |
| sampled level | pressure_level=400 |
Point time series — 2025-07-01T06:00 - 2026-11-11T18:00, sampled lead=6h, member=0, pressure_level=400
| Point | min | mean | max |
|---|---|---|---|
| P1 | -40.26 | -23.91 | -12.38 |
| P2 | -45.57 | -26.06 | -15.45 |
Spatial — init=2026-11-06T00:00, lead=6h, valid=2026-11-06T06:00:00, member=50 (reference not available)
| Source | min | mean | max |
|---|---|---|---|
| Validation | -55.98 | -31.22 | -11.86 |
Temporal — init=2026-11-06T00:00, member=50
| Source | min | mean | max |
|---|---|---|---|
| P1 Validation | -32.81 | -27.43 | -23.77 |
| P2 Validation | -37.32 | -28.19 | -17.67 |
Availability — 1995 of 1995 positions complete
pressure_level/vertical_velocity [pressure_level=400]
Metadata
| Field | Value |
|---|---|
| units | Pa s-1 |
| long_name | Vertical velocity |
| short_name | w |
| standard_name | lagrangian_tendency_of_air_pressure |
| step_type | instant |
| sampled level | pressure_level=400 |
Point time series — 2025-07-01T06:00 - 2026-11-11T18:00, sampled lead=6h, member=0, pressure_level=400
| Point | min | mean | max |
|---|---|---|---|
| P1 | -1.325 | 0.01363 | 0.6959 |
| P2 | -0.8343 | 0.007992 | 0.6555 |
Spatial — init=2026-11-06T00:00, lead=6h, valid=2026-11-06T06:00:00, member=50 (reference not available)
| Source | min | mean | max |
|---|---|---|---|
| Validation | -5.034 | 0.001055 | 2.743 |
Temporal — init=2026-11-06T00:00, member=50
| Source | min | mean | max |
|---|---|---|---|
| P1 Validation | -0.6189 | -0.0271 | 0.3163 |
| P2 Validation | -0.5587 | -0.01163 | 0.426 |
Availability — 1995 of 1995 positions complete
pressure_level/wind_u [pressure_level=400]
Metadata
| Field | Value |
|---|---|
| units | m s-1 |
| long_name | U component of wind |
| short_name | u |
| standard_name | eastward_wind |
| step_type | instant |
| sampled level | pressure_level=400 |
Point time series — 2025-07-01T06:00 - 2026-11-11T18:00, sampled lead=6h, member=0, pressure_level=400
| Point | min | mean | max |
|---|---|---|---|
| P1 | -18.63 | 15.44 | 48.56 |
| P2 | -23.9 | 19.83 | 78.46 |
Spatial — init=2026-11-06T00:00, lead=6h, valid=2026-11-06T06:00:00, member=50 (reference not available)
| Source | min | mean | max |
|---|---|---|---|
| Validation | -28.53 | 9.638 | 66.35 |
Temporal — init=2026-11-06T00:00, member=50
| Source | min | mean | max |
|---|---|---|---|
| P1 Validation | -15.87 | 9.969 | 32.69 |
| P2 Validation | -18.08 | 18.19 | 48.87 |
Availability — 1995 of 1995 positions complete
pressure_level/wind_v [pressure_level=400]
Metadata
| Field | Value |
|---|---|
| units | m s-1 |
| long_name | V component of wind |
| short_name | v |
| standard_name | northward_wind |
| step_type | instant |
| sampled level | pressure_level=400 |
Point time series — 2025-07-01T06:00 - 2026-11-11T18:00, sampled lead=6h, member=0, pressure_level=400
| Point | min | mean | max |
|---|---|---|---|
| P1 | -47.78 | -2.621 | 30.97 |
| P2 | -54.96 | 0.426 | 35.84 |
Spatial — init=2026-11-06T00:00, lead=6h, valid=2026-11-06T06:00:00, member=50 (reference not available)
| Source | min | mean | max |
|---|---|---|---|
| Validation | -56.88 | 0.04026 | 51.31 |
Temporal — init=2026-11-06T00:00, member=50
| Source | min | mean | max |
|---|---|---|---|
| P1 Validation | -43.39 | -2.585 | 34.96 |
| P2 Validation | -30.86 | -1.507 | 27.38 |
Availability — 1995 of 1995 positions complete
pressure_reduced_to_mean_sea_level
Metadata
| Field | Value |
|---|---|
| units | Pa |
| long_name | Pressure reduced to MSL |
| short_name | prmsl |
| standard_name | air_pressure_at_mean_sea_level |
| step_type | instant |
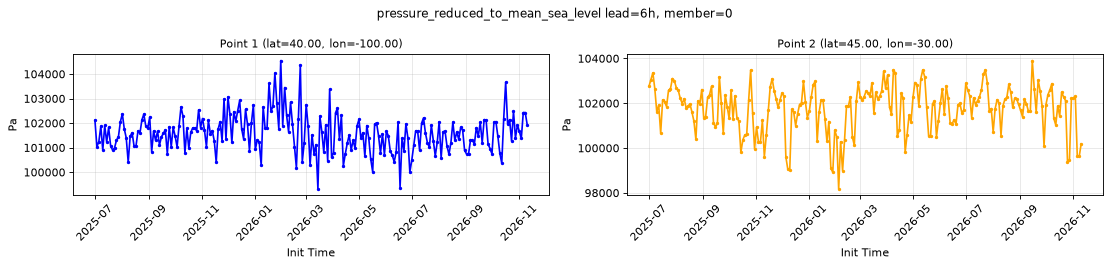
Point time series — 2025-07-01T06:00 - 2026-11-11T18:00, sampled lead=6h, member=0
| Point | min | mean | max |
|---|---|---|---|
| P1 | 9.932e+04 | 1.016e+05 | 1.045e+05 |
| P2 | 9.818e+04 | 1.018e+05 | 1.039e+05 |
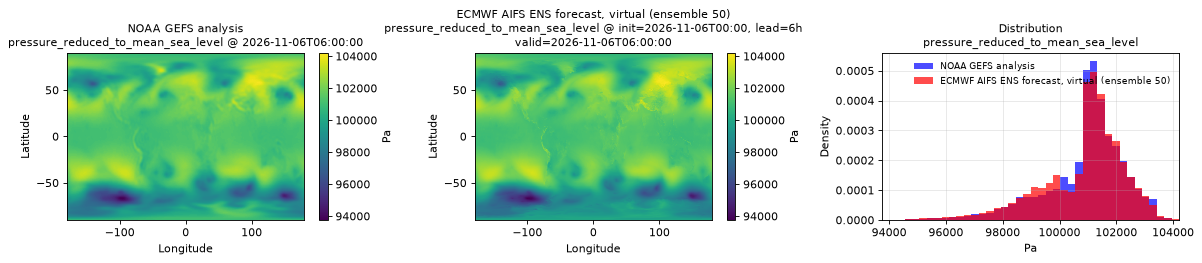
Spatial — init=2026-11-06T00:00, lead=6h, valid=2026-11-06T06:00:00, member=50 (reference at 2026-11-06T06:00:00)
| Source | min | mean | max |
|---|---|---|---|
| Validation | 9.376e+04 | 1.008e+05 | 1.042e+05 |
| Reference | 9.376e+04 | 1.009e+05 | 1.041e+05 |
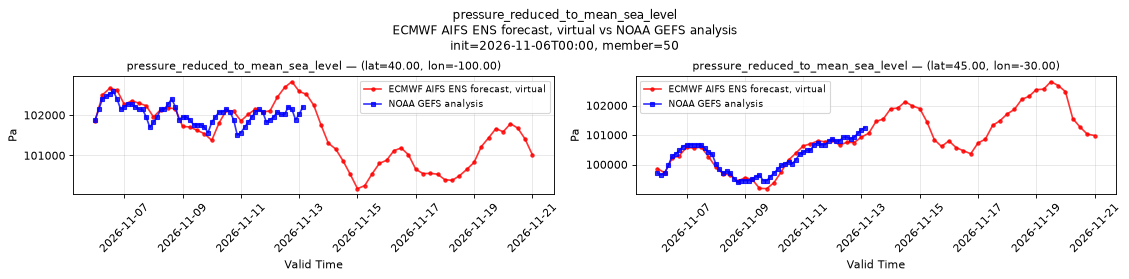
Temporal — init=2026-11-06T00:00, member=50
| Source | min | mean | max |
|---|---|---|---|
| P1 Validation | 1.002e+05 | 1.016e+05 | 1.028e+05 |
| P1 Reference | 1.015e+05 | 1.02e+05 | 1.026e+05 |
| P2 Validation | 9.918e+04 | 1.009e+05 | 1.028e+05 |
| P2 Reference | 9.939e+04 | 1.002e+05 | 1.012e+05 |
Availability — 1995 of 1995 positions complete
pressure_surface
Metadata
| Field | Value |
|---|---|
| units | Pa |
| long_name | Surface pressure |
| short_name | sp |
| standard_name | surface_air_pressure |
| step_type | instant |
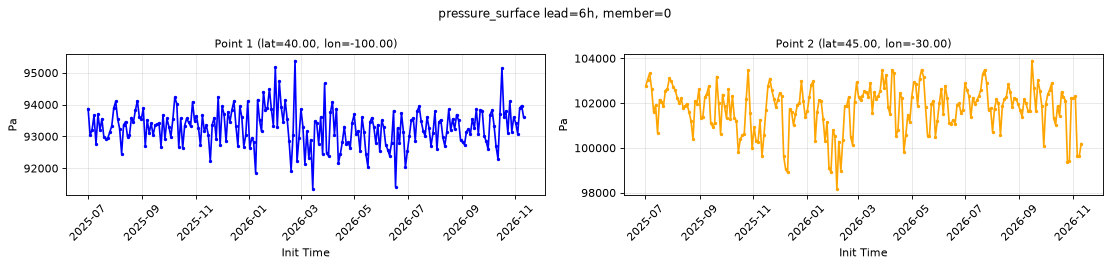
Point time series — 2025-07-01T06:00 - 2026-11-11T18:00, sampled lead=6h, member=0
| Point | min | mean | max |
|---|---|---|---|
| P1 | 9.135e+04 | 9.329e+04 | 9.538e+04 |
| P2 | 9.817e+04 | 1.018e+05 | 1.039e+05 |
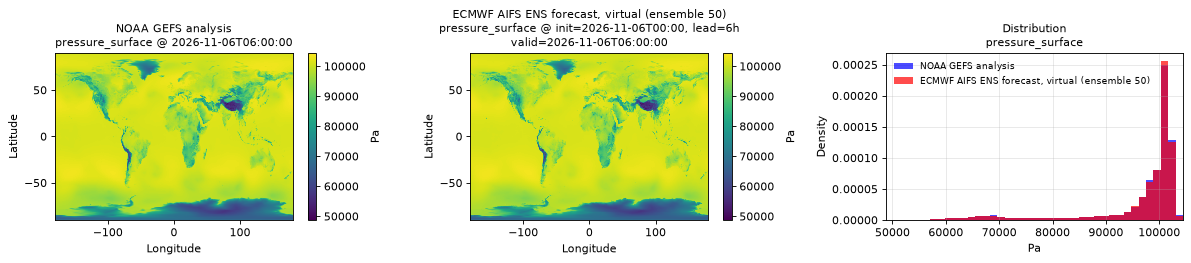
Spatial — init=2026-11-06T00:00, lead=6h, valid=2026-11-06T06:00:00, member=50 (reference at 2026-11-06T06:00:00)
| Source | min | mean | max |
|---|---|---|---|
| Validation | 4.874e+04 | 9.657e+04 | 1.045e+05 |
| Reference | 5.027e+04 | 9.657e+04 | 1.036e+05 |
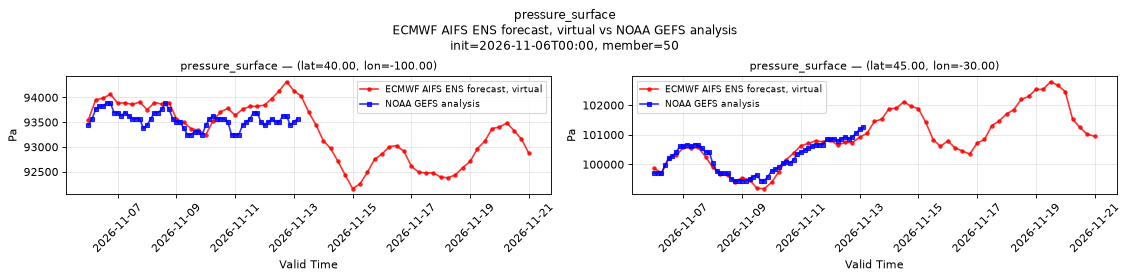
Temporal — init=2026-11-06T00:00, member=50
| Source | min | mean | max |
|---|---|---|---|
| P1 Validation | 9.216e+04 | 9.331e+04 | 9.432e+04 |
| P1 Reference | 9.325e+04 | 9.355e+04 | 9.389e+04 |
| P2 Validation | 9.918e+04 | 1.009e+05 | 1.028e+05 |
| P2 Reference | 9.946e+04 | 1.002e+05 | 1.012e+05 |
Availability — 1995 of 1995 positions complete
runoff_water_equivalent_run_total_surface
Metadata
| Field | Value |
|---|---|
| units | kg m-2 |
| long_name | Runoff water equivalent (surface plus subsurface) |
| short_name | rowe |
| standard_name | runoff_amount |
| step_type | accum |
| comment | Applies over land only; over water values may be NaN or finite, so mask with land_sea_mask_surface. Accumulated since forecast initialization. |
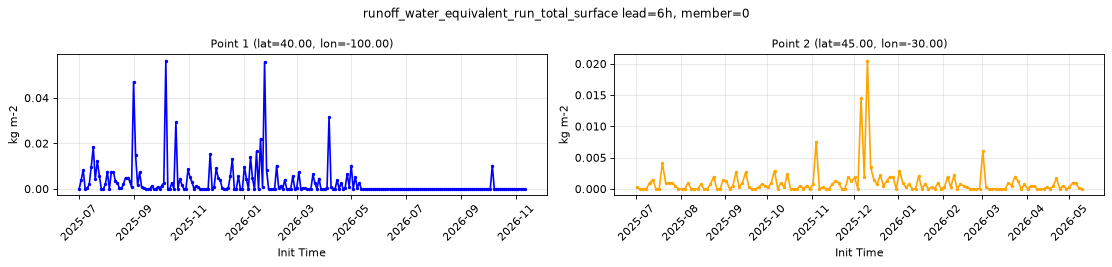
Point time series — 2025-07-01T06:00 - 2026-11-11T18:00, sampled lead=6h, member=0
| Point | min | mean | max |
|---|---|---|---|
| P1 | 0 | 0.002785 | 0.0564 |
| P2 | 0 | 0.0009617 | 0.02051 |
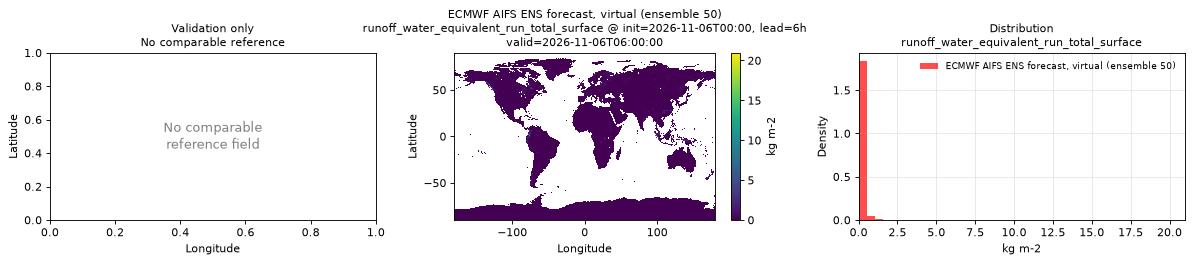
Spatial — init=2026-11-06T00:00, lead=6h, valid=2026-11-06T06:00:00, member=50 (reference not available)
| Source | min | mean | max |
|---|---|---|---|
| Validation | 0 | 0.06724 | 20.97 |
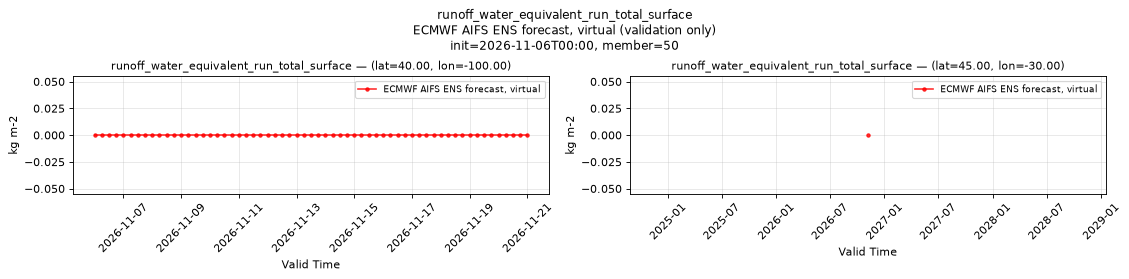
Temporal — init=2026-11-06T00:00, member=50
| Source | min | mean | max |
|---|---|---|---|
| P1 Validation | 0 | 0 | 0 |
| P2 Validation | 0 | 0 | 0 |
Availability — 1995 of 1995 positions complete
skin_temperature_surface
Metadata
| Field | Value |
|---|---|
| units | degree_Celsius |
| long_name | Skin temperature |
| short_name | skt |
| standard_name | surface_temperature |
| step_type | instant |
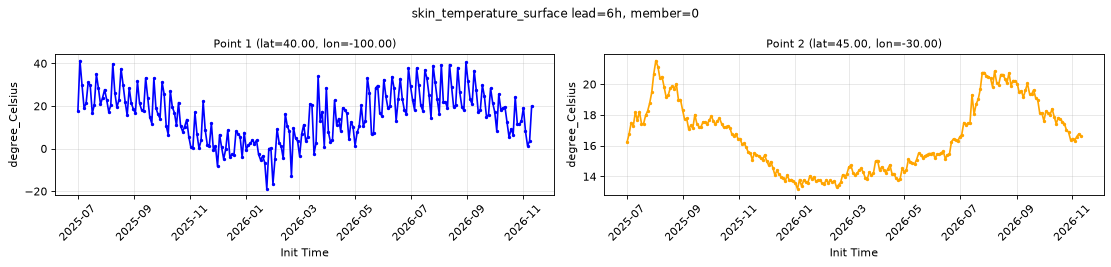
Point time series — 2025-07-01T06:00 - 2026-11-11T18:00, sampled lead=6h, member=0
| Point | min | mean | max |
|---|---|---|---|
| P1 | -18.88 | 15.63 | 41.35 |
| P2 | 13.2 | 16.59 | 21.54 |
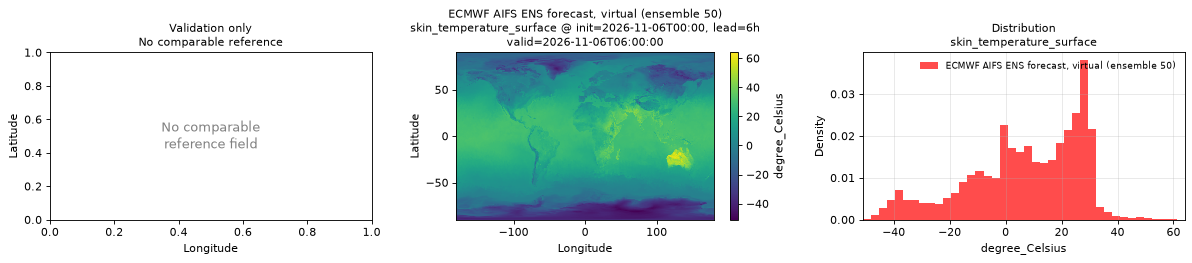
Spatial — init=2026-11-06T00:00, lead=6h, valid=2026-11-06T06:00:00, member=50 (reference not available)
| Source | min | mean | max |
|---|---|---|---|
| Validation | -51.03 | 6.742 | 63.97 |
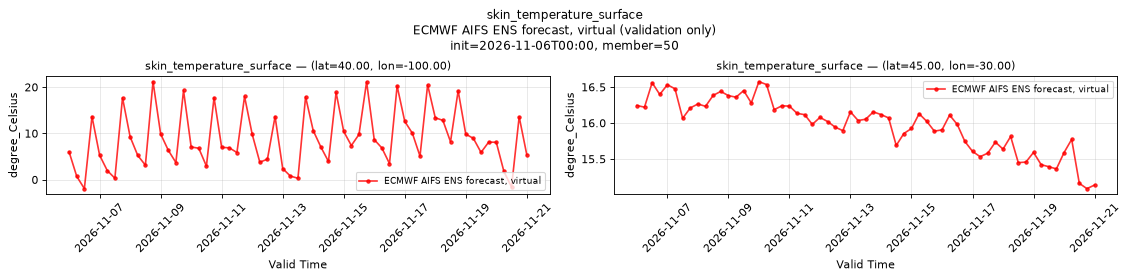
Temporal — init=2026-11-06T00:00, member=50
| Source | min | mean | max |
|---|---|---|---|
| P1 Validation | -1.939 | 8.809 | 21.19 |
| P2 Validation | 15.09 | 15.98 | 16.58 |
Availability — 1995 of 1995 positions complete
slope_of_sub_gridscale_orography_surface
Metadata
| Field | Value |
|---|---|
| units | 1 |
| long_name | Slope of sub-gridscale orography |
| short_name | slor |
| standard_name | n/a |
| step_type | instant |
| comment | Time-invariant field published at lead time 0 only. |
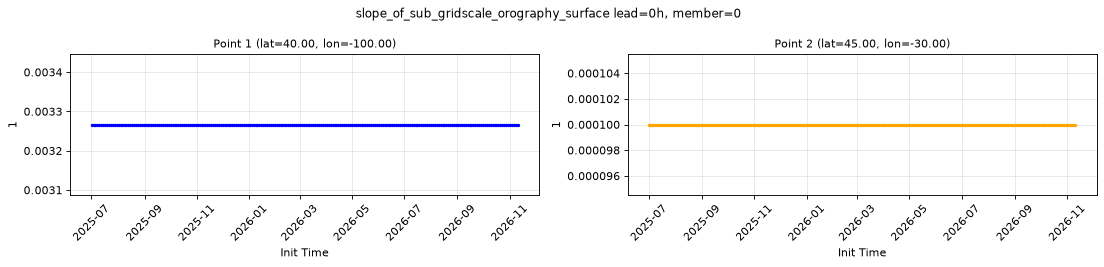
Point time series — 2025-07-01T06:00 - 2026-11-11T18:00, sampled lead=0h, member=0
| Point | min | mean | max |
|---|---|---|---|
| P1 | 0.003266 | 0.003266 | 0.003266 |
| P2 | 9.999e-05 | 9.999e-05 | 9.999e-05 |
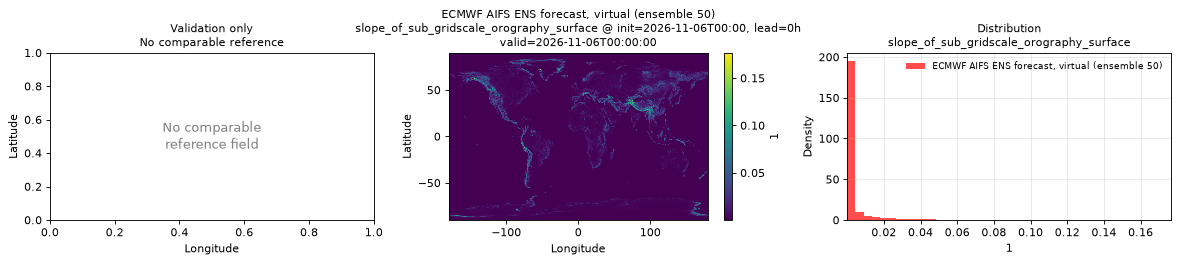
Spatial — init=2026-11-06T00:00, lead=0h, valid=2026-11-06T00:00:00, member=50 (reference not available)
| Source | min | mean | max |
|---|---|---|---|
| Validation | 9.999e-05 | 0.003153 | 0.1767 |
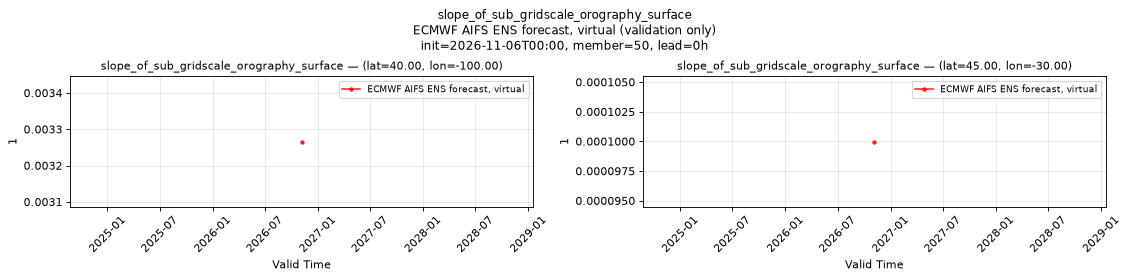
Temporal — init=2026-11-06T00:00, member=50, lead=0h
| Source | min | mean | max |
|---|---|---|---|
| P1 Validation | 0.003266 | 0.003266 | 0.003266 |
| P2 Validation | 9.999e-05 | 9.999e-05 | 9.999e-05 |
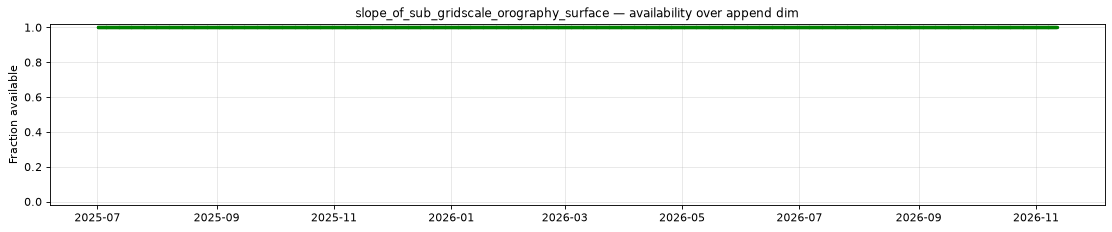
Availability — 1995 of 1995 positions complete
snow_area_fraction_surface
Metadata
| Field | Value |
|---|---|
| units | 1 |
| long_name | Snow cover |
| short_name | snowc |
| standard_name | surface_snow_area_fraction |
| step_type | instant |
| comment | Fraction (0-1) of the grid box covered by snow. Applies over land only; over water values may be NaN or finite, so mask with land_sea_mask_surface. At forecast hour 0, water values are finite and range from 0 to 1, including in polar seas. |
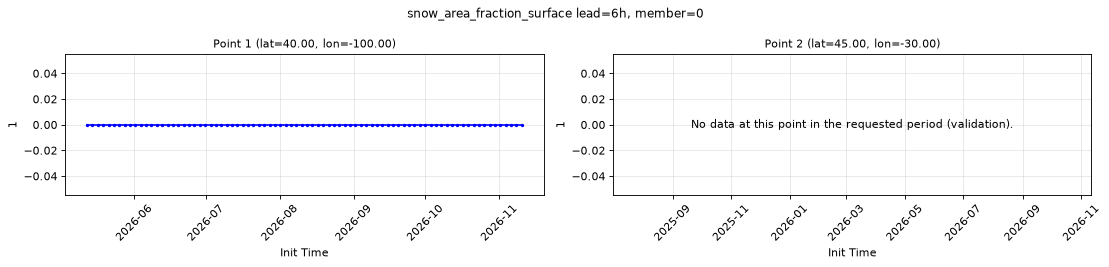
Point time series — 2025-07-01T06:00 - 2026-11-11T18:00, sampled lead=6h, member=0
| Point | min | mean | max |
|---|---|---|---|
| P1 | 0 | 0 | 0 |
| P2 | n/a | n/a | n/a |
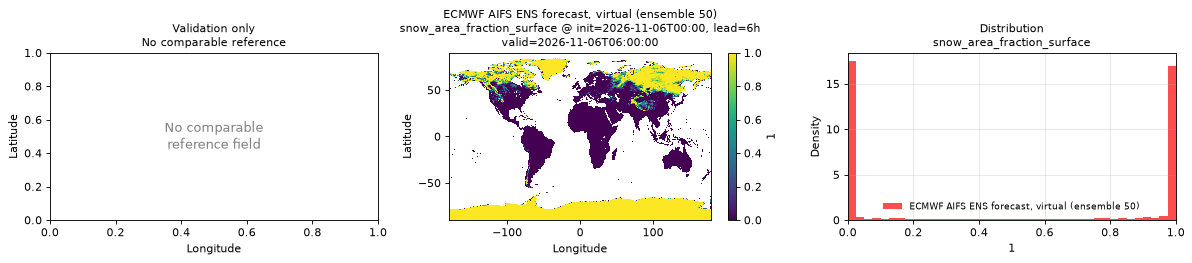
Spatial — init=2026-11-06T00:00, lead=6h, valid=2026-11-06T06:00:00, member=50 (reference not available)
| Source | min | mean | max |
|---|---|---|---|
| Validation | 0 | 0.4961 | 1 |
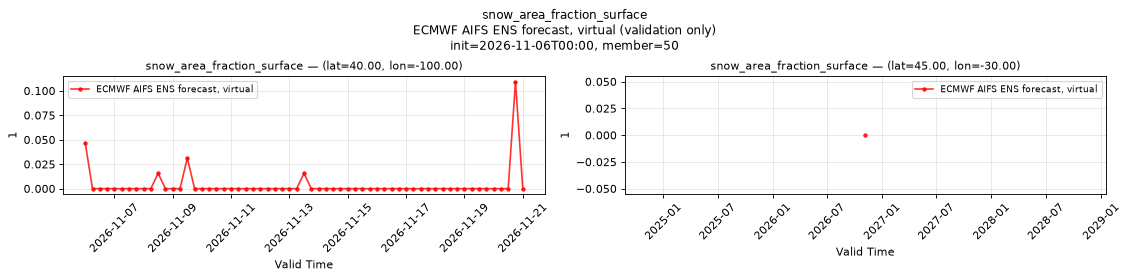
Temporal — init=2026-11-06T00:00, member=50
| Source | min | mean | max |
|---|---|---|---|
| P1 Validation | 0 | 0.003586 | 0.1094 |
| P2 Validation | 0 | 0 | 0 |
Availability — 735 of 1995 positions complete (incomplete 2025-07-01T06:00 → 2026-05-12T00:00)
snowfall_water_equivalent_run_total_surface
Metadata
| Field | Value |
|---|---|
| units | kg m-2 |
| long_name | Snowfall water equivalent |
| short_name | sf |
| standard_name | snowfall_amount |
| step_type | accum |
| comment | Accumulated since forecast initialization. |
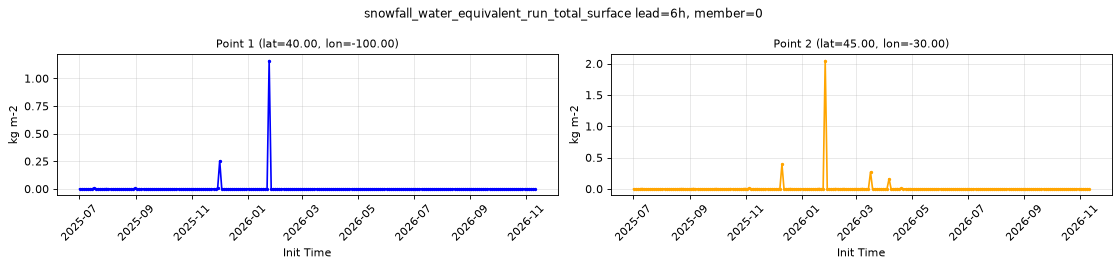
Point time series — 2025-07-01T06:00 - 2026-11-11T18:00, sampled lead=6h, member=0
| Point | min | mean | max |
|---|---|---|---|
| P1 | 0 | 0.006453 | 1.162 |
| P2 | 0 | 0.01329 | 2.049 |
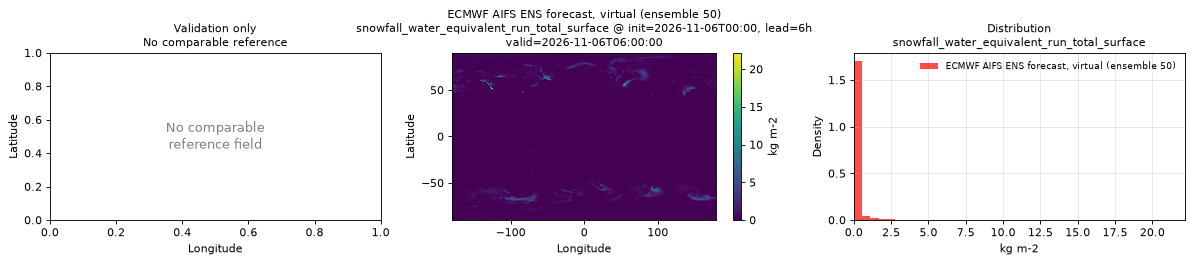
Spatial — init=2026-11-06T00:00, lead=6h, valid=2026-11-06T06:00:00, member=50 (reference not available)
| Source | min | mean | max |
|---|---|---|---|
| Validation | 0 | 0.1254 | 22.16 |
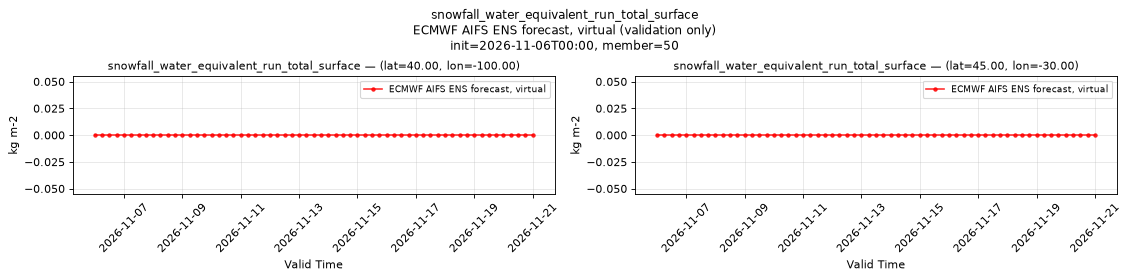
Temporal — init=2026-11-06T00:00, member=50
| Source | min | mean | max |
|---|---|---|---|
| P1 Validation | 0 | 0 | 0 |
| P2 Validation | 0 | 0 | 0 |
Availability — 1995 of 1995 positions complete
soil_temperature_layer_1
Metadata
| Field | Value |
|---|---|
| units | degree_Celsius |
| long_name | Soil temperature |
| short_name | sot |
| standard_name | soil_temperature |
| step_type | instant |
| comment | ECMWF soil level 1, the uppermost soil layer. Over water this is the sea surface temperature, not a soil temperature. |
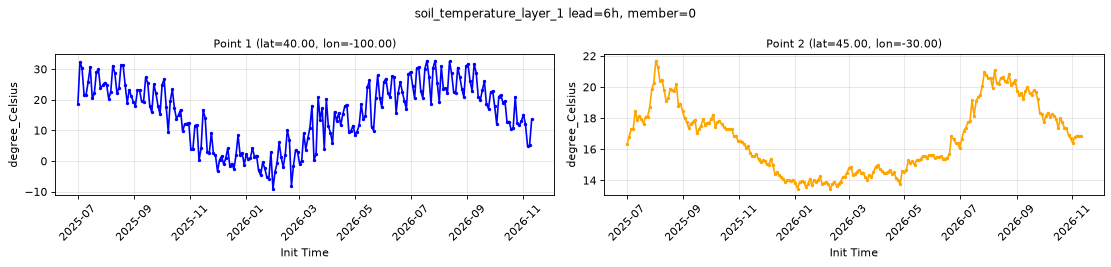
Point time series — 2025-07-01T06:00 - 2026-11-11T18:00, sampled lead=6h, member=0
| Point | min | mean | max |
|---|---|---|---|
| P1 | -9.085 | 15.5 | 32.79 |
| P2 | 13.45 | 16.72 | 21.7 |
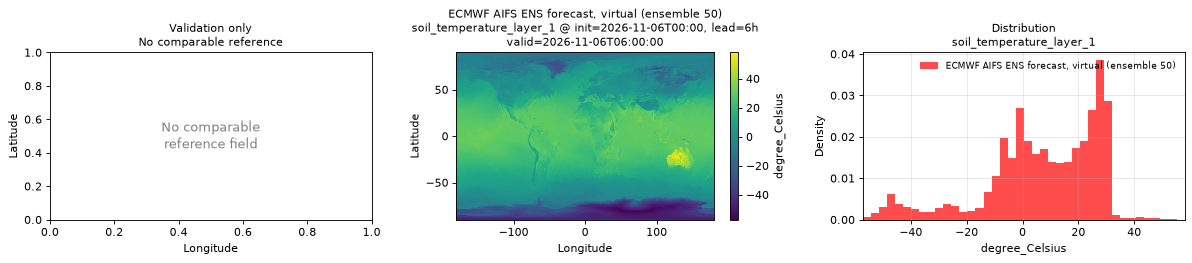
Spatial — init=2026-11-06T00:00, lead=6h, valid=2026-11-06T06:00:00, member=50 (reference not available)
| Source | min | mean | max |
|---|---|---|---|
| Validation | -57.2 | 7.028 | 58.05 |
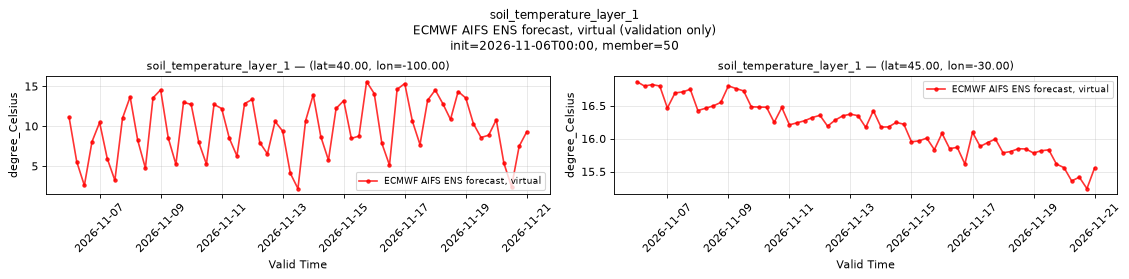
Temporal — init=2026-11-06T00:00, member=50
| Source | min | mean | max |
|---|---|---|---|
| P1 Validation | 2.171 | 9.622 | 15.58 |
| P2 Validation | 15.24 | 16.18 | 16.87 |
Availability — 1995 of 1995 positions complete
soil_temperature_layer_2
Metadata
| Field | Value |
|---|---|
| units | degree_Celsius |
| long_name | Soil temperature |
| short_name | sot |
| standard_name | soil_temperature |
| step_type | instant |
| comment | ECMWF soil level 2, the second soil layer from the surface. Over water this is the sea surface temperature, not a soil temperature. |
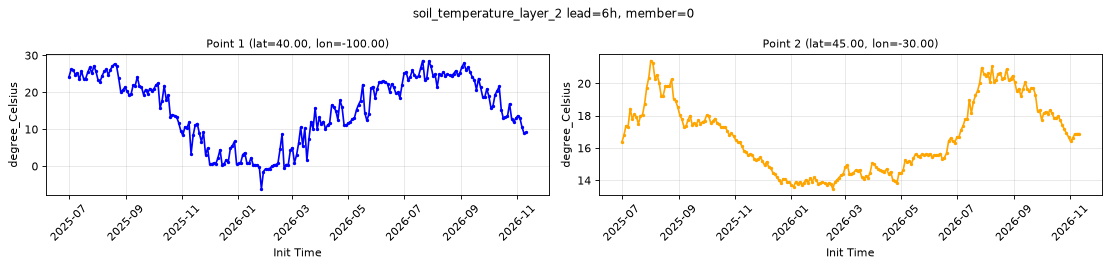
Point time series — 2025-07-01T06:00 - 2026-11-11T18:00, sampled lead=6h, member=0
| Point | min | mean | max |
|---|---|---|---|
| P1 | -6.14 | 15.45 | 28.59 |
| P2 | 13.47 | 16.73 | 21.42 |
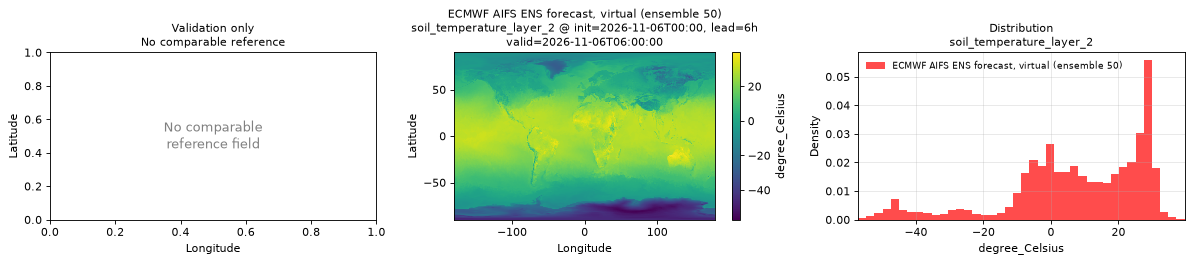
Spatial — init=2026-11-06T00:00, lead=6h, valid=2026-11-06T06:00:00, member=50 (reference not available)
| Source | min | mean | max |
|---|---|---|---|
| Validation | -57.16 | 7.375 | 39.59 |
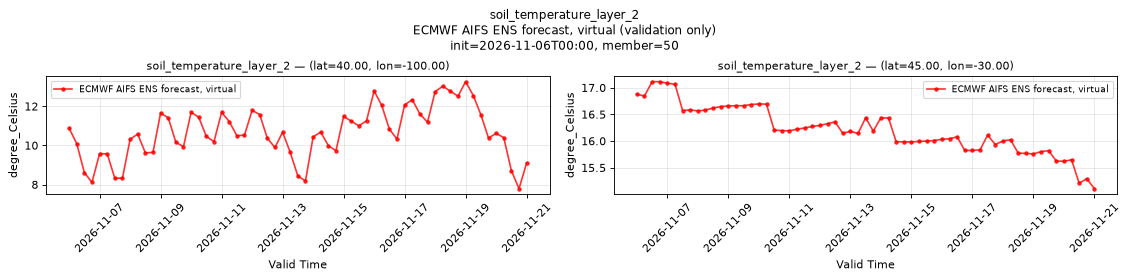
Temporal — init=2026-11-06T00:00, member=50
| Source | min | mean | max |
|---|---|---|---|
| P1 Validation | 7.792 | 10.65 | 13.26 |
| P2 Validation | 15.11 | 16.21 | 17.11 |
Availability — 1995 of 1995 positions complete
standard_deviation_of_sub_gridscale_orography_surface
Metadata
| Field | Value |
|---|---|
| units | m |
| long_name | Standard deviation of sub-gridscale orography |
| short_name | sdor |
| standard_name | n/a |
| step_type | instant |
| comment | Time-invariant field published at lead time 0 only. |
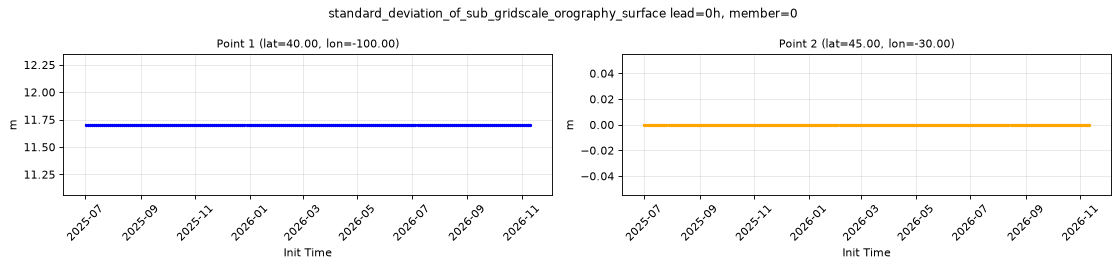
Point time series — 2025-07-01T06:00 - 2026-11-11T18:00, sampled lead=0h, member=0
| Point | min | mean | max |
|---|---|---|---|
| P1 | 11.7 | 11.7 | 11.7 |
| P2 | 0 | 0 | 0 |
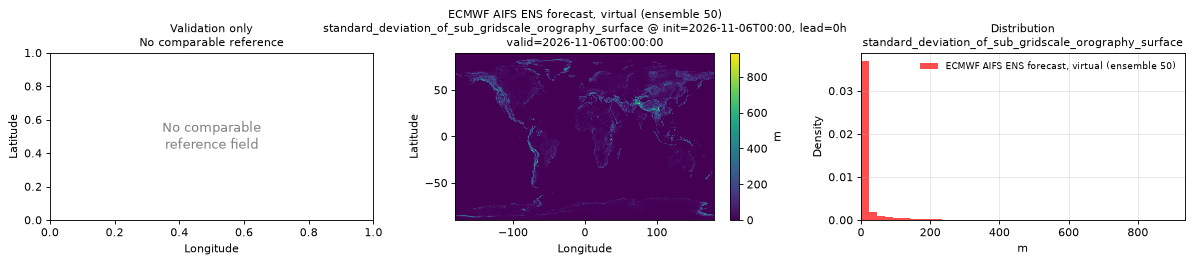
Spatial — init=2026-11-06T00:00, lead=0h, valid=2026-11-06T00:00:00, member=50 (reference not available)
| Source | min | mean | max |
|---|---|---|---|
| Validation | 0 | 15.14 | 935 |
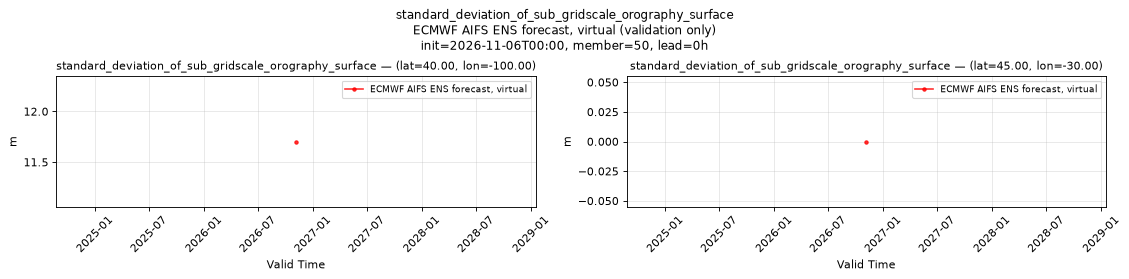
Temporal — init=2026-11-06T00:00, member=50, lead=0h
| Source | min | mean | max |
|---|---|---|---|
| P1 Validation | 11.7 | 11.7 | 11.7 |
| P2 Validation | 0 | 0 | 0 |
Availability — 1995 of 1995 positions complete
temperature_2m
Metadata
| Field | Value |
|---|---|
| units | degree_Celsius |
| long_name | 2 metre temperature |
| short_name | 2t |
| standard_name | air_temperature |
| step_type | instant |
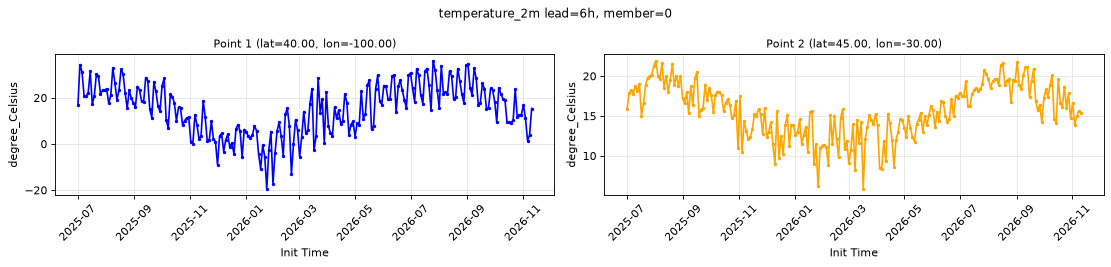
Point time series — 2025-07-01T06:00 - 2026-11-11T18:00, sampled lead=6h, member=0
| Point | min | mean | max |
|---|---|---|---|
| P1 | -19.47 | 15.12 | 36.12 |
| P2 | 5.851 | 15.67 | 21.94 |
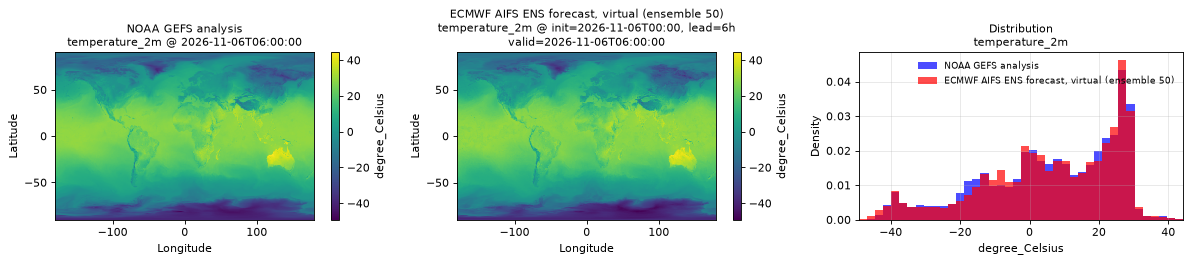
Spatial — init=2026-11-06T00:00, lead=6h, valid=2026-11-06T06:00:00, member=50 (reference at 2026-11-06T06:00:00)
| Source | min | mean | max |
|---|---|---|---|
| Validation | -49.21 | 6.083 | 44.29 |
| Reference | -48 | 5.955 | 44.25 |
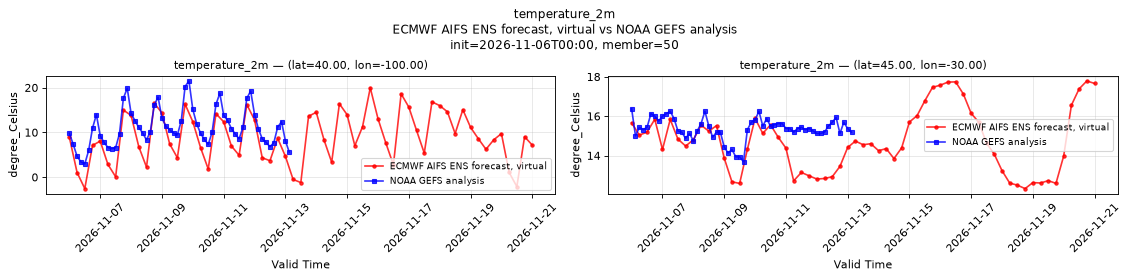
Temporal — init=2026-11-06T00:00, member=50
| Source | min | mean | max |
|---|---|---|---|
| P1 Validation | -2.555 | 8.913 | 19.96 |
| P1 Reference | 2.953 | 11.14 | 21.5 |
| P2 Validation | 12.32 | 14.74 | 17.79 |
| P2 Reference | 13.69 | 15.36 | 16.38 |
Availability — 1995 of 1995 positions complete
total_cloud_cover_atmosphere
Metadata
| Field | Value |
|---|---|
| units | percent |
| long_name | Total cloud cover |
| short_name | tcc |
| standard_name | cloud_area_fraction |
| step_type | instant |
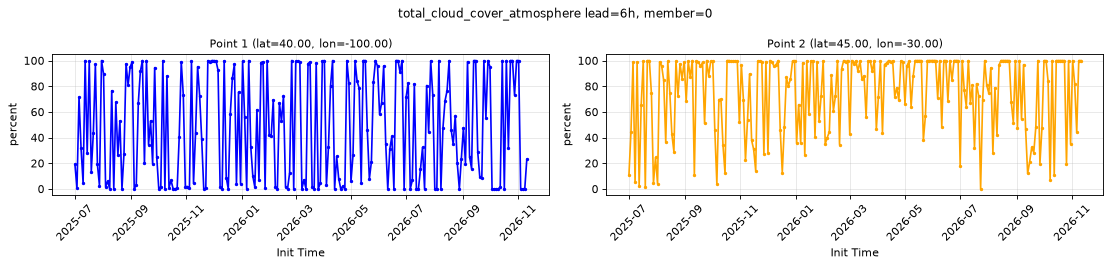
Point time series — 2025-07-01T06:00 - 2026-11-11T18:00, sampled lead=6h, member=0
| Point | min | mean | max |
|---|---|---|---|
| P1 | 0 | 46.8 | 100 |
| P2 | 0 | 74.43 | 100 |
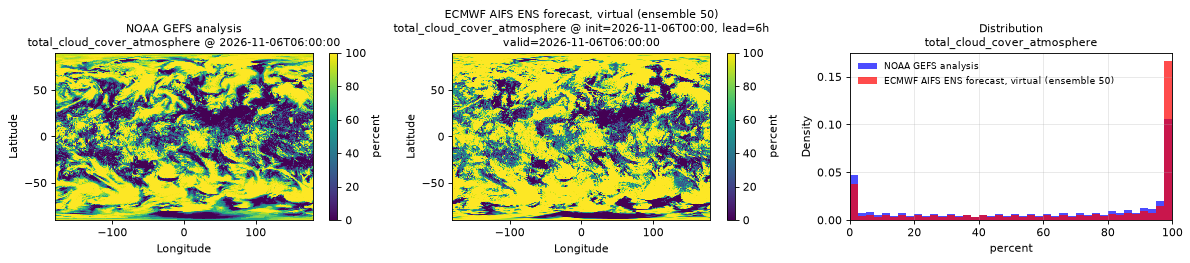
Spatial — init=2026-11-06T00:00, lead=6h, valid=2026-11-06T06:00:00, member=50 (reference at 2026-11-06T06:00:00)
| Source | min | mean | max |
|---|---|---|---|
| Validation | 0 | 68.71 | 100 |
| Reference | 0 | 60.9 | 100 |
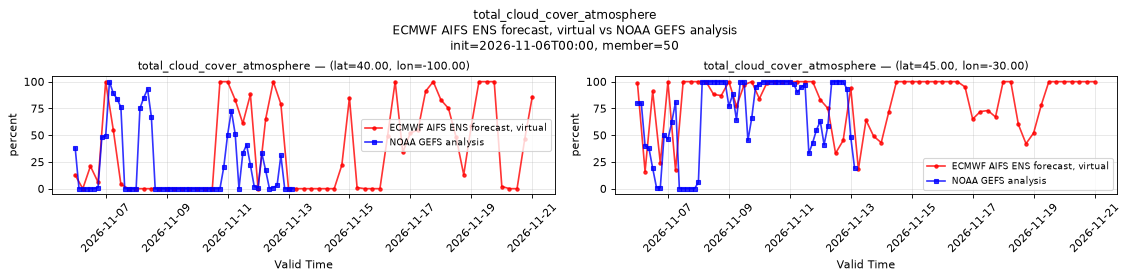
Temporal — init=2026-11-06T00:00, member=50
| Source | min | mean | max |
|---|---|---|---|
| P1 Validation | 0 | 35.66 | 100 |
| P1 Reference | 0 | 20.4 | 100 |
| P2 Validation | 16 | 82.93 | 100 |
| P2 Reference | 0 | 68.47 | 100 |
Availability — 1995 of 1995 positions complete
total_column_water_atmosphere
Metadata
| Field | Value |
|---|---|
| units | kg m-2 |
| long_name | Total column water |
| short_name | tcw |
| standard_name | atmosphere_mass_content_of_water |
| step_type | instant |
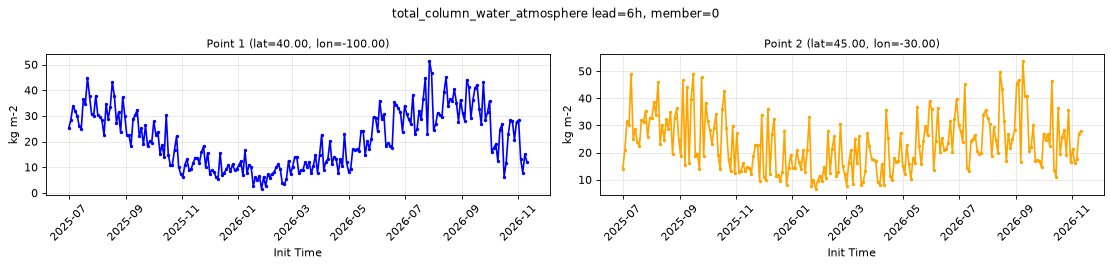
Point time series — 2025-07-01T06:00 - 2026-11-11T18:00, sampled lead=6h, member=0
| Point | min | mean | max |
|---|---|---|---|
| P1 | 1.544 | 20.9 | 51.53 |
| P2 | 6.606 | 23.36 | 53.88 |
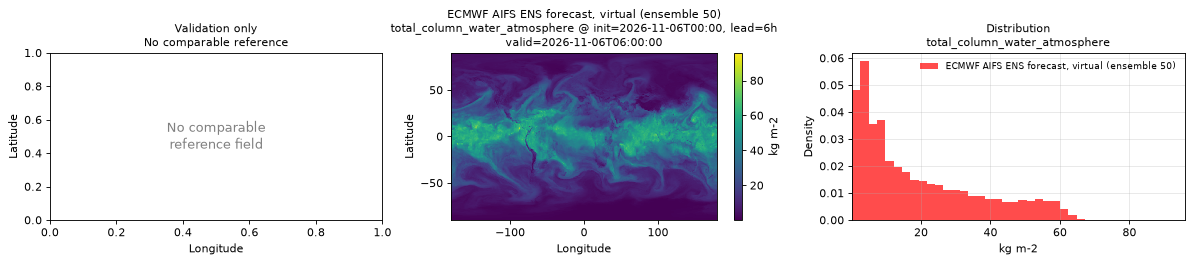
Spatial — init=2026-11-06T00:00, lead=6h, valid=2026-11-06T06:00:00, member=50 (reference not available)
| Source | min | mean | max |
|---|---|---|---|
| Validation | 0.1331 | 19.25 | 95.88 |
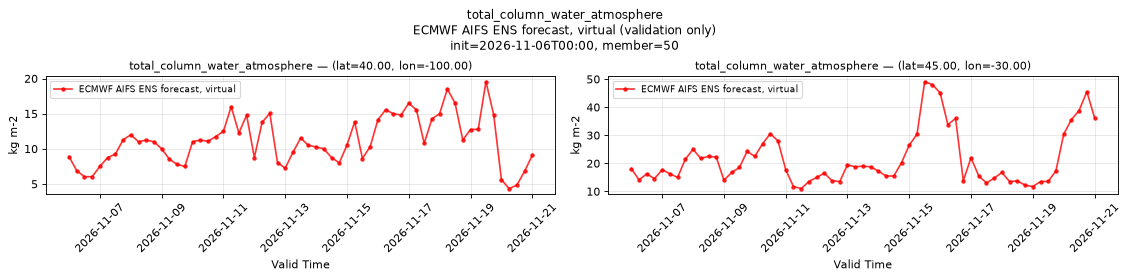
Temporal — init=2026-11-06T00:00, member=50
| Source | min | mean | max |
|---|---|---|---|
| P1 Validation | 4.331 | 11.1 | 19.56 |
| P2 Validation | 11 | 21.5 | 49.12 |
Availability — 1995 of 1995 positions complete
total_precipitation_run_total_surface
Metadata
| Field | Value |
|---|---|
| units | kg m-2 |
| long_name | Total precipitation |
| short_name | tp |
| standard_name | precipitation_amount |
| step_type | accum |
| comment | Accumulated since forecast initialization. |
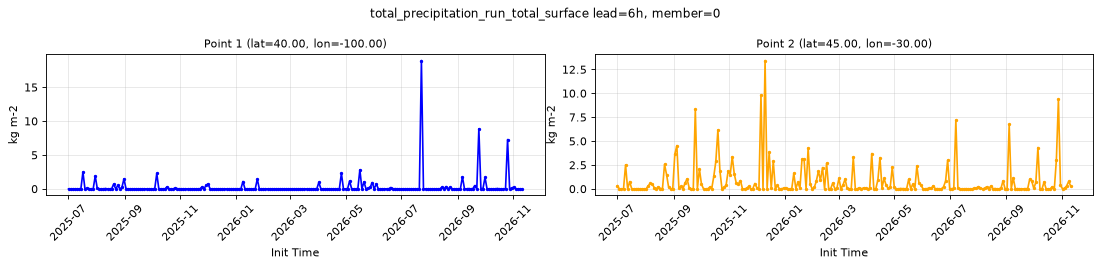
Point time series — 2025-07-01T06:00 - 2026-11-11T18:00, sampled lead=6h, member=0
| Point | min | mean | max |
|---|---|---|---|
| P1 | 0 | 0.294 | 18.94 |
| P2 | 0 | 0.7914 | 13.43 |
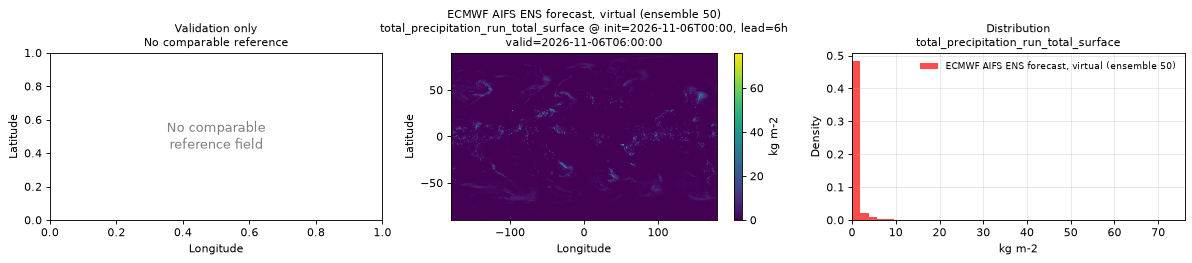
Spatial — init=2026-11-06T00:00, lead=6h, valid=2026-11-06T06:00:00, member=50 (reference not available)
| Source | min | mean | max |
|---|---|---|---|
| Validation | 0 | 0.6081 | 76.03 |
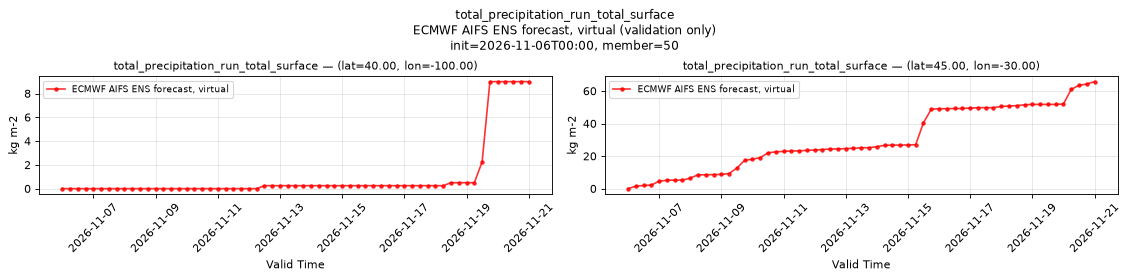
Temporal — init=2026-11-06T00:00, member=50
| Source | min | mean | max |
|---|---|---|---|
| P1 Validation | 0 | 1.053 | 9 |
| P2 Validation | 0 | 30.13 | 65.75 |
Availability — 1995 of 1995 positions complete
volumetric_soil_moisture_layer_1
Metadata
| Field | Value |
|---|---|
| units | 1 |
| long_name | Volumetric soil moisture |
| short_name | vsw |
| standard_name | volume_fraction_of_condensed_water_in_soil |
| step_type | instant |
| comment | ECMWF soil level 1, the uppermost soil layer. Applies over land only; over water values may be NaN or finite, so mask with land_sea_mask_surface. |
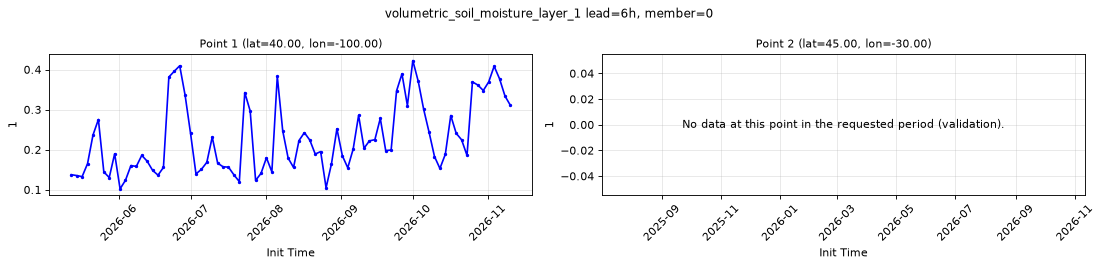
Point time series — 2025-07-01T06:00 - 2026-11-11T18:00, sampled lead=6h, member=0
| Point | min | mean | max |
|---|---|---|---|
| P1 | 0.1021 | 0.2285 | 0.4224 |
| P2 | n/a | n/a | n/a |
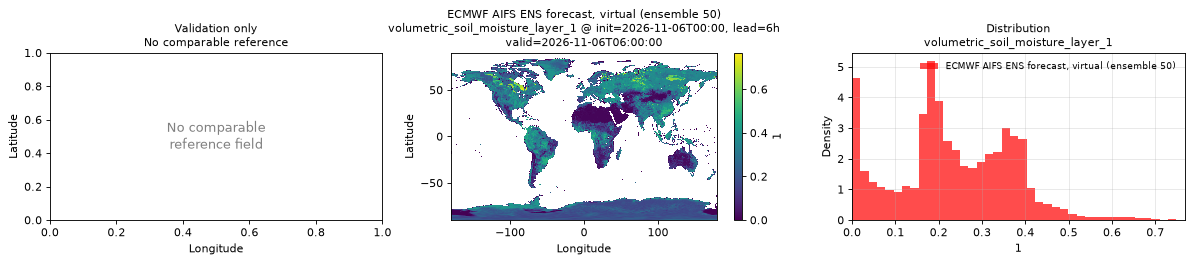
Spatial — init=2026-11-06T00:00, lead=6h, valid=2026-11-06T06:00:00, member=50 (reference not available)
| Source | min | mean | max |
|---|---|---|---|
| Validation | 0 | 0.2315 | 0.7676 |
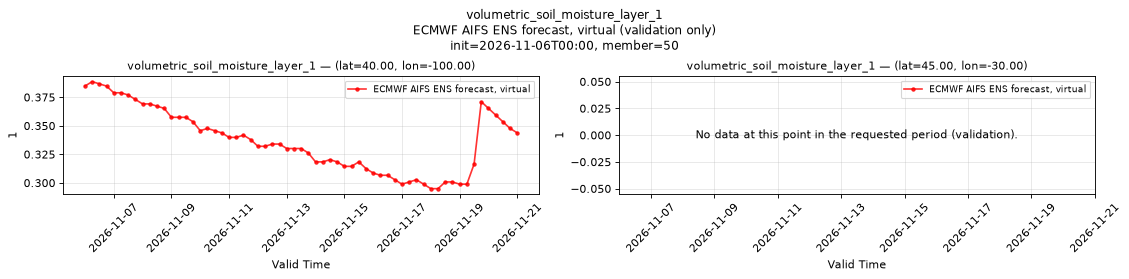
Temporal — init=2026-11-06T00:00, member=50
| Source | min | mean | max |
|---|---|---|---|
| P1 Validation | 0.2949 | 0.3368 | 0.3887 |
| P2 Validation | n/a | n/a | n/a |
Availability — 735 of 1995 positions complete (incomplete 2025-07-01T06:00 → 2026-05-12T00:00)
volumetric_soil_moisture_layer_2
Metadata
| Field | Value |
|---|---|
| units | 1 |
| long_name | Volumetric soil moisture |
| short_name | vsw |
| standard_name | volume_fraction_of_condensed_water_in_soil |
| step_type | instant |
| comment | ECMWF soil level 2, the second soil layer from the surface. Applies over land only; over water values may be NaN or finite, so mask with land_sea_mask_surface. |
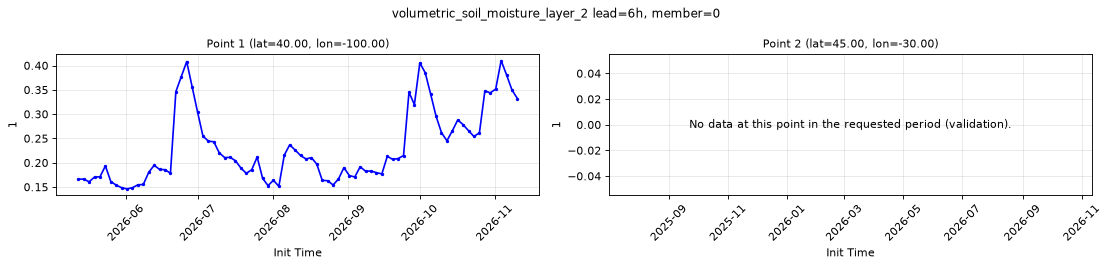
Point time series — 2025-07-01T06:00 - 2026-11-11T18:00, sampled lead=6h, member=0
| Point | min | mean | max |
|---|---|---|---|
| P1 | 0.1461 | 0.2314 | 0.4102 |
| P2 | n/a | n/a | n/a |
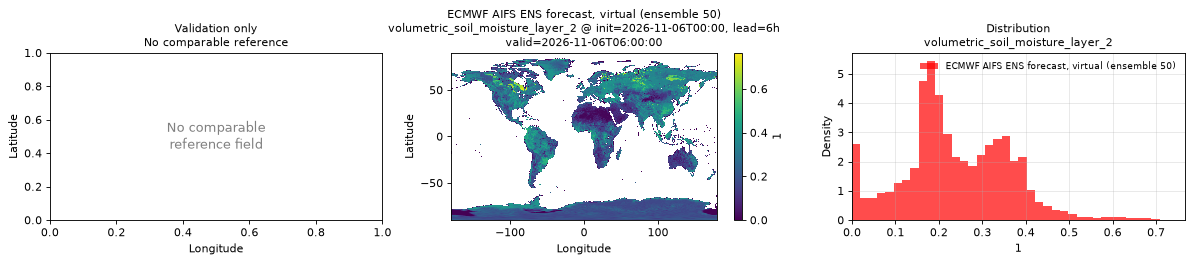
Spatial — init=2026-11-06T00:00, lead=6h, valid=2026-11-06T06:00:00, member=50 (reference not available)
| Source | min | mean | max |
|---|---|---|---|
| Validation | 0 | 0.2375 | 0.7656 |
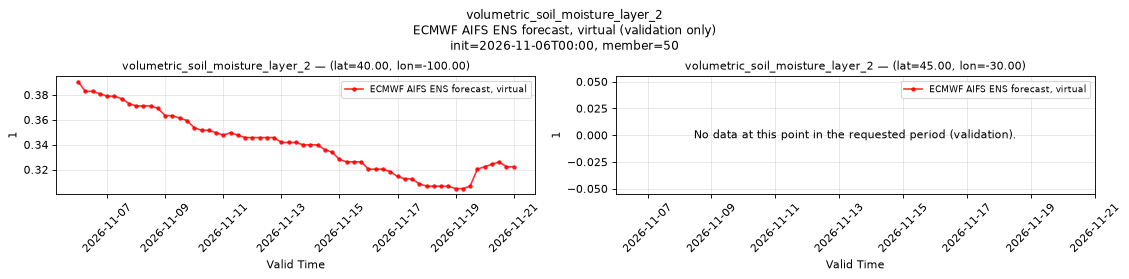
Temporal — init=2026-11-06T00:00, member=50
| Source | min | mean | max |
|---|---|---|---|
| P1 Validation | 0.3047 | 0.3407 | 0.3906 |
| P2 Validation | n/a | n/a | n/a |
Availability — 735 of 1995 positions complete (incomplete 2025-07-01T06:00 → 2026-05-12T00:00)
wind_u_100m
Metadata
| Field | Value |
|---|---|
| units | m s-1 |
| long_name | 100 metre U wind component |
| short_name | 100u |
| standard_name | eastward_wind |
| step_type | instant |
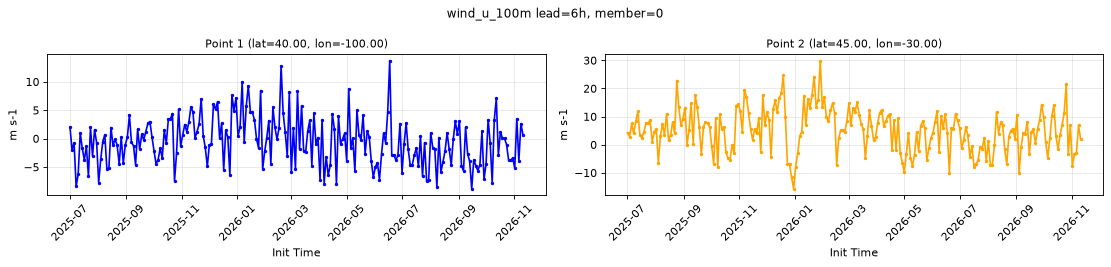
Point time series — 2025-07-01T06:00 - 2026-11-11T18:00, sampled lead=6h, member=0
| Point | min | mean | max |
|---|---|---|---|
| P1 | -8.855 | -0.5151 | 13.73 |
| P2 | -15.72 | 5.12 | 29.93 |
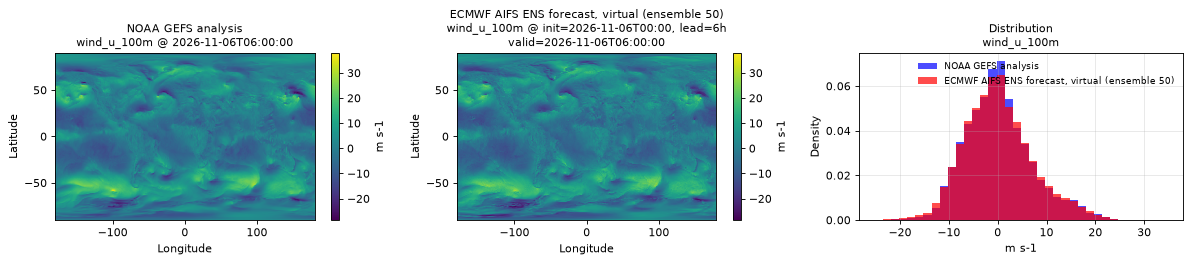
Spatial — init=2026-11-06T00:00, lead=6h, valid=2026-11-06T06:00:00, member=50 (reference at 2026-11-06T06:00:00)
| Source | min | mean | max |
|---|---|---|---|
| Validation | -27.19 | 0.1832 | 30.69 |
| Reference | -28.5 | 0.2503 | 38 |
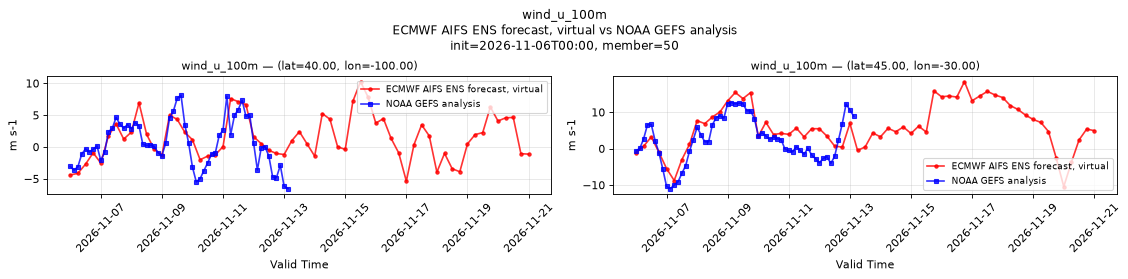
Temporal — init=2026-11-06T00:00, member=50
| Source | min | mean | max |
|---|---|---|---|
| P1 Validation | -5.383 | 1.399 | 10.26 |
| P1 Reference | -6.562 | 0.5923 | 8.125 |
| P2 Validation | -10.43 | 5.992 | 18.4 |
| P2 Reference | -11 | 2.38 | 12.62 |
Availability — 1995 of 1995 positions complete
wind_u_10m
Metadata
| Field | Value |
|---|---|
| units | m s-1 |
| long_name | 10 metre U wind component |
| short_name | 10u |
| standard_name | eastward_wind |
| step_type | instant |
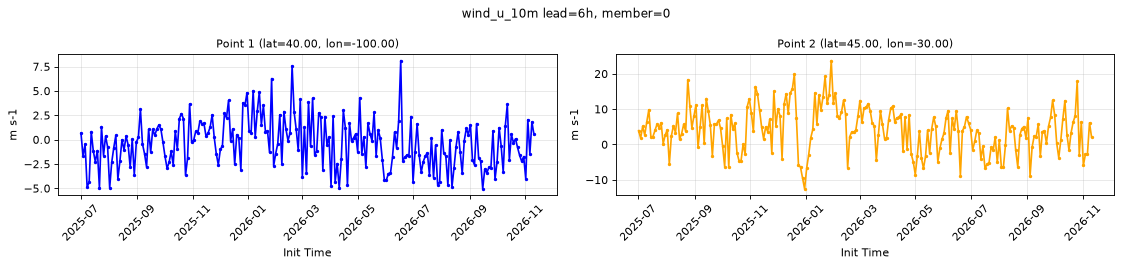
Point time series — 2025-07-01T06:00 - 2026-11-11T18:00, sampled lead=6h, member=0
| Point | min | mean | max |
|---|---|---|---|
| P1 | -5.055 | -0.3904 | 8.112 |
| P2 | -12.56 | 4.09 | 23.73 |
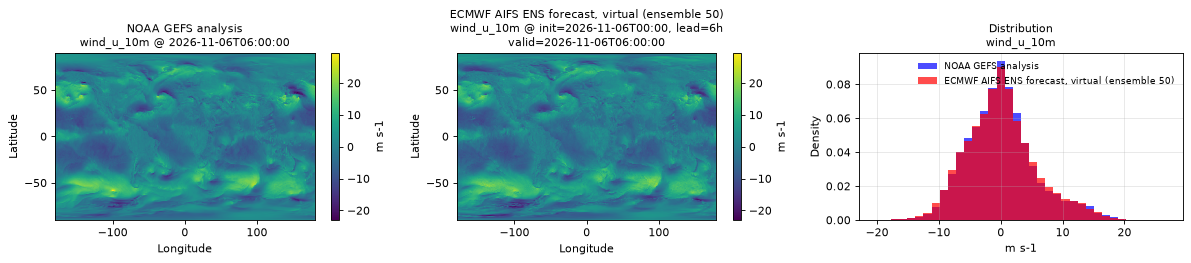
Spatial — init=2026-11-06T00:00, lead=6h, valid=2026-11-06T06:00:00, member=50 (reference at 2026-11-06T06:00:00)
| Source | min | mean | max |
|---|---|---|---|
| Validation | -21.03 | 0.09175 | 23.04 |
| Reference | -23 | 0.1263 | 29.5 |
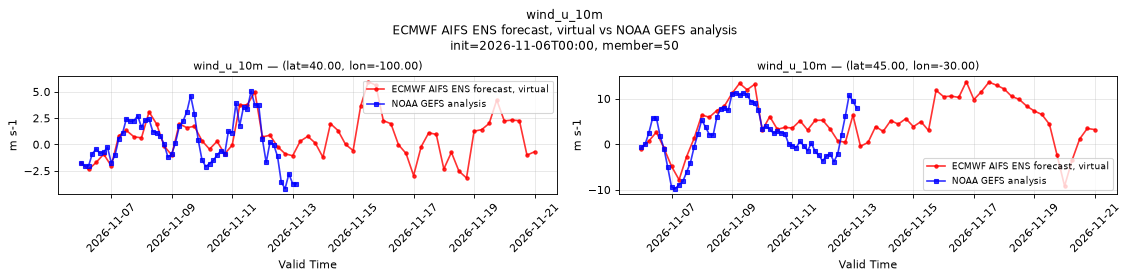
Temporal — init=2026-11-06T00:00, member=50
| Source | min | mean | max |
|---|---|---|---|
| P1 Validation | -3.175 | 0.6618 | 5.956 |
| P1 Reference | -4.188 | 0.3459 | 5.062 |
| P2 Validation | -9.176 | 5.001 | 13.74 |
| P2 Reference | -9.75 | 2.155 | 11.25 |
Availability — 1995 of 1995 positions complete
wind_v_100m
Metadata
| Field | Value |
|---|---|
| units | m s-1 |
| long_name | 100 metre V wind component |
| short_name | 100v |
| standard_name | northward_wind |
| step_type | instant |
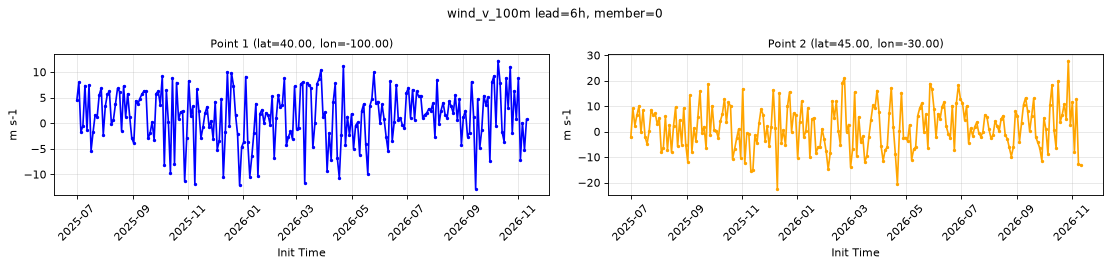
Point time series — 2025-07-01T06:00 - 2026-11-11T18:00, sampled lead=6h, member=0
| Point | min | mean | max |
|---|---|---|---|
| P1 | -12.85 | 1.348 | 12.24 |
| P2 | -22.48 | 1.841 | 27.91 |
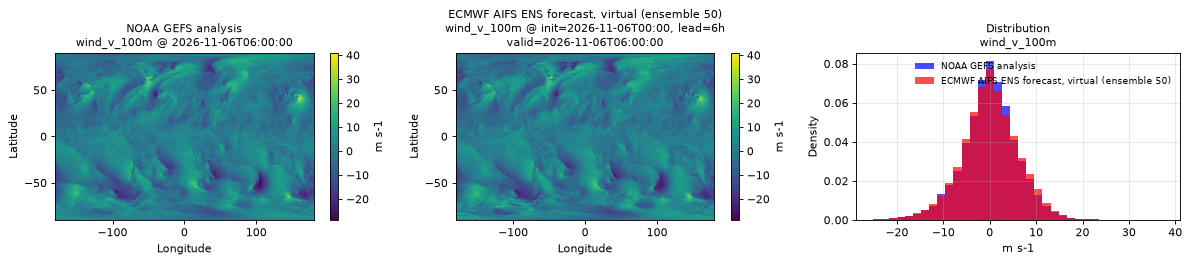
Spatial — init=2026-11-06T00:00, lead=6h, valid=2026-11-06T06:00:00, member=50 (reference at 2026-11-06T06:00:00)
| Source | min | mean | max |
|---|---|---|---|
| Validation | -27.71 | 0.0794 | 31.51 |
| Reference | -28.75 | 0.0411 | 41 |
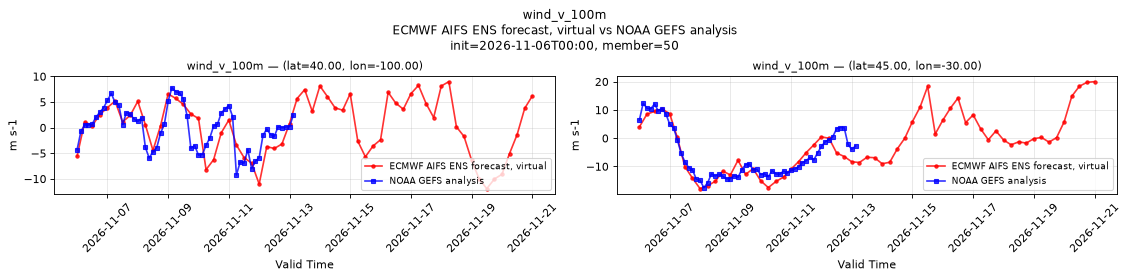
Temporal — init=2026-11-06T00:00, member=50
| Source | min | mean | max |
|---|---|---|---|
| P1 Validation | -11.91 | 0.3474 | 8.984 |
| P1 Reference | -9.25 | -0.09359 | 7.812 |
| P2 Validation | -17.84 | -1.325 | 20.02 |
| P2 Reference | -17.5 | -5.847 | 12.38 |
Availability — 1995 of 1995 positions complete
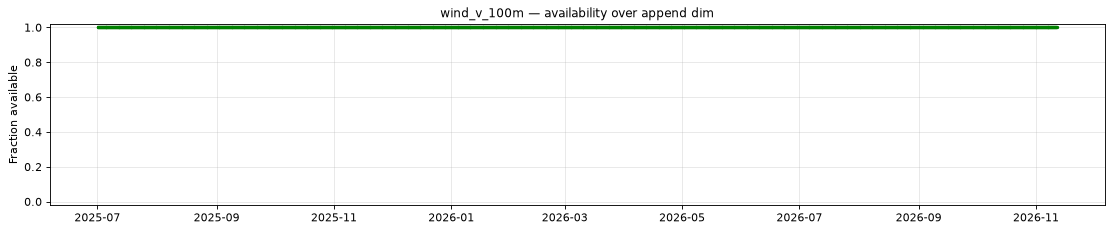
wind_v_10m
Metadata
| Field | Value |
|---|---|
| units | m s-1 |
| long_name | 10 metre V wind component |
| short_name | 10v |
| standard_name | northward_wind |
| step_type | instant |
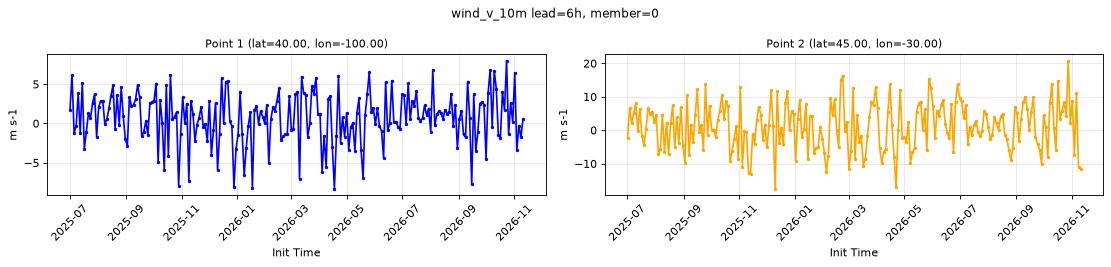
Point time series — 2025-07-01T06:00 - 2026-11-11T18:00, sampled lead=6h, member=0
| Point | min | mean | max |
|---|---|---|---|
| P1 | -8.329 | 0.6941 | 7.996 |
| P2 | -17.53 | 1.237 | 20.83 |
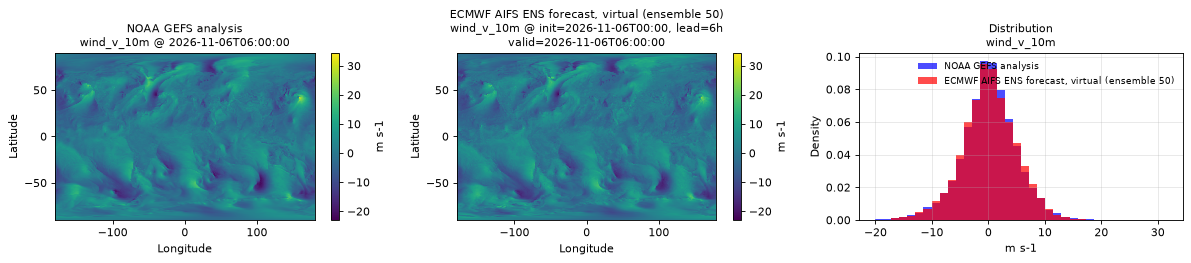
Spatial — init=2026-11-06T00:00, lead=6h, valid=2026-11-06T06:00:00, member=50 (reference at 2026-11-06T06:00:00)
| Source | min | mean | max |
|---|---|---|---|
| Validation | -22.36 | 0.1305 | 27.04 |
| Reference | -23 | 0.09993 | 34.5 |
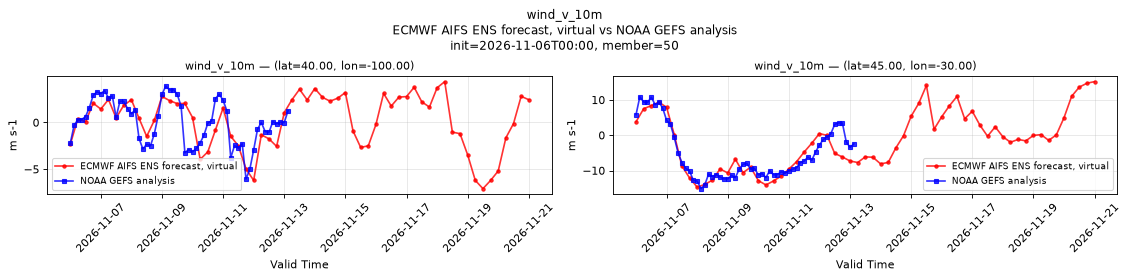
Temporal — init=2026-11-06T00:00, member=50
| Source | min | mean | max |
|---|---|---|---|
| P1 Validation | -7.096 | 0.1178 | 4.376 |
| P1 Reference | -6.062 | 0.05029 | 3.906 |
| P2 Validation | -14.7 | -1.333 | 15.16 |
| P2 Reference | -15.12 | -5.156 | 10.88 |
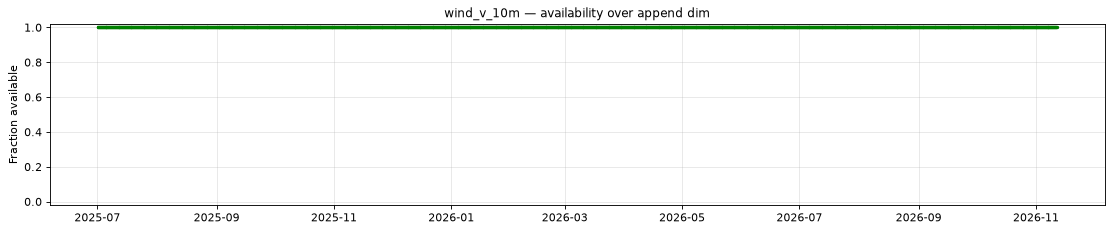
Availability — 1995 of 1995 positions complete