ECCC HRDPS forecast validation report
This dataset validation report plots a sample of values from the ECCC HRDPS forecast dataset over time and across space, comparing where possible to a previously validated reference dataset. It also reports the quantity of unavailable values and their associated timestamps. These analyses are one layer of a multi-layered dataset validation process we perform at dynamical.org and also provide users a preview of the dataset contents.
Report generation start time: 2026-08-25T16:48:45 UTC
Summary
This dataset has been reviewed and is ready for use. One variable needs care before use: convective available potential energy encodes missing data as negative numbers — see the note below.
What looks good
- Every forecast is present, with no gaps in any variable anywhere in the archive.
- Values match the source forecast files published by Environment and Climate Change Canada, including the three quantities we transform before storing: precipitation, converted from hourly accumulation to a per-step rate, downward shortwave radiation, converted from a running total to per-step rates, and snow water equivalent, converted to metres.
- Wind direction is measured clockwise from true north, not from the north of the model's rotated grid. Confirmed by deriving the direction from the source's separate east–west and north–south wind components at points across the domain; wind speed likewise matches those components.
- The grid is correctly georeferenced. The coldest August temperatures in the domain and its deepest snow water equivalent both fall on the St. Elias icefields of southwest Yukon, where they belong.
- Daily cycles are correctly timed. Temperature, downward shortwave radiation and convective available potential energy each peak at the expected local hour, in step with the reference dataset.
- Related variables agree with one another. Every grid cell flagged as rain carries a nonzero precipitation rate, cloud cover and shortwave radiation vary inversely, and the precipitation type field contains only its documented codes.
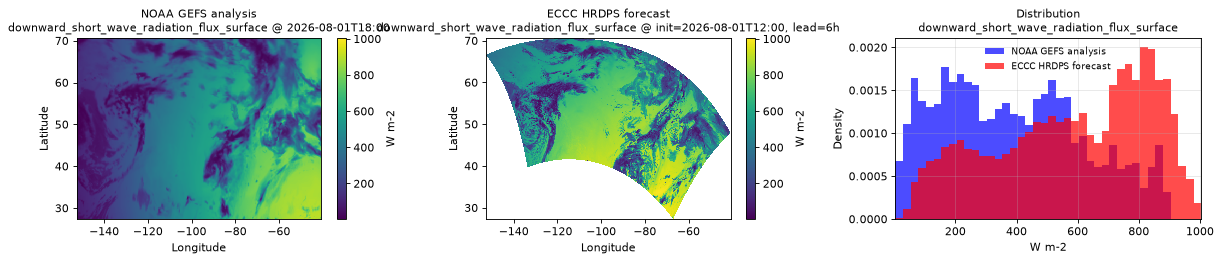
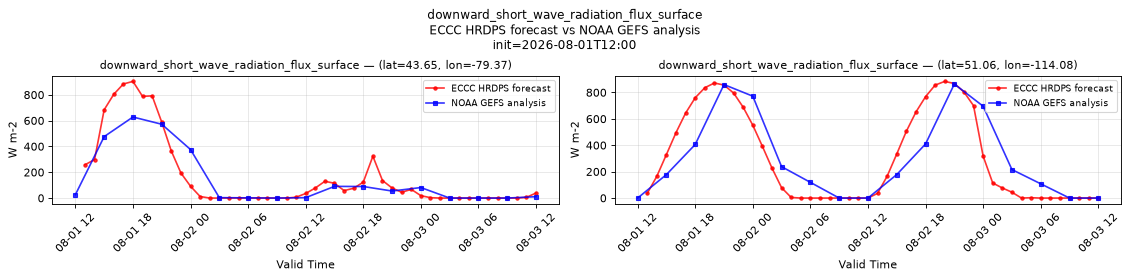
- Downward shortwave radiation is higher than the reference dataset because the two measure different windows — this archive reports an average over each forecast hour, while the reference reports a six-hour average. Under matched clear skies this dataset transmits 77% of the radiation arriving at the top of the atmosphere, the physically expected fraction, and no value anywhere exceeds that ceiling.
Review notes
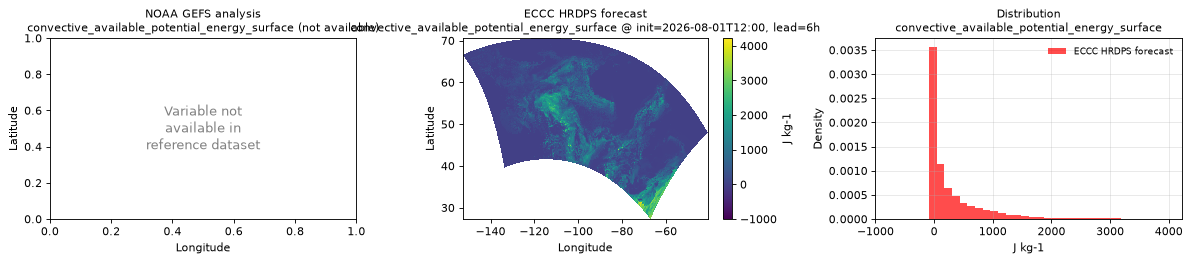
- Convective available potential energy uses negative values as missing-data markers rather than energies — mask all values below −0.1 before use. The source uses two no data values; masking all values < -0.1 leaves only usable data.
Datasets
| Role | Name | ID | Version | URL |
|---|---|---|---|---|
| Validation | ECCC HRDPS forecast | eccc-hrdps-forecast |
v0.1.0 |
s3://dynamical-eccc-hrdps/eccc-hrdps-forecast/v0.1.0.icechunk |
| Reference | NOAA GEFS analysis | noaa-gefs-analysis |
0.1.2 |
s3://dynamical-noaa-gefs/noaa-gefs-analysis/v0.1.2.icechunk/ |
Run parameters
| Parameter | Value |
|---|---|
| Validation dataset type | forecast |
| Validation time range | init_time 2026-07-09T00:00 → 2026-08-25T12:00 |
| Reference time range | time 2000-01-01T00:00 → 2026-08-25T12:00 |
| Point 1 | lat=43.6457, lon=-79.3680 |
| Point 2 | lat=51.0573, lon=-114.0771 |
| Spatial comparison time | init=2026-08-01T12:00, lead=6h (reference at 2026-08-01T18:00) |
| Timeseries period | init=2026-08-01T12:00 |
Availability
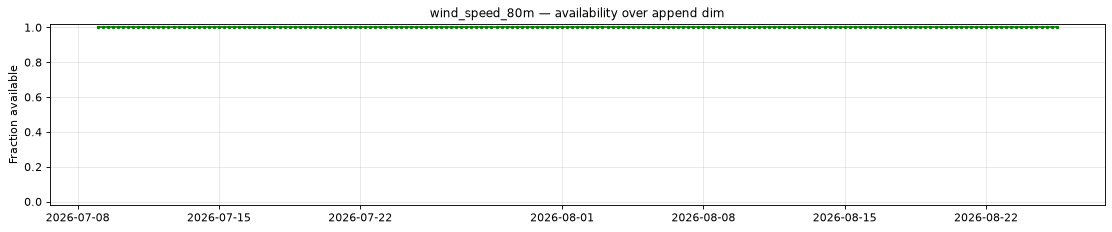
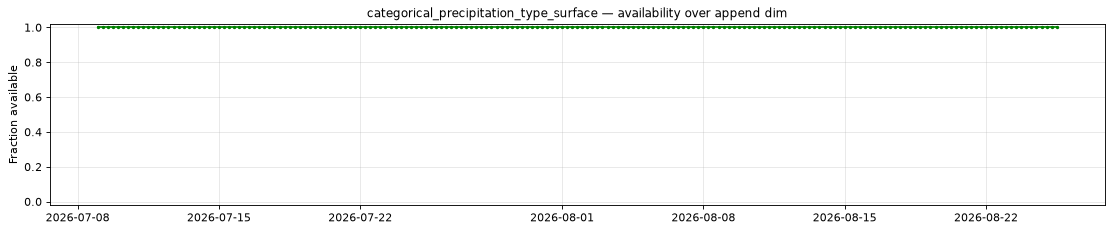
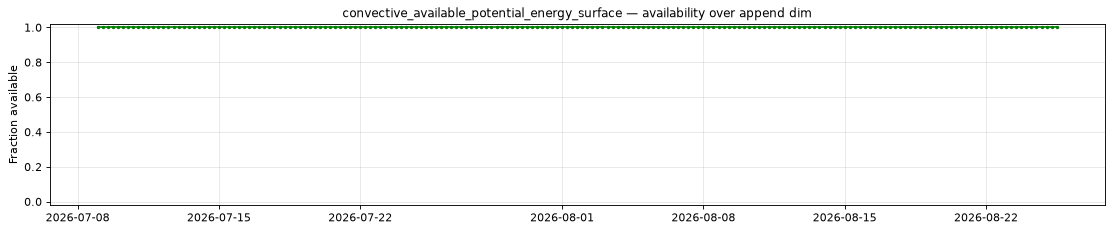
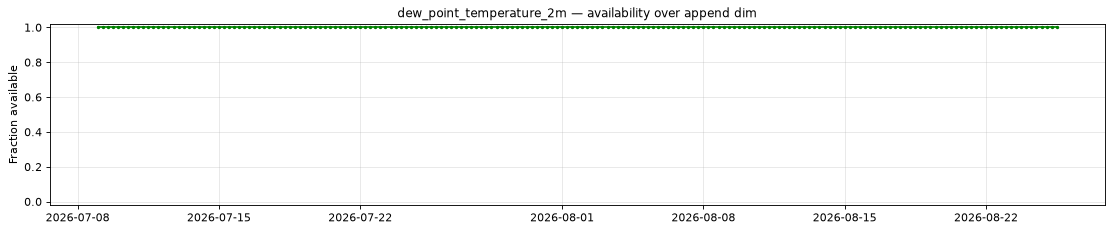
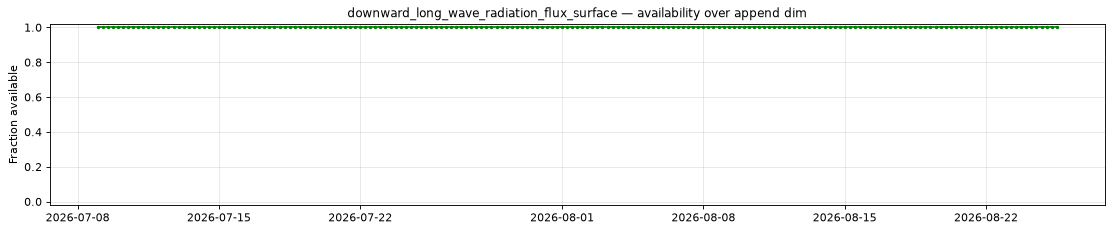
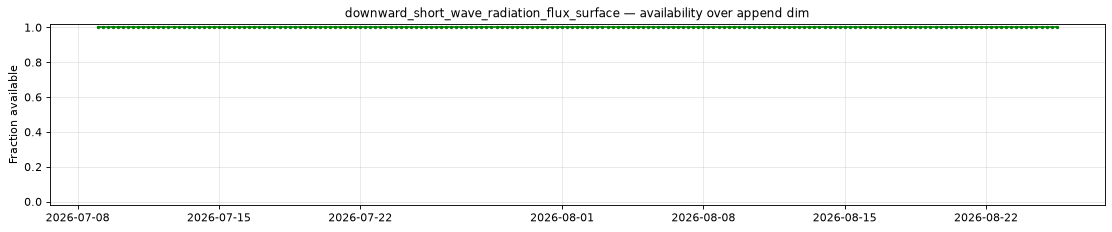
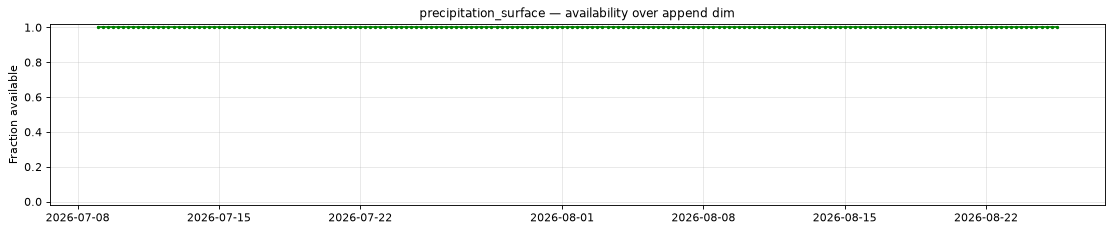
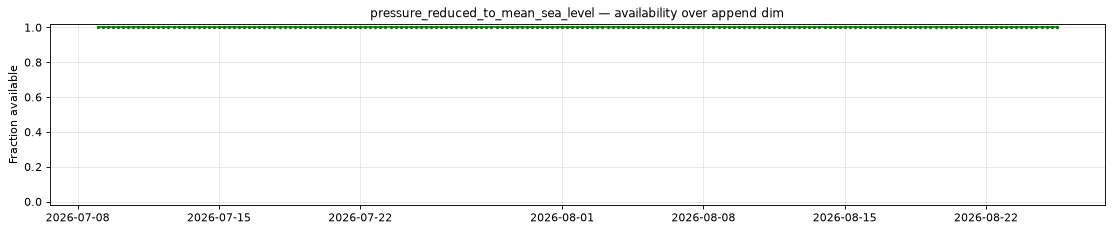
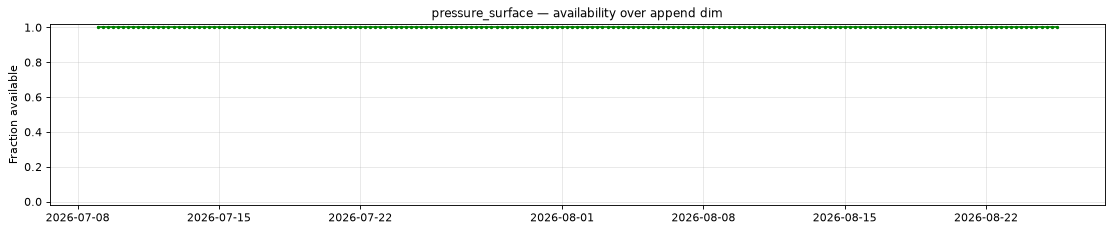
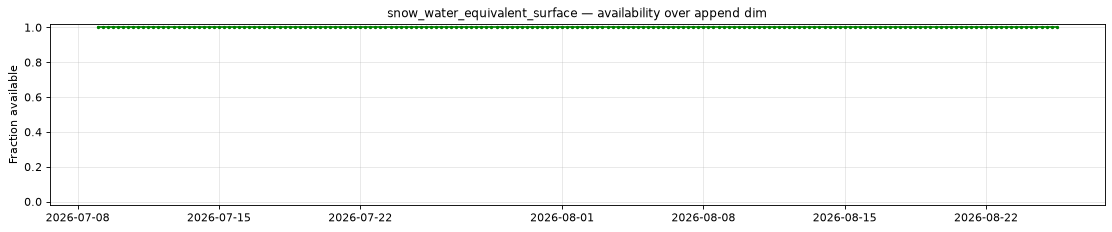
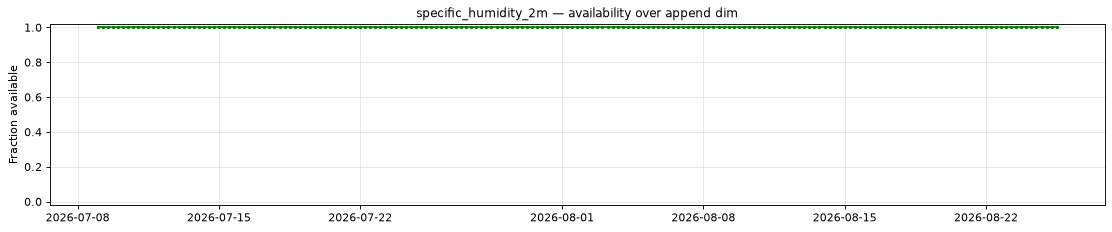
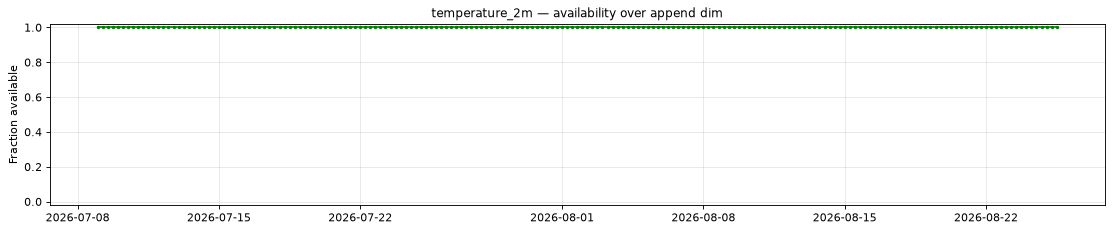
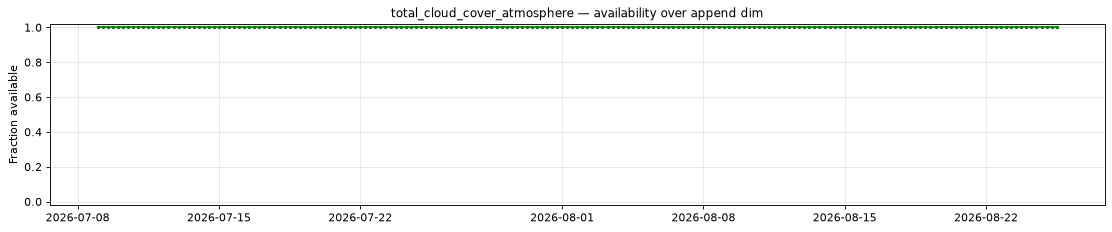
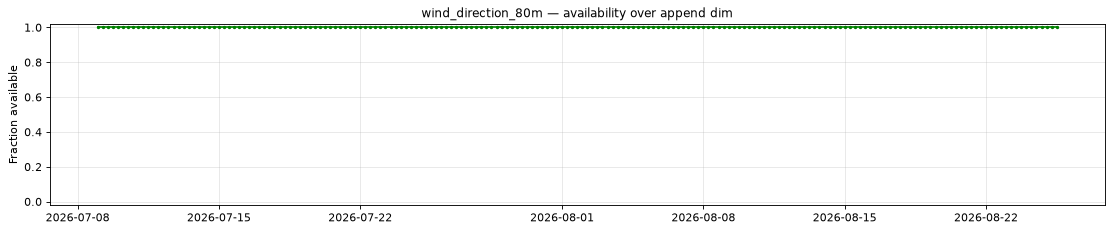
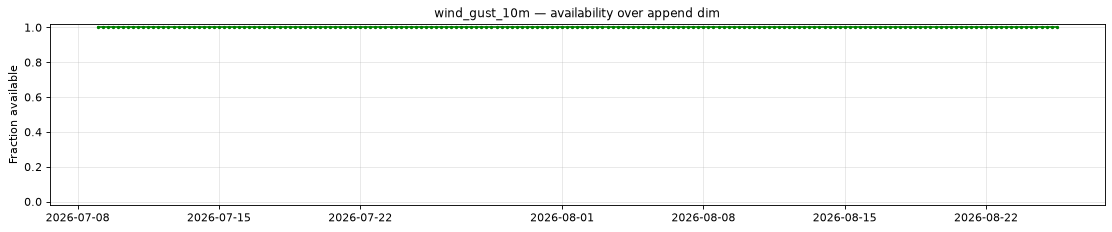
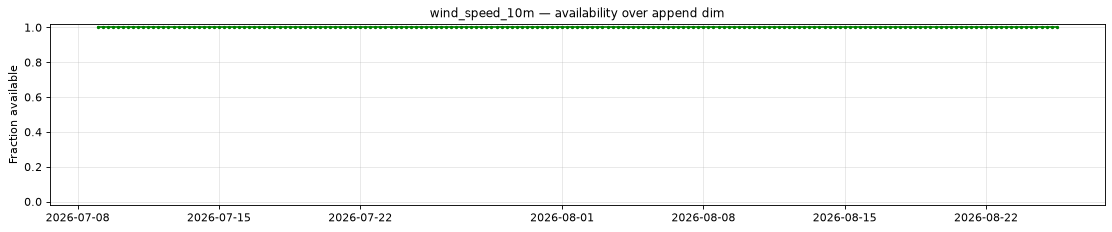
The plot below shows the availability of each variable over time — light red marks unavailable data, dark green marks present data.
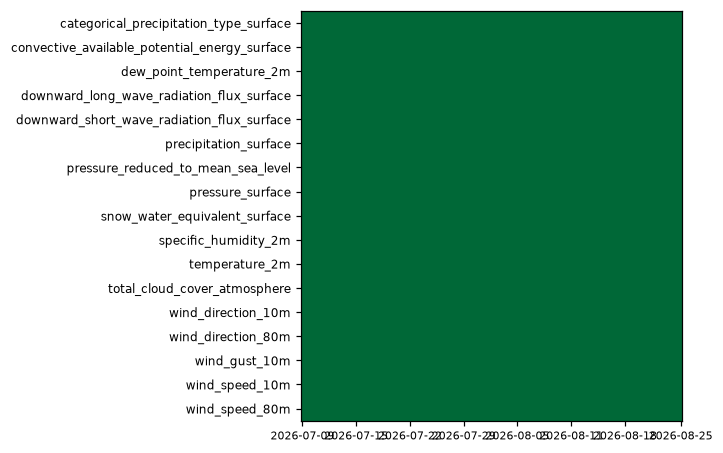
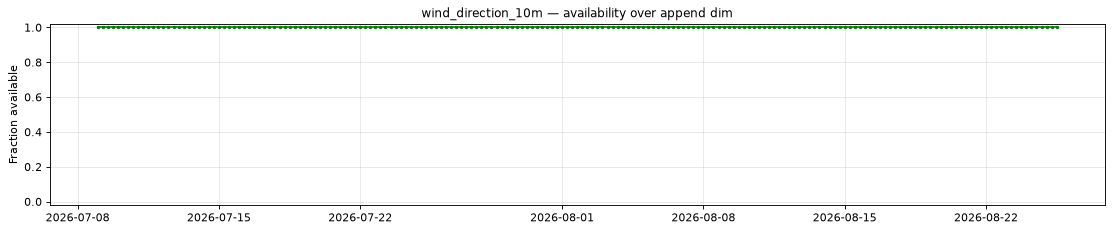
Every variable is complete at every scanned position.
Per-variable details
categorical_precipitation_type_surface
Metadata
| Field | Value |
|---|---|
| units | 1 |
| long_name | Precipitation type |
| short_name | ptype |
| standard_name | n/a |
| step_type | instant |
| flag_values | 1, 2, 3, 4, 5, 6, 7, 8, 9 |
| flag_meanings | rain mixture_of_rain_and_snow freezing_rain ice_pellets snow no_precipitation drizzle freezing_drizzle mixture_of_freezing_rain_and_ice_pellets |
| comment | 1=Rain; 2=Rain/snow; 3=Freezing rain; 4=Ice pellets; 5=Snow; 6=None; 7=Drizzle; 8=Freezing drizzle; 9=Freezing rain/ice pellets. NaN at lead time 0. |
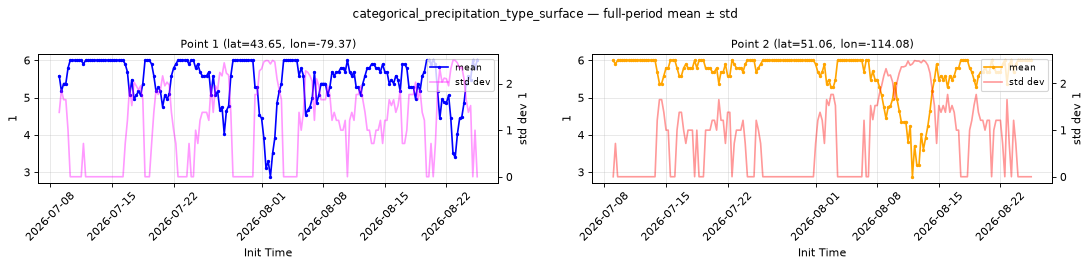
Point time series — 2026-07-09T00:00 - 2026-08-25T12:00
| Point | min | mean | std | max |
|---|---|---|---|---|
| P1 | 2.875 | 5.456 | 1.138 | 6 |
| P2 | 2.875 | 5.638 | 0.8157 | 6 |
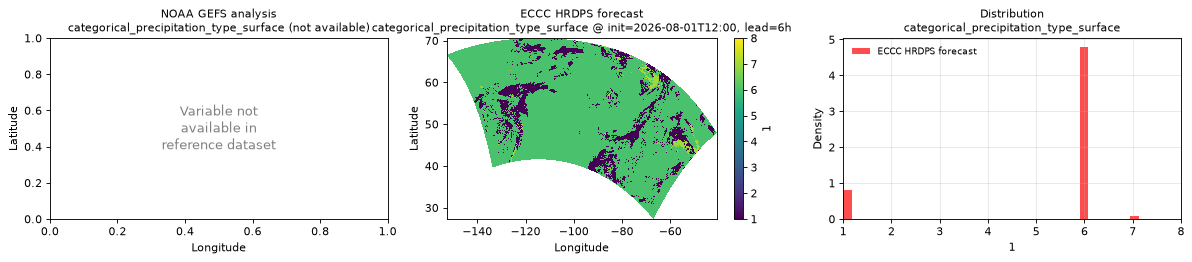
Spatial — init=2026-08-01T12:00, lead=6h (reference not available)
| Source | min | mean | max |
|---|---|---|---|
| Validation | 1 | 5.297 | 8 |
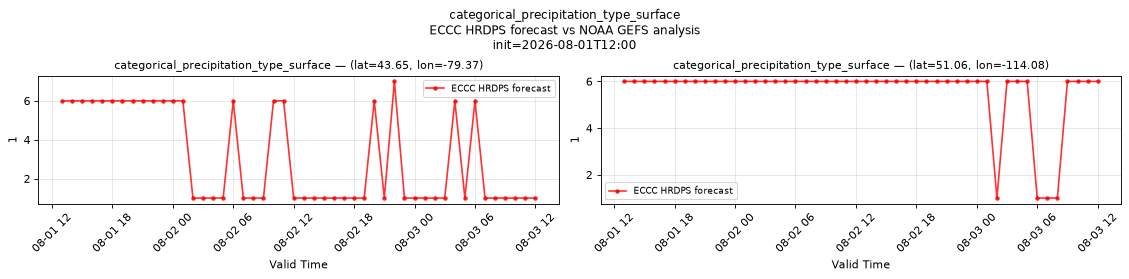
Temporal — init=2026-08-01T12:00
| Source | min | mean | max |
|---|---|---|---|
| P1 Validation | 1 | 3.104 | 7 |
| P2 Validation | 1 | 5.583 | 6 |
Availability — 191 of 191 positions complete; nulls P1 0/9168, P2 0/9168
convective_available_potential_energy_surface
Metadata
| Field | Value |
|---|---|
| units | J kg-1 |
| long_name | Convective available potential energy |
| short_name | cape |
| standard_name | atmosphere_convective_available_potential_energy |
| step_type | instant |
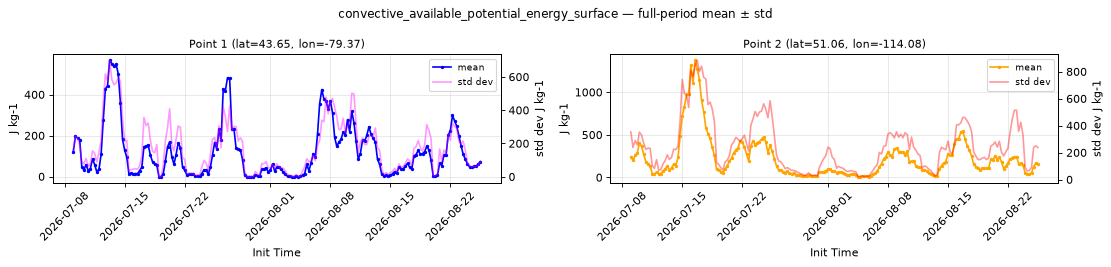
| comment | Negative values are source markers rather than energies and cover roughly half the domain. Mask values < -0.1. |
Point time series — 2026-07-09T00:00 - 2026-08-25T12:00
| Point | min | mean | std | max |
|---|---|---|---|---|
| P1 | -1 | 120.6 | 176.2 | 567.5 |
| P2 | 8.009 | 224.7 | 251.1 | 1375 |
Spatial — init=2026-08-01T12:00, lead=6h (reference not available)
| Source | min | mean | max |
|---|---|---|---|
| Validation | -1000 | 320.2 | 4224 |
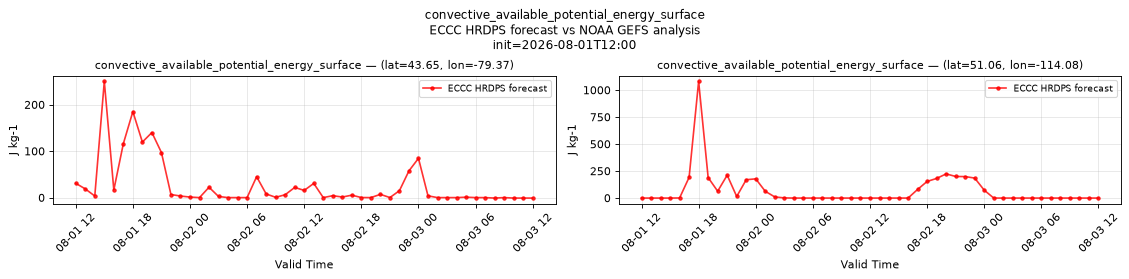
Temporal — init=2026-08-01T12:00
| Source | min | mean | max |
|---|---|---|---|
| P1 Validation | -1 | 26.85 | 250 |
| P2 Validation | -1 | 69.89 | 1080 |
Availability — 191 of 191 positions complete; nulls P1 0/9359, P2 0/9359
dew_point_temperature_2m
Metadata
| Field | Value |
|---|---|
| units | degree_Celsius |
| long_name | 2 metre dewpoint temperature |
| short_name | 2d |
| standard_name | dew_point_temperature |
| step_type | instant |
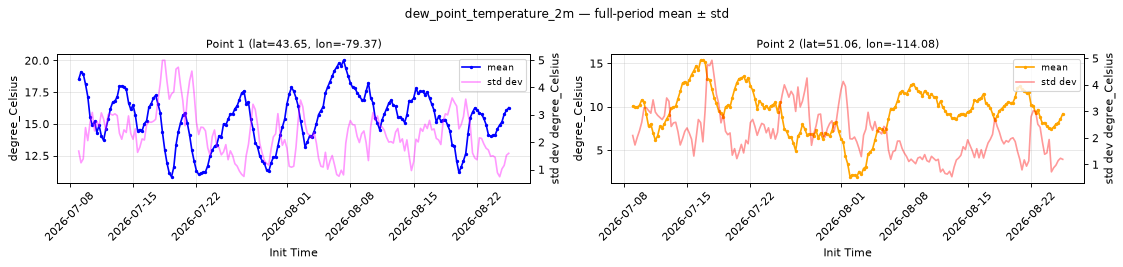
Point time series — 2026-07-09T00:00 - 2026-08-25T12:00
| Point | min | mean | std | max |
|---|---|---|---|---|
| P1 | 10.83 | 15.41 | 2.29 | 20.02 |
| P2 | 1.934 | 9.367 | 2.163 | 15.36 |
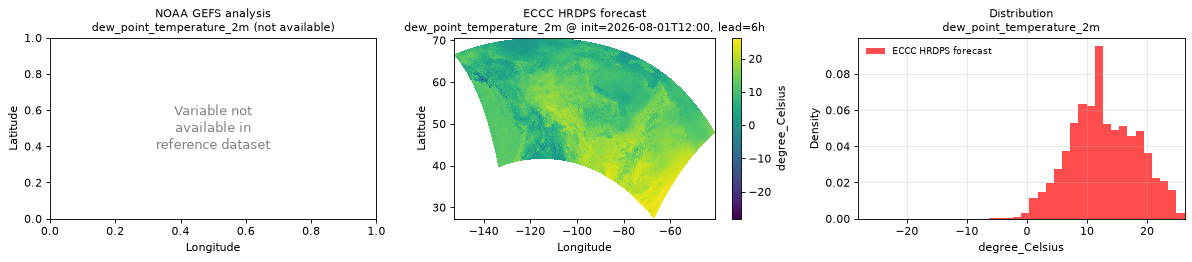
Spatial — init=2026-08-01T12:00, lead=6h (reference not available)
| Source | min | mean | max |
|---|---|---|---|
| Validation | -28.12 | 12.79 | 26.25 |
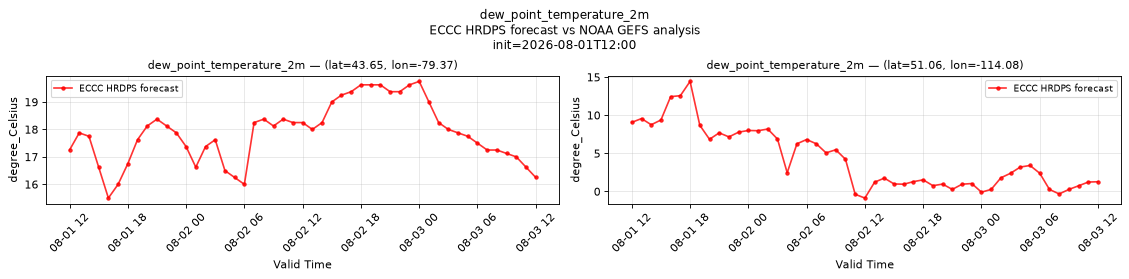
Temporal — init=2026-08-01T12:00
| Source | min | mean | max |
|---|---|---|---|
| P1 Validation | 15.5 | 17.88 | 19.75 |
| P2 Validation | -0.8672 | 4.268 | 14.44 |
Availability — 191 of 191 positions complete; nulls P1 0/9359, P2 0/9359
downward_long_wave_radiation_flux_surface
Metadata
| Field | Value |
|---|---|
| units | W m-2 |
| long_name | Surface downward long-wave radiation flux |
| short_name | sdlwrf |
| standard_name | surface_downwelling_longwave_flux_in_air |
| step_type | avg |
| comment | Average flux since the previous forecast step. |
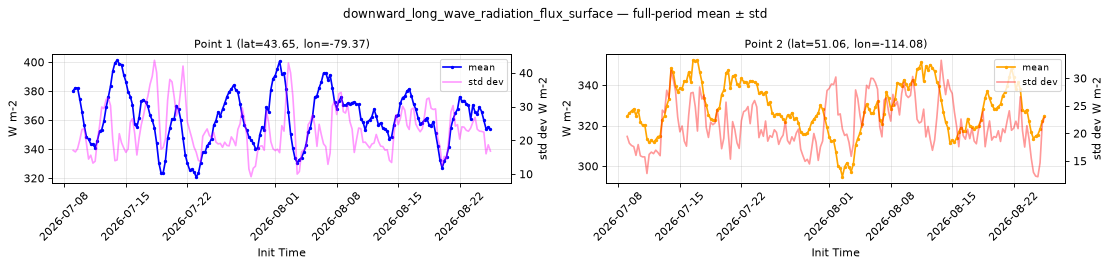
Point time series — 2026-07-09T00:00 - 2026-08-25T12:00
| Point | min | mean | std | max |
|---|---|---|---|---|
| P1 | 321 | 361.8 | 22.95 | 401.2 |
| P2 | 294.8 | 328.6 | 21.7 | 352.3 |
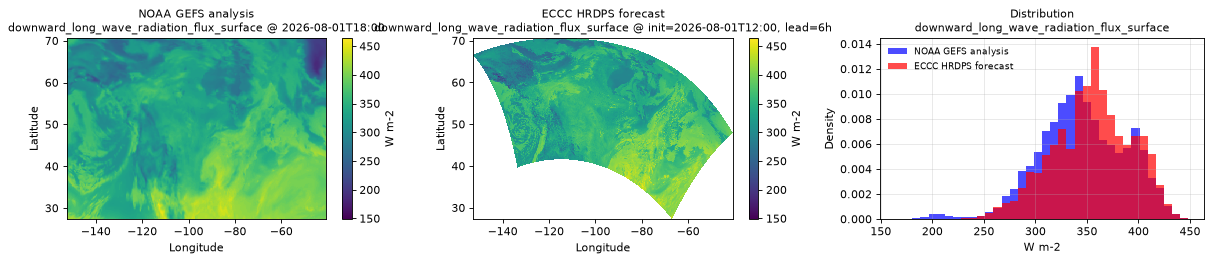
Spatial — init=2026-08-01T12:00, lead=6h (reference at 2026-08-01T18:00)
| Source | min | mean | max |
|---|---|---|---|
| Validation | 149 | 354.5 | 464 |
| Reference | 185 | 345.2 | 456 |
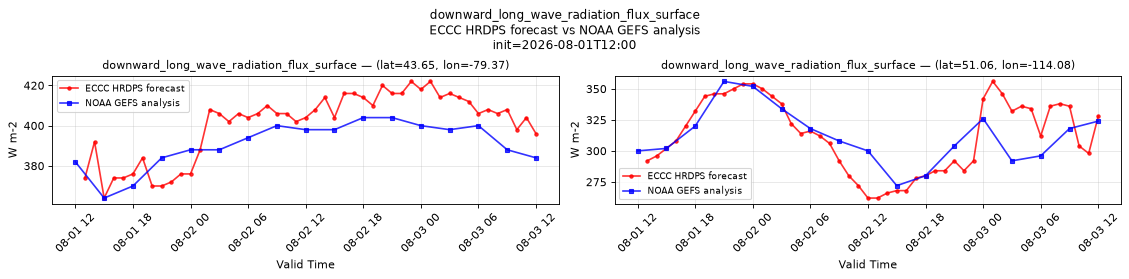
Temporal — init=2026-08-01T12:00
| Source | min | mean | max |
|---|---|---|---|
| P1 Validation | 364 | 400.6 | 422 |
| P1 Reference | 364 | 390.8 | 404 |
| P2 Validation | 262 | 312.7 | 356 |
| P2 Reference | 272 | 311.9 | 356 |
Availability — 191 of 191 positions complete; nulls P1 0/9168, P2 0/9168
downward_short_wave_radiation_flux_surface
Metadata
| Field | Value |
|---|---|
| units | W m-2 |
| long_name | Surface downward short-wave radiation flux |
| short_name | sdswrf |
| standard_name | surface_downwelling_shortwave_flux_in_air |
| step_type | avg |
| comment | Average flux since the previous forecast step. |
Point time series — 2026-07-09T00:00 - 2026-08-25T12:00
| Point | min | mean | std | max |
|---|---|---|---|---|
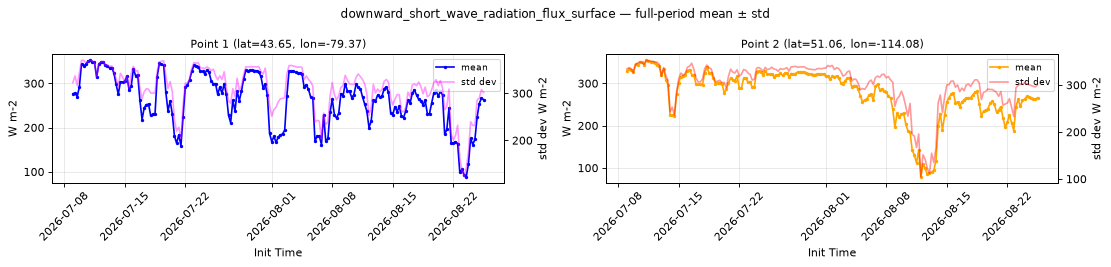
| P1 | 88.73 | 264.9 | 310.4 | 352.4 |
| P2 | 79.11 | 277.1 | 302.7 | 354.7 |
Spatial — init=2026-08-01T12:00, lead=6h (reference at 2026-08-01T18:00)
| Source | min | mean | max |
|---|---|---|---|
| Validation | 11.69 | 580.5 | 1004 |
| Reference | 3.734 | 387.9 | 904 |
Temporal — init=2026-08-01T12:00
| Source | min | mean | max |
|---|---|---|---|
| P1 Validation | 0 | 166.7 | 904 |
| P1 Reference | 0 | 141.9 | 628 |
| P2 Validation | 0 | 309.6 | 884 |
| P2 Reference | 0 | 296.8 | 864 |
Availability — 191 of 191 positions complete; nulls P1 0/9168, P2 0/9168
precipitation_surface
Metadata
| Field | Value |
|---|---|
| units | kg m-2 s-1 |
| long_name | Precipitation rate |
| short_name | prate |
| standard_name | precipitation_flux |
| step_type | avg |
| comment | Average precipitation rate since the previous forecast step. Units equivalent to mm/s. |
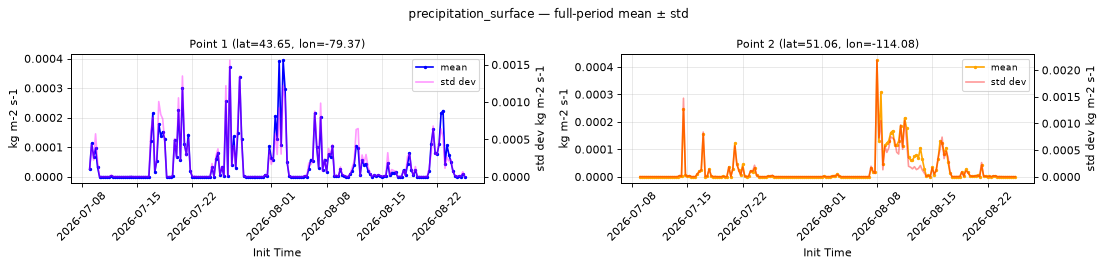
Point time series — 2026-07-09T00:00 - 2026-08-25T12:00
| Point | min | mean | std | max |
|---|---|---|---|---|
| P1 | 0 | 4.755e-05 | 0.0001928 | 0.0003942 |
| P2 | 0 | 2.64e-05 | 0.0001186 | 0.0004242 |
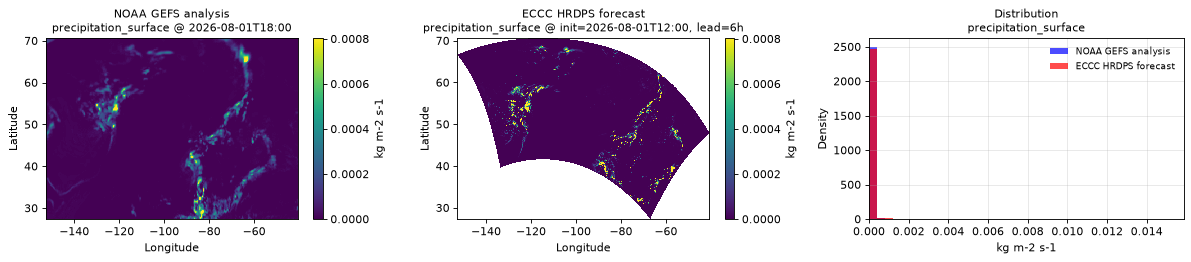
Spatial — init=2026-08-01T12:00, lead=6h (reference at 2026-08-01T18:00)
| Source | min | mean | max |
|---|---|---|---|
| Validation | 0 | 3.247e-05 | 0.01587 |
| Reference | 0 | 2.086e-05 | 0.001945 |
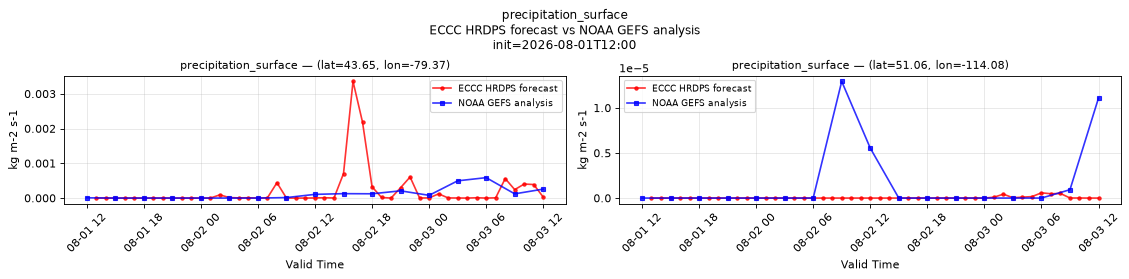
Temporal — init=2026-08-01T12:00
| Source | min | mean | max |
|---|---|---|---|
| P1 Validation | 0 | 0.0002052 | 0.003357 |
| P1 Reference | 0 | 0.0001251 | 0.0005875 |
| P2 Validation | 0 | 5.007e-08 | 5.793e-07 |
| P2 Reference | 0 | 1.794e-06 | 1.293e-05 |
Availability — 191 of 191 positions complete; nulls P1 0/9168, P2 0/9168
pressure_reduced_to_mean_sea_level
Metadata
| Field | Value |
|---|---|
| units | Pa |
| long_name | Pressure reduced to MSL |
| short_name | prmsl |
| standard_name | air_pressure_at_mean_sea_level |
| step_type | instant |
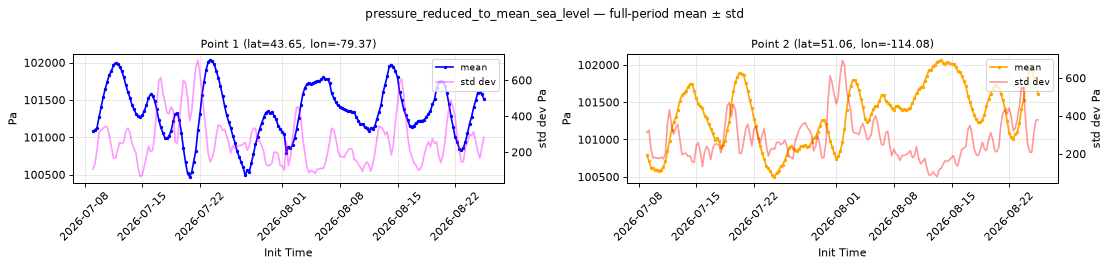
Point time series — 2026-07-09T00:00 - 2026-08-25T12:00
| Point | min | mean | std | max |
|---|---|---|---|---|
| P1 | 1.005e+05 | 1.013e+05 | 265.8 | 1.02e+05 |
| P2 | 1.005e+05 | 1.013e+05 | 279 | 1.021e+05 |
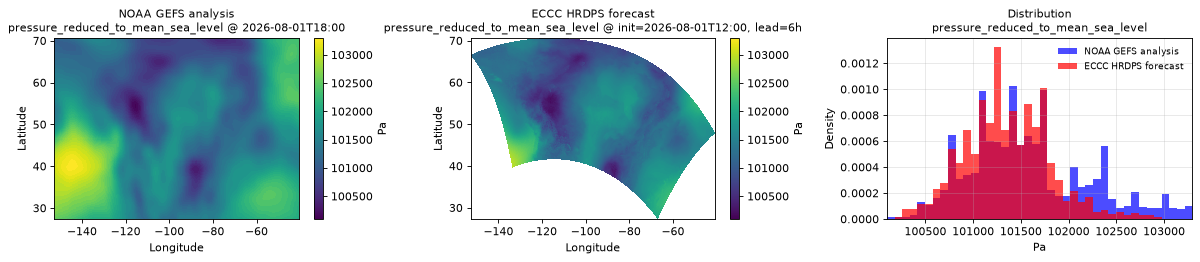
Spatial — init=2026-08-01T12:00, lead=6h (reference at 2026-08-01T18:00)
| Source | min | mean | max |
|---|---|---|---|
| Validation | 1.002e+05 | 1.013e+05 | 1.03e+05 |
| Reference | 1.001e+05 | 1.016e+05 | 1.033e+05 |
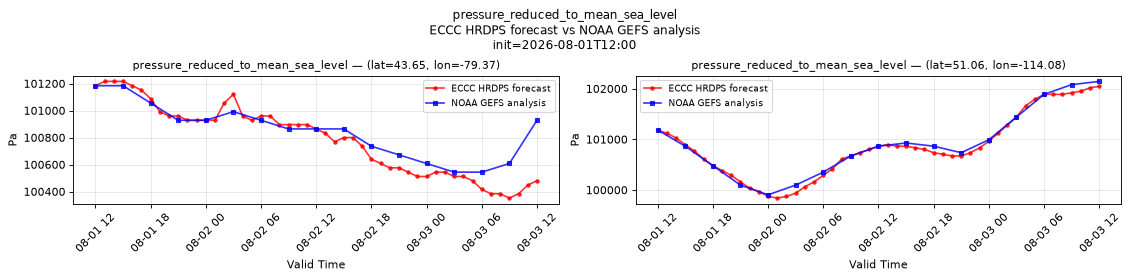
Temporal — init=2026-08-01T12:00
| Source | min | mean | max |
|---|---|---|---|
| P1 Validation | 1.004e+05 | 1.008e+05 | 1.012e+05 |
| P1 Reference | 1.005e+05 | 1.008e+05 | 1.012e+05 |
| P2 Validation | 9.984e+04 | 1.008e+05 | 1.02e+05 |
| P2 Reference | 9.99e+04 | 1.009e+05 | 1.021e+05 |
Availability — 191 of 191 positions complete; nulls P1 0/9359, P2 0/9359
pressure_surface
Metadata
| Field | Value |
|---|---|
| units | Pa |
| long_name | Surface pressure |
| short_name | sp |
| standard_name | surface_air_pressure |
| step_type | instant |
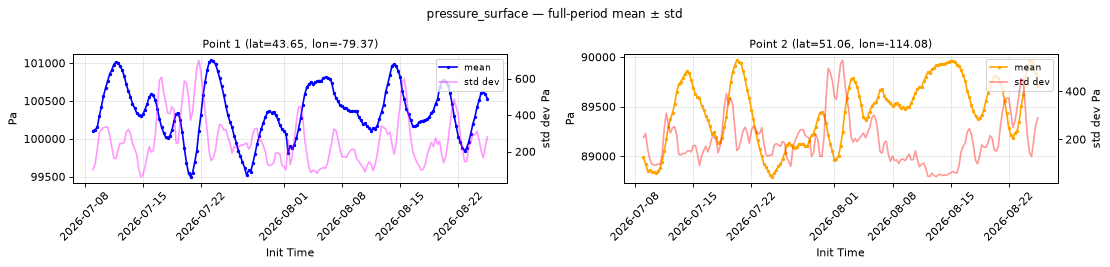
Point time series — 2026-07-09T00:00 - 2026-08-25T12:00
| Point | min | mean | std | max |
|---|---|---|---|---|
| P1 | 9.95e+04 | 1.004e+05 | 262.3 | 1.01e+05 |
| P2 | 8.879e+04 | 8.946e+04 | 197.7 | 8.997e+04 |
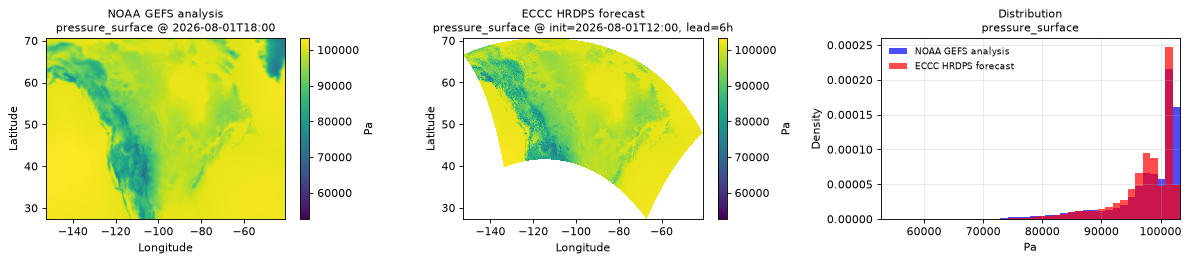
Spatial — init=2026-08-01T12:00, lead=6h (reference at 2026-08-01T18:00)
| Source | min | mean | max |
|---|---|---|---|
| Validation | 5.266e+04 | 9.739e+04 | 1.03e+05 |
| Reference | 6.893e+04 | 9.786e+04 | 1.033e+05 |
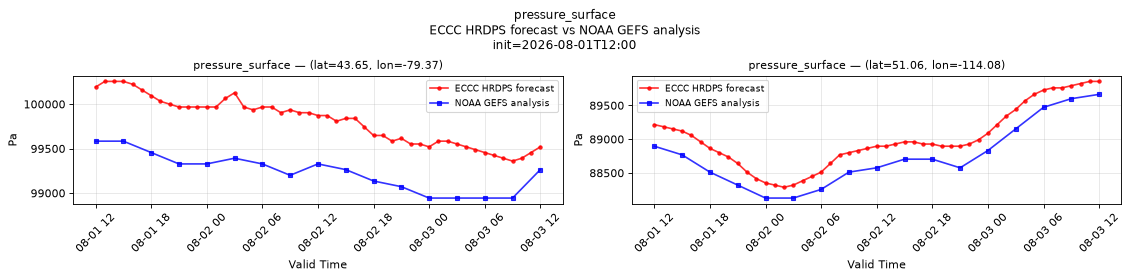
Temporal — init=2026-08-01T12:00
| Source | min | mean | max |
|---|---|---|---|
| P1 Validation | 9.936e+04 | 9.981e+04 | 1.003e+05 |
| P1 Reference | 9.894e+04 | 9.924e+04 | 9.958e+04 |
| P2 Validation | 8.829e+04 | 8.9e+04 | 8.986e+04 |
| P2 Reference | 8.813e+04 | 8.875e+04 | 8.966e+04 |
Availability — 191 of 191 positions complete; nulls P1 0/9359, P2 0/9359
snow_water_equivalent_surface
Metadata
| Field | Value |
|---|---|
| units | m |
| long_name | Snow depth water equivalent |
| short_name | sd |
| standard_name | lwe_thickness_of_surface_snow_amount |
| step_type | instant |
Point time series — 2026-07-09T00:00 - 2026-08-25T12:00
| Point | min | mean | std | max |
|---|---|---|---|---|
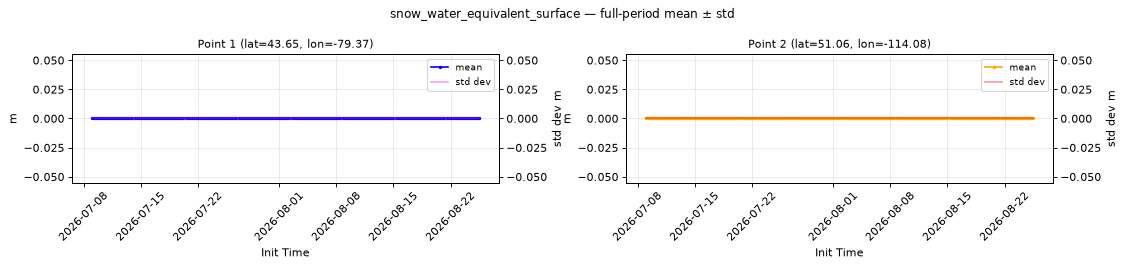
| P1 | 0 | 0 | 0 | 0 |
| P2 | 0 | 0 | 0 | 0 |
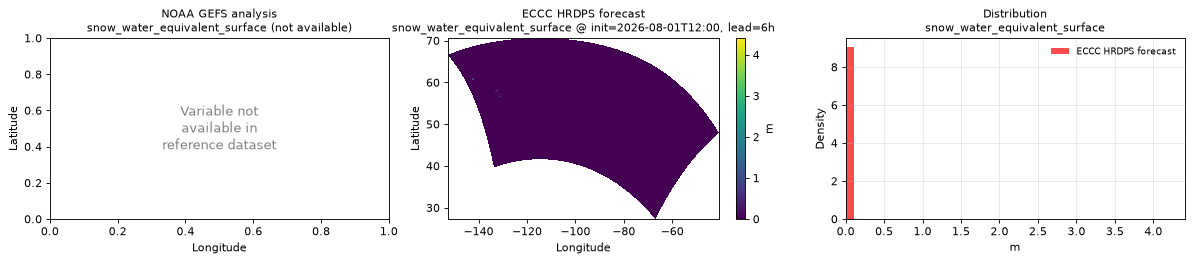
Spatial — init=2026-08-01T12:00, lead=6h (reference not available)
| Source | min | mean | max |
|---|---|---|---|
| Validation | 0 | 0.0003358 | 4.406 |
Temporal — init=2026-08-01T12:00
| Source | min | mean | max |
|---|---|---|---|
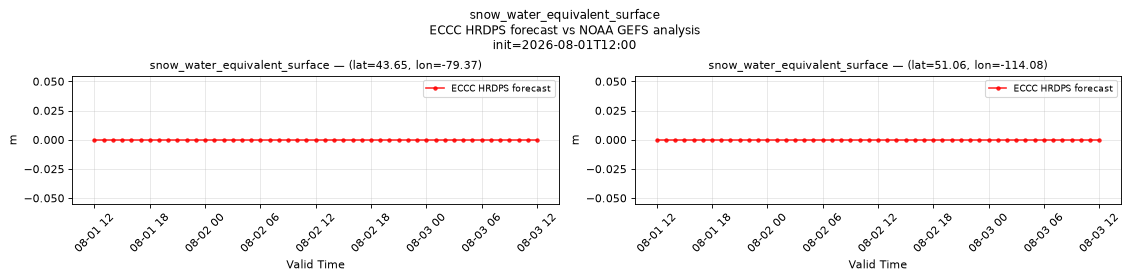
| P1 Validation | 0 | 0 | 0 |
| P2 Validation | 0 | 0 | 0 |
Availability — 191 of 191 positions complete; nulls P1 0/9359, P2 0/9359
specific_humidity_2m
Metadata
| Field | Value |
|---|---|
| units | 1 |
| long_name | Specific humidity |
| short_name | q |
| standard_name | specific_humidity |
| step_type | instant |
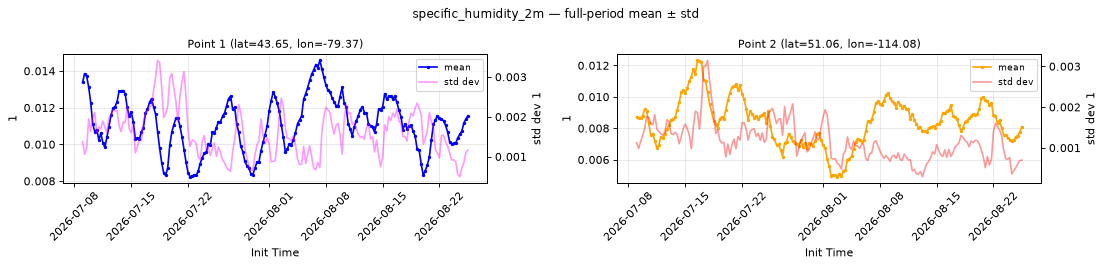
Point time series — 2026-07-09T00:00 - 2026-08-25T12:00
| Point | min | mean | std | max |
|---|---|---|---|---|
| P1 | 0.008237 | 0.0111 | 0.001598 | 0.01458 |
| P2 | 0.004914 | 0.00841 | 0.001177 | 0.01233 |
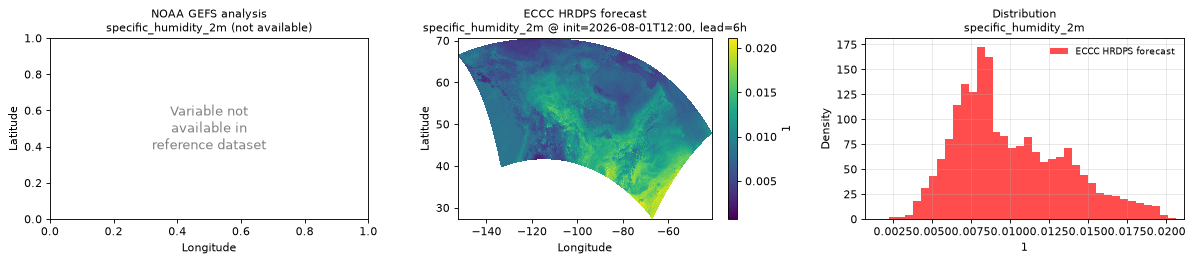
Spatial — init=2026-08-01T12:00, lead=6h (reference not available)
| Source | min | mean | max |
|---|---|---|---|
| Validation | 0.0007172 | 0.009978 | 0.02112 |
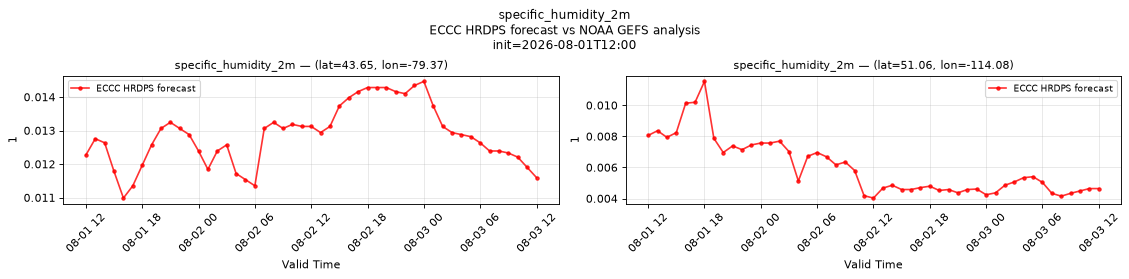
Temporal — init=2026-08-01T12:00
| Source | min | mean | max |
|---|---|---|---|
| P1 Validation | 0.01099 | 0.01286 | 0.01447 |
| P2 Validation | 0.004028 | 0.006016 | 0.01154 |
Availability — 191 of 191 positions complete; nulls P1 0/9359, P2 0/9359
temperature_2m
Metadata
| Field | Value |
|---|---|
| units | degree_Celsius |
| long_name | 2 metre temperature |
| short_name | 2t |
| standard_name | air_temperature |
| step_type | instant |
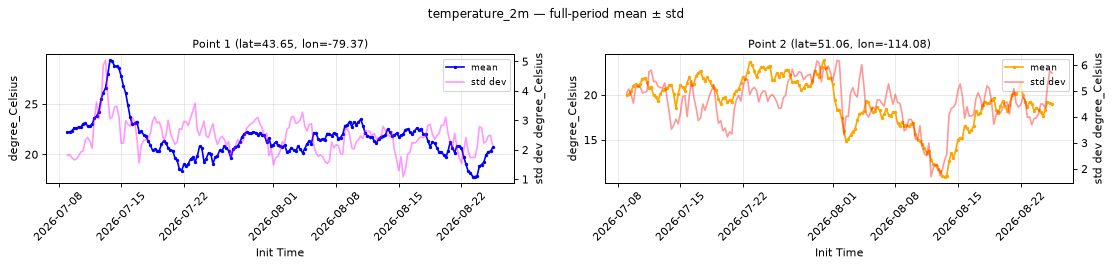
Point time series — 2026-07-09T00:00 - 2026-08-25T12:00
| Point | min | mean | std | max |
|---|---|---|---|---|
| P1 | 17.79 | 21.64 | 2.456 | 29.34 |
| P2 | 10.88 | 19.14 | 4.547 | 23.88 |
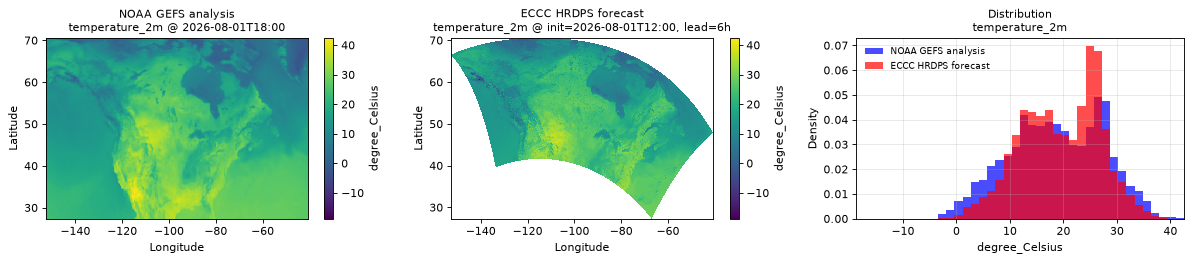
Spatial — init=2026-08-01T12:00, lead=6h (reference at 2026-08-01T18:00)
| Source | min | mean | max |
|---|---|---|---|
| Validation | -18.75 | 19.57 | 39.25 |
| Reference | -3.109 | 18.71 | 42.5 |
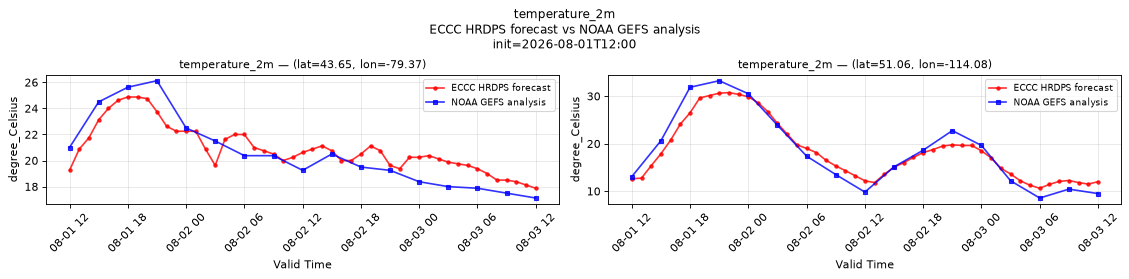
Temporal — init=2026-08-01T12:00
| Source | min | mean | max |
|---|---|---|---|
| P1 Validation | 17.88 | 20.91 | 24.88 |
| P1 Reference | 17.12 | 20.55 | 26.12 |
| P2 Validation | 10.62 | 18.36 | 30.75 |
| P2 Reference | 8.562 | 18.28 | 33.25 |
Availability — 191 of 191 positions complete; nulls P1 0/9359, P2 0/9359
total_cloud_cover_atmosphere
Metadata
| Field | Value |
|---|---|
| units | percent |
| long_name | Total cloud cover |
| short_name | tcc |
| standard_name | cloud_area_fraction |
| step_type | instant |
| comment | NaN at lead time 0. |
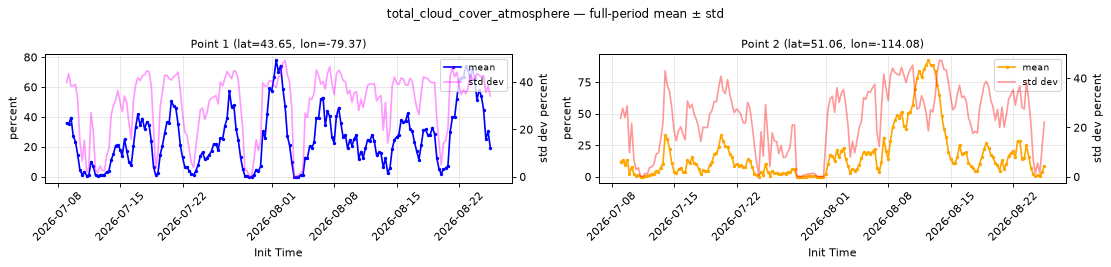
Point time series — 2026-07-09T00:00 - 2026-08-25T12:00
| Point | min | mean | std | max |
|---|---|---|---|---|
| P1 | 0 | 25.22 | 30.84 | 77.93 |
| P2 | 0 | 17.09 | 23.32 | 92.33 |
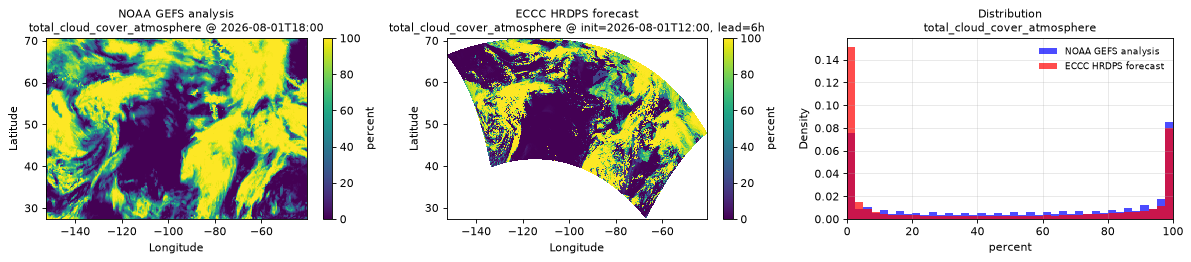
Spatial — init=2026-08-01T12:00, lead=6h (reference at 2026-08-01T18:00)
| Source | min | mean | max |
|---|---|---|---|
| Validation | 0 | 41.95 | 100 |
| Reference | 0 | 53.68 | 100 |
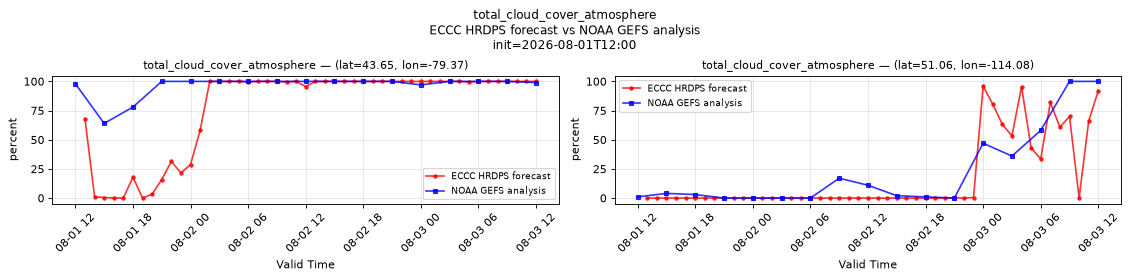
Temporal — init=2026-08-01T12:00
| Source | min | mean | max |
|---|---|---|---|
| P1 Validation | 0 | 77.93 | 100 |
| P1 Reference | 64 | 96.24 | 100 |
| P2 Validation | 0 | 17.43 | 96 |
| P2 Reference | 0 | 22.35 | 100 |
Availability — 191 of 191 positions complete; nulls P1 0/9168, P2 0/9168
wind_direction_10m
Metadata
| Field | Value |
|---|---|
| units | degree |
| long_name | 10 metre wind direction |
| short_name | 10wdir |
| standard_name | wind_from_direction |
| step_type | instant |
| comment | Direction the wind blows from, clockwise from true north rather than from the rotated grid's north. |
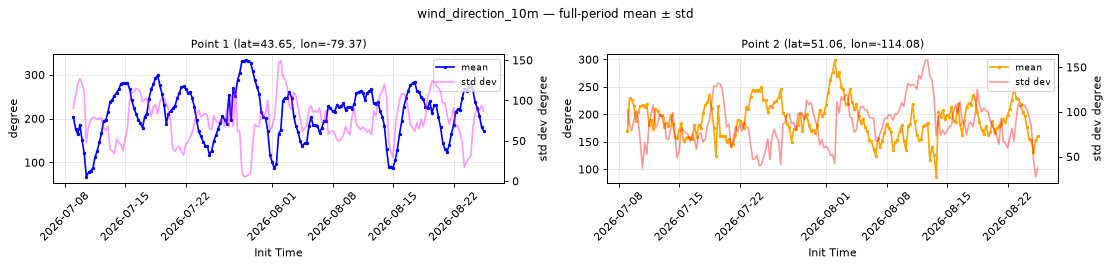
Point time series — 2026-07-09T00:00 - 2026-08-25T12:00
| Point | min | mean | std | max |
|---|---|---|---|---|
| P1 | 67.35 | 212.1 | 76.89 | 333 |
| P2 | 86.31 | 190.1 | 88.13 | 298.4 |
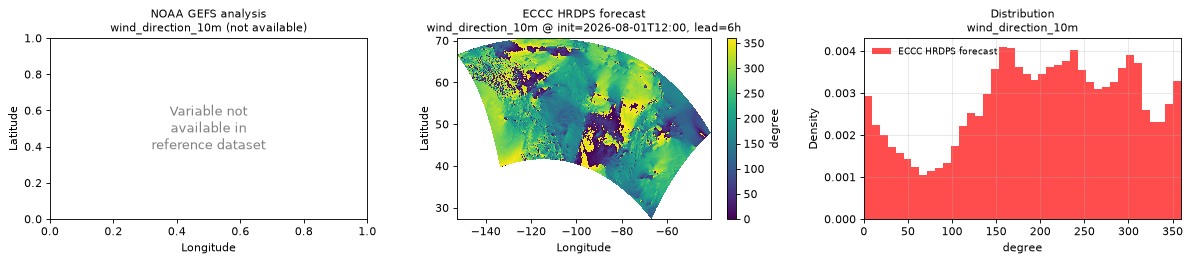
Spatial — init=2026-08-01T12:00, lead=6h (reference not available)
| Source | min | mean | max |
|---|---|---|---|
| Validation | 0 | 200.2 | 359.9 |
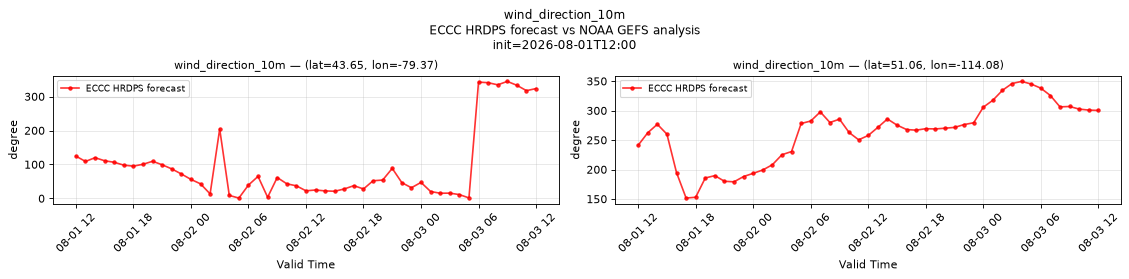
Temporal — init=2026-08-01T12:00
| Source | min | mean | max |
|---|---|---|---|
| P1 Validation | 1.1 | 96.19 | 344.6 |
| P2 Validation | 151.5 | 263.2 | 349.6 |
Availability — 191 of 191 positions complete; nulls P1 0/9359, P2 0/9359
wind_direction_80m
Metadata
| Field | Value |
|---|---|
| units | degree |
| long_name | 80 metre wind direction |
| short_name | 80wdir |
| standard_name | wind_from_direction |
| step_type | instant |
| comment | Direction the wind blows from, clockwise from true north rather than from the rotated grid's north. |
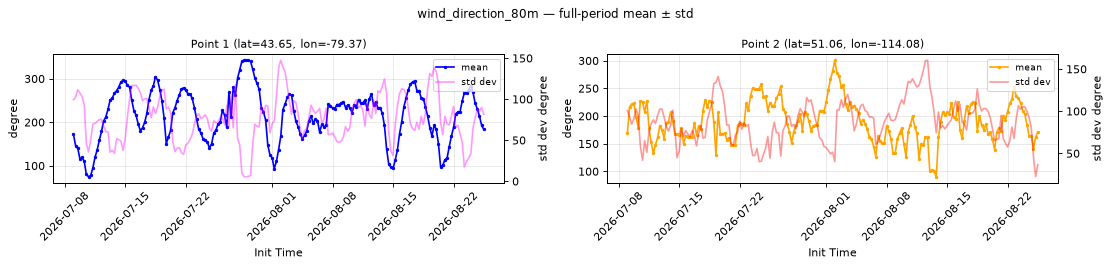
Point time series — 2026-07-09T00:00 - 2026-08-25T12:00
| Point | min | mean | std | max |
|---|---|---|---|---|
| P1 | 74.79 | 215.8 | 76.38 | 342.5 |
| P2 | 90.42 | 190.4 | 88.03 | 300.8 |
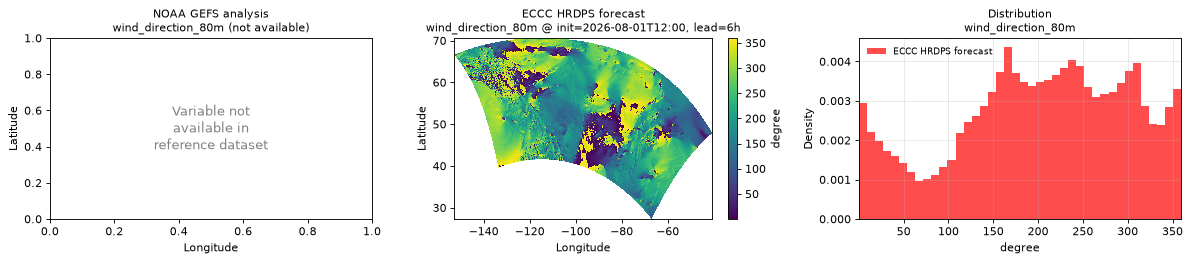
Spatial — init=2026-08-01T12:00, lead=6h (reference not available)
| Source | min | mean | max |
|---|---|---|---|
| Validation | 6.104e-05 | 201.6 | 359.5 |
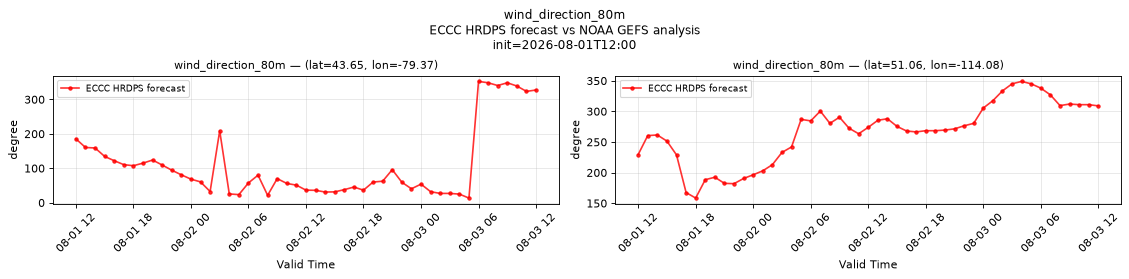
Temporal — init=2026-08-01T12:00
| Source | min | mean | max |
|---|---|---|---|
| P1 Validation | 13.5 | 110 | 352.5 |
| P2 Validation | 158.5 | 266.7 | 349 |
Availability — 191 of 191 positions complete; nulls P1 0/9359, P2 0/9359
wind_gust_10m
Metadata
| Field | Value |
|---|---|
| units | m s-1 |
| long_name | Wind speed (gust) |
| short_name | gust |
| standard_name | wind_speed_of_gust |
| step_type | instant |
| comment | Peak wind speed at this time step, including sub-grid turbulence. Not a maximum since the previous forecast step. |
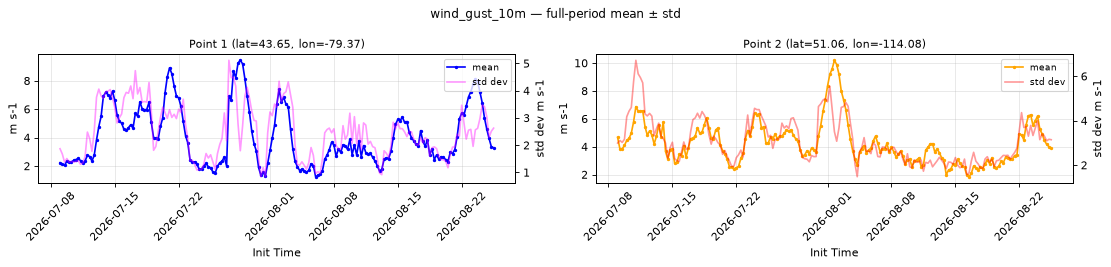
Point time series — 2026-07-09T00:00 - 2026-08-25T12:00
| Point | min | mean | std | max |
|---|---|---|---|---|
| P1 | 1.241 | 4.078 | 2.484 | 9.443 |
| P2 | 1.842 | 4.272 | 3.09 | 10.2 |
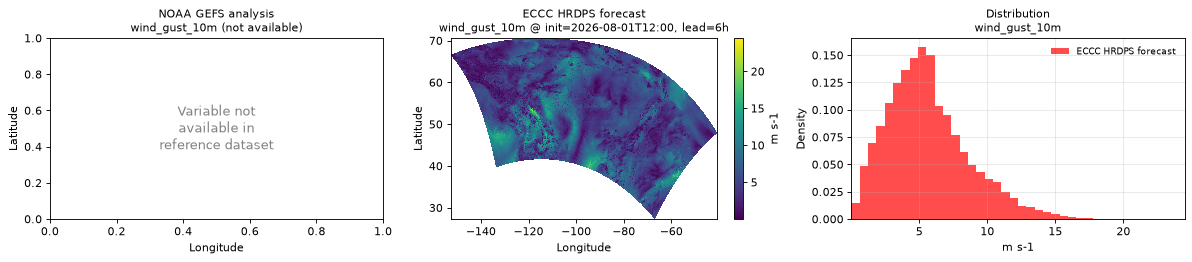
Spatial — init=2026-08-01T12:00, lead=6h (reference not available)
| Source | min | mean | max |
|---|---|---|---|
| Validation | 0.01001 | 5.622 | 24.5 |
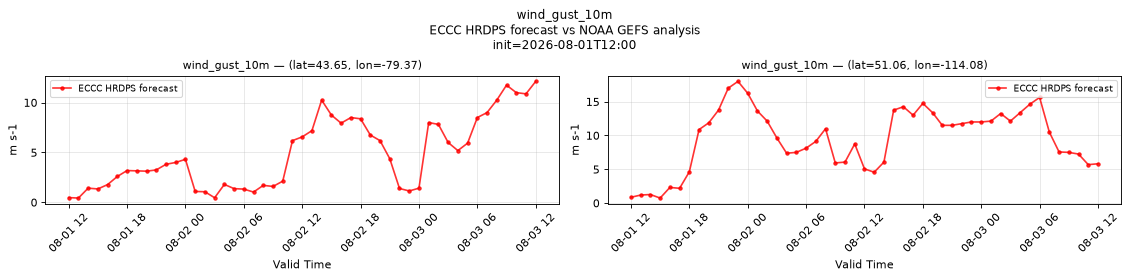
Temporal — init=2026-08-01T12:00
| Source | min | mean | max |
|---|---|---|---|
| P1 Validation | 0.4297 | 4.855 | 12.12 |
| P2 Validation | 0.7422 | 9.575 | 18 |
Availability — 191 of 191 positions complete; nulls P1 0/9359, P2 0/9359
wind_speed_10m
Metadata
| Field | Value |
|---|---|
| units | m s-1 |
| long_name | 10 metre wind speed |
| short_name | 10si |
| standard_name | wind_speed |
| step_type | instant |
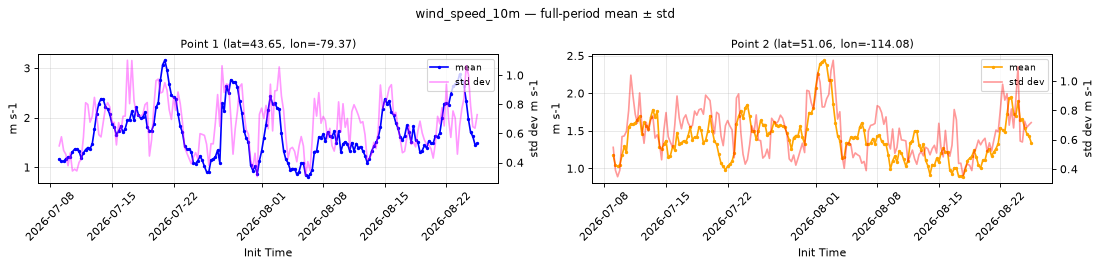
Point time series — 2026-07-09T00:00 - 2026-08-25T12:00
| Point | min | mean | std | max |
|---|---|---|---|---|
| P1 | 0.8101 | 1.71 | 0.6612 | 3.157 |
| P2 | 0.8904 | 1.409 | 0.6543 | 2.439 |
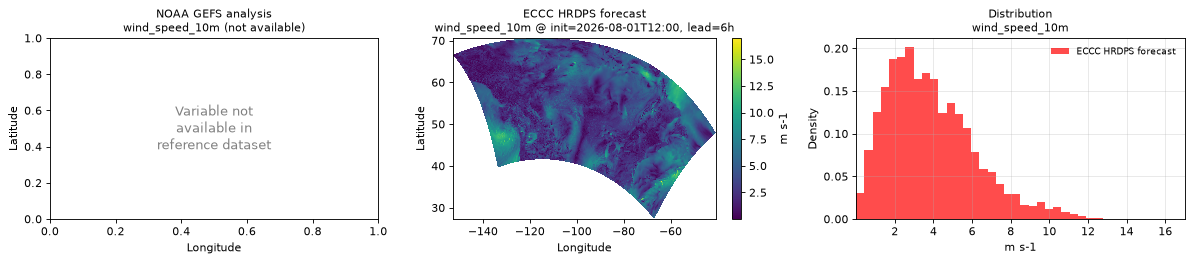
Spatial — init=2026-08-01T12:00, lead=6h (reference not available)
| Source | min | mean | max |
|---|---|---|---|
| Validation | 0.001358 | 3.869 | 17 |
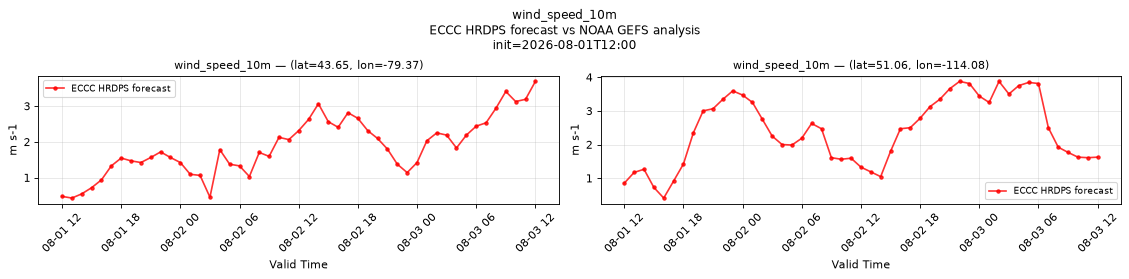
Temporal — init=2026-08-01T12:00
| Source | min | mean | max |
|---|---|---|---|
| P1 Validation | 0.4297 | 1.86 | 3.688 |
| P2 Validation | 0.4102 | 2.394 | 3.875 |
Availability — 191 of 191 positions complete; nulls P1 0/9359, P2 0/9359
wind_speed_80m
Metadata
| Field | Value |
|---|---|
| units | m s-1 |
| long_name | 80 metre wind speed |
| short_name | 80si |
| standard_name | wind_speed |
| step_type | instant |
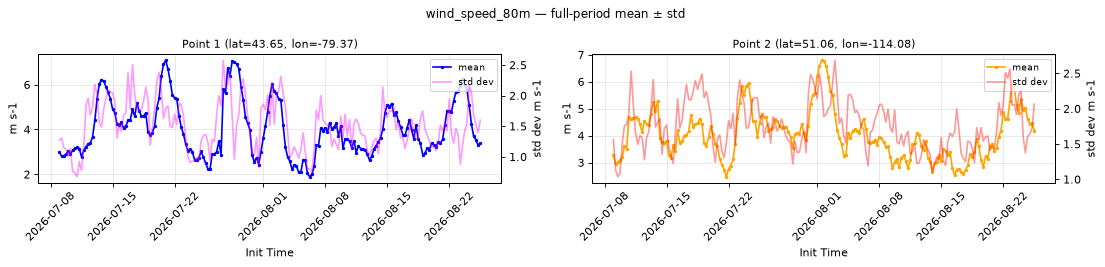
Point time series — 2026-07-09T00:00 - 2026-08-25T12:00
| Point | min | mean | std | max |
|---|---|---|---|---|
| P1 | 1.892 | 4.054 | 1.516 | 7.089 |
| P2 | 2.474 | 4.045 | 1.763 | 6.793 |
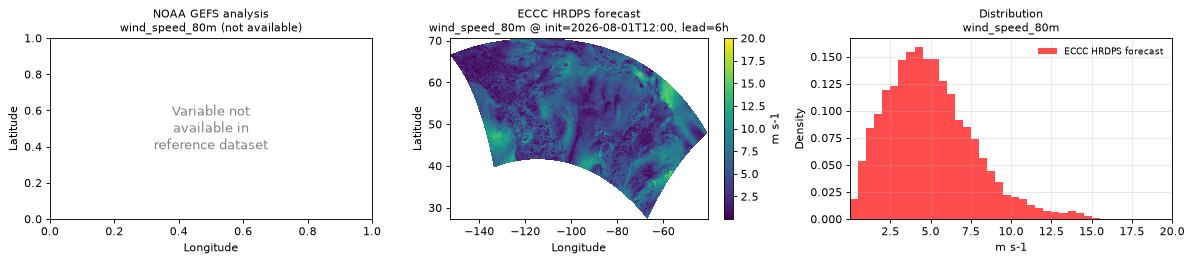
Spatial — init=2026-08-01T12:00, lead=6h (reference not available)
| Source | min | mean | max |
|---|---|---|---|
| Validation | 0.004211 | 5.006 | 20 |
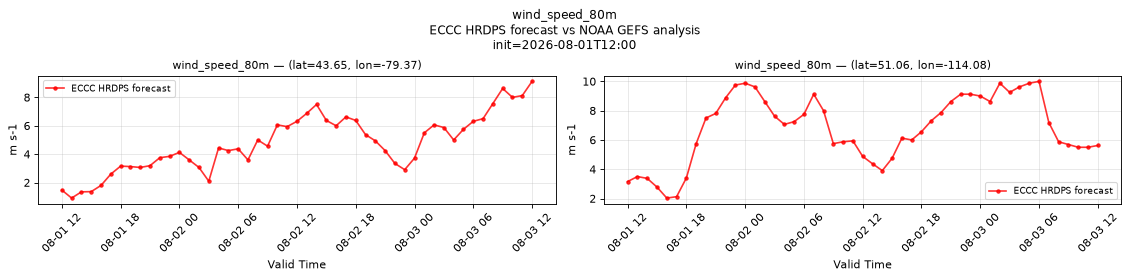
Temporal — init=2026-08-01T12:00
| Source | min | mean | max |
|---|---|---|---|
| P1 Validation | 0.9062 | 4.77 | 9.125 |
| P2 Validation | 2.031 | 6.793 | 10 |
Availability — 191 of 191 positions complete; nulls P1 0/9359, P2 0/9359