DWD ICON-EU forecast, 5 day validation report
This dataset validation report plots a sample of values from the DWD ICON-EU forecast, 5 day dataset over time and across space, comparing where possible to a previously validated reference dataset. It also reports the quantity of unavailable values and their associated timestamps. These analyses are one layer of a multi-layered dataset validation process we perform at dynamical.org and also provide users a preview of the dataset contents.
Report generation start time: 2026-08-19T13:36:07 UTC
Summary
This dataset has been reviewed and is ready for use.
What looks good
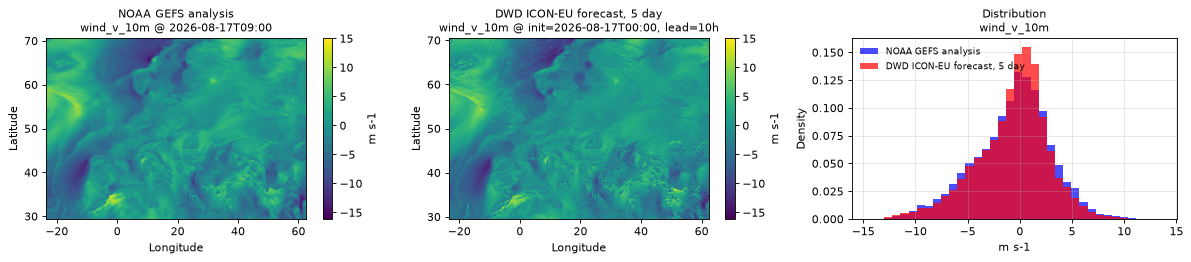
- Grid geometry, extent and orientation are correct for all 19 variables — the archive spans 23.5°W to 62.5°E and 29.5°N to 70.5°N as declared, with coastlines and terrain features (the Alps, the Atlas Mountains, Iceland, the Black Sea) at their true coordinates.
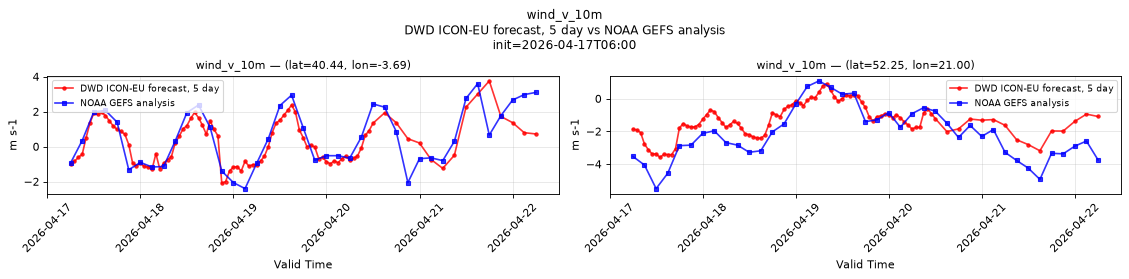
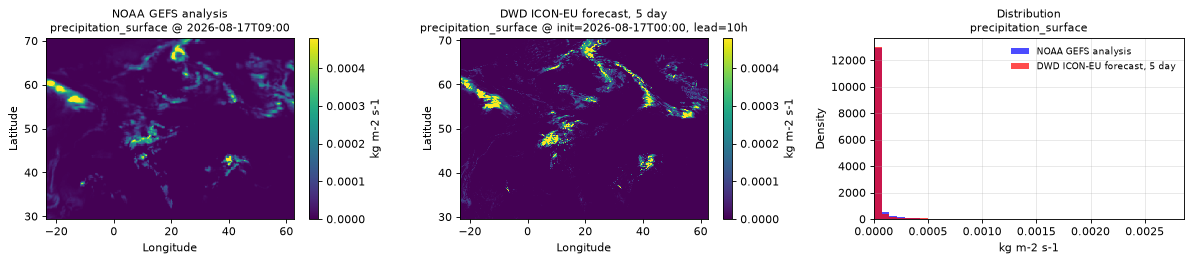
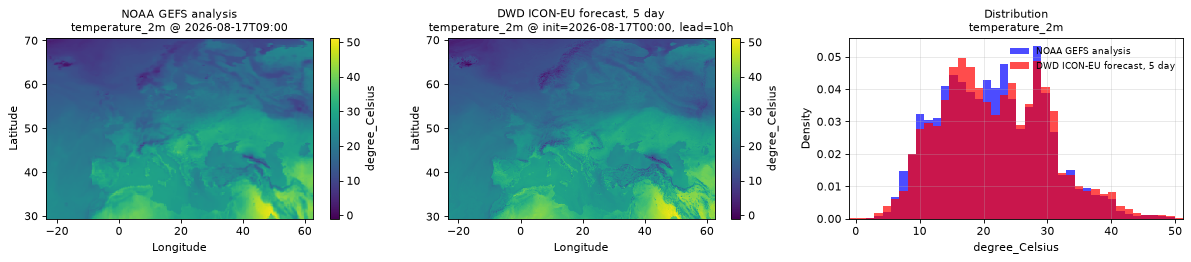
- Units and sign conventions are confirmed against the NOAA GEFS analysis reference for every variable the two archives share: temperature and dew point temperature in degrees Celsius, both pressure fields in pascals, eastward and northward wind components, and precipitation flux. Spatial patterns and value distributions match the reference closely.
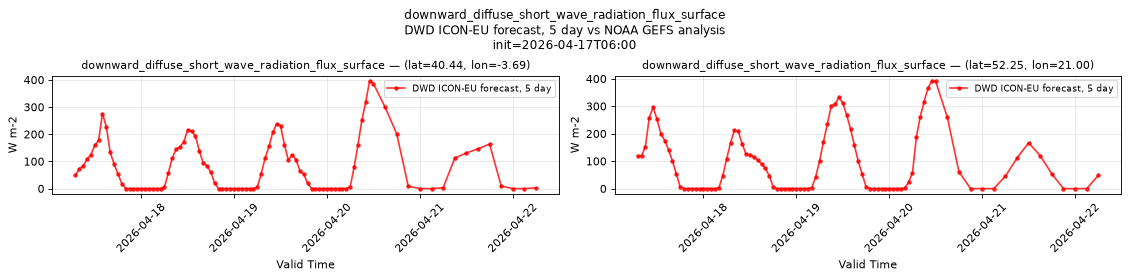
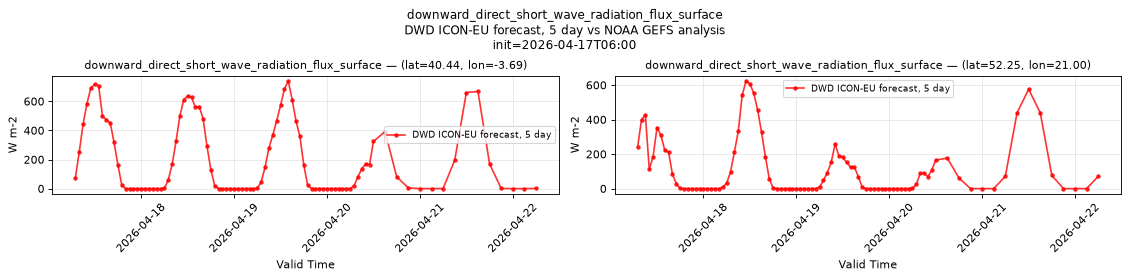
- The time-averaged fields are consistent across the whole forecast range. Forecast steps are hourly out to 78 hours and 3-hourly from 81 to 120 hours; precipitation rate and both shortwave radiation fluxes show no discontinuity at that transition, and radiation falls to zero overnight with the correct daily cycle.
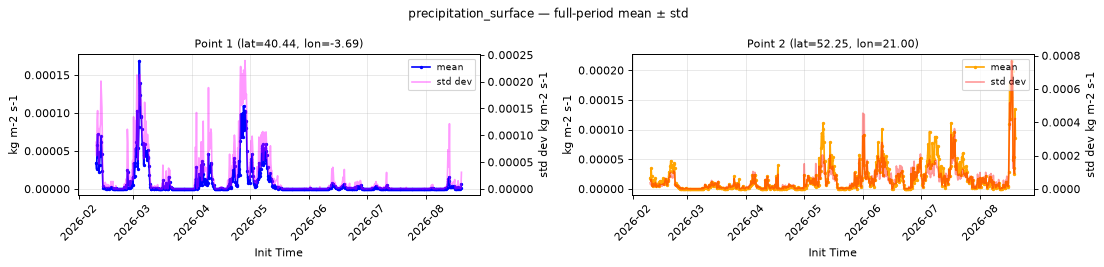
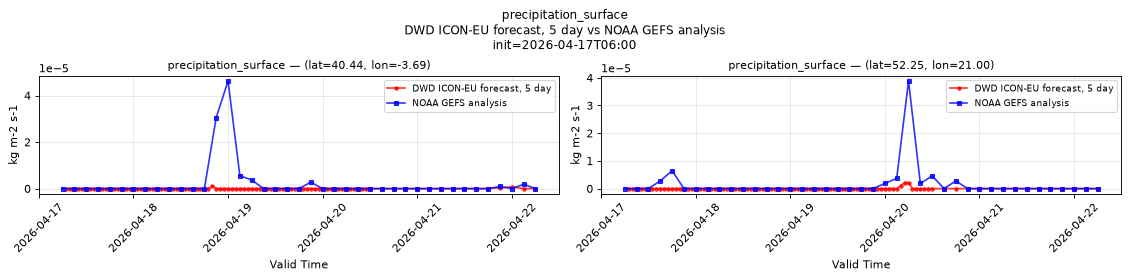
- Precipitation rates agree closely with the reference dataset over the full archive at both sampled locations, near Madrid, Spain and near Warsaw, Poland. The much lower ICON-EU values visible in the 17 April window of temporal_precipitation_surface.png are that one forecast missing showers at those two grid cells, not a difference in scale or units.
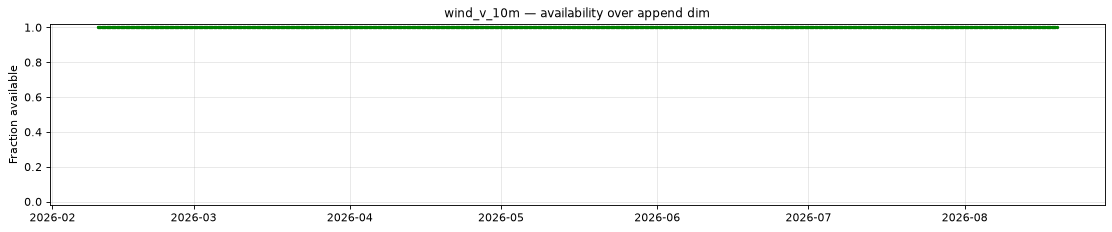
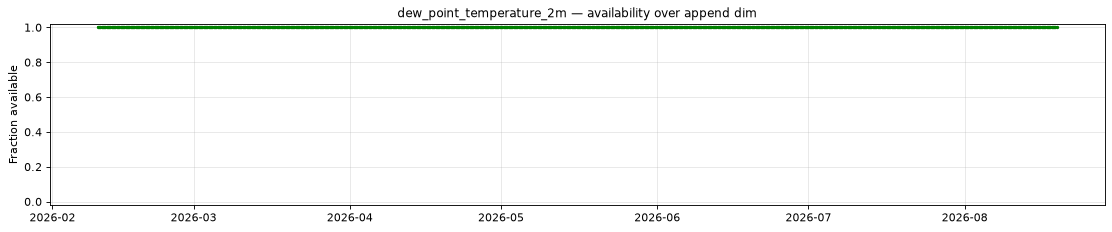
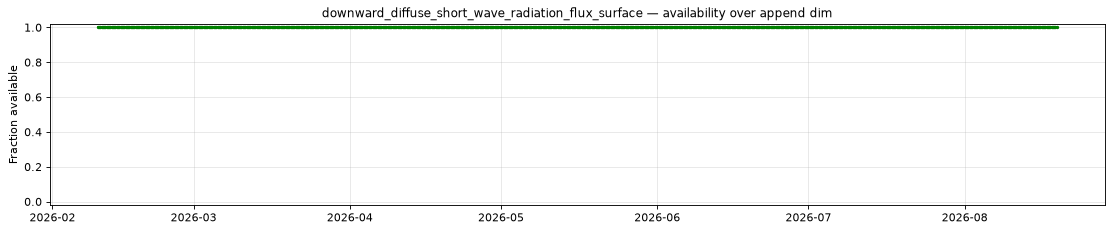
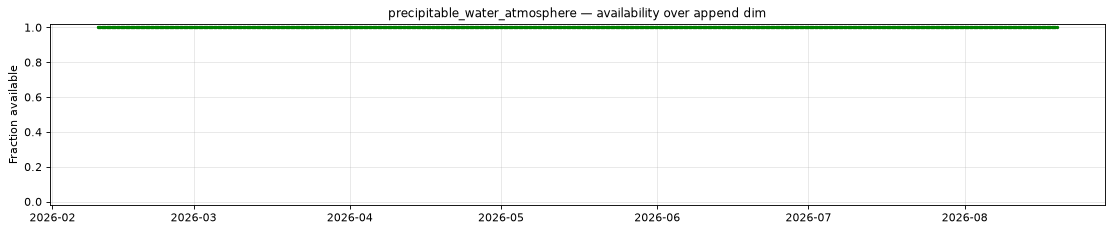
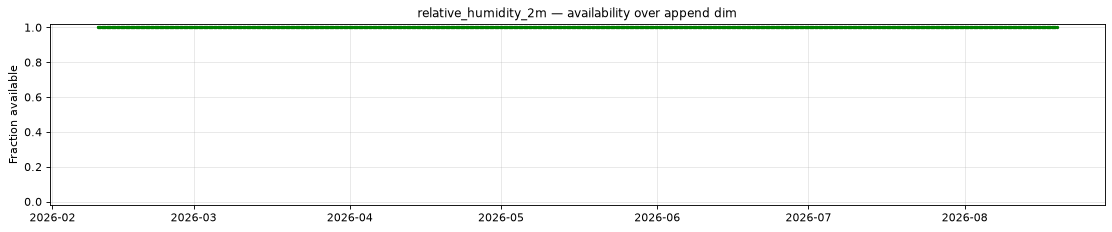
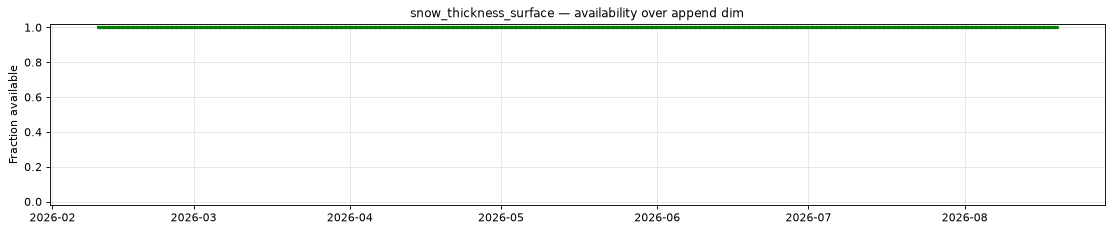
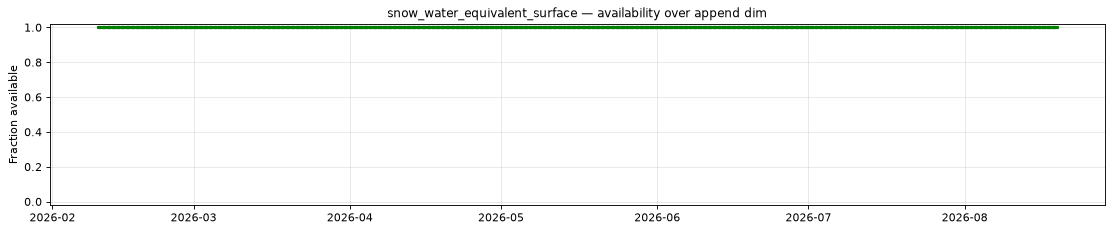
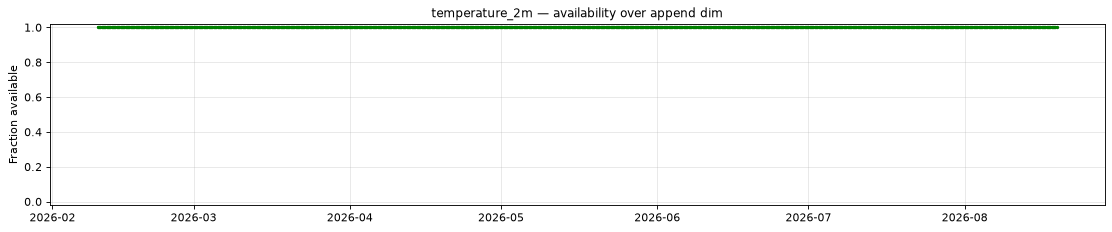
- All data is present: each of the 19 variables has complete data at all 762 forecast initialization times, at every forecast step.
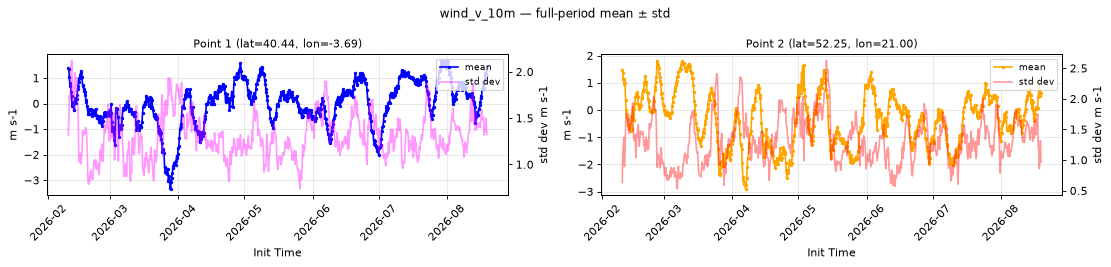
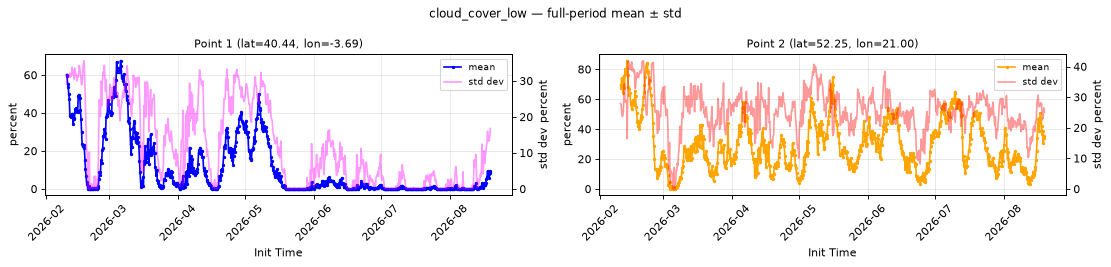
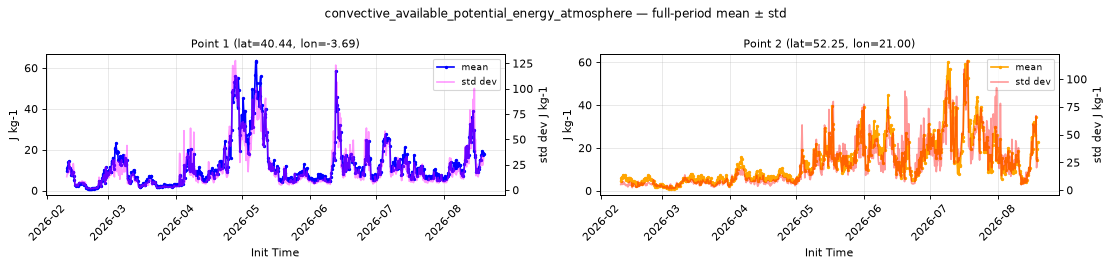
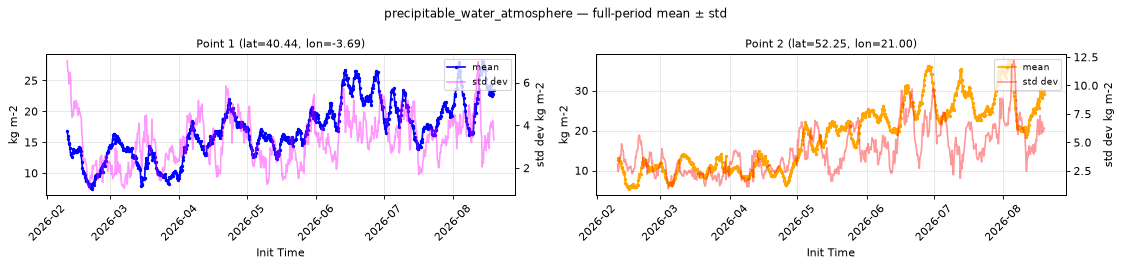
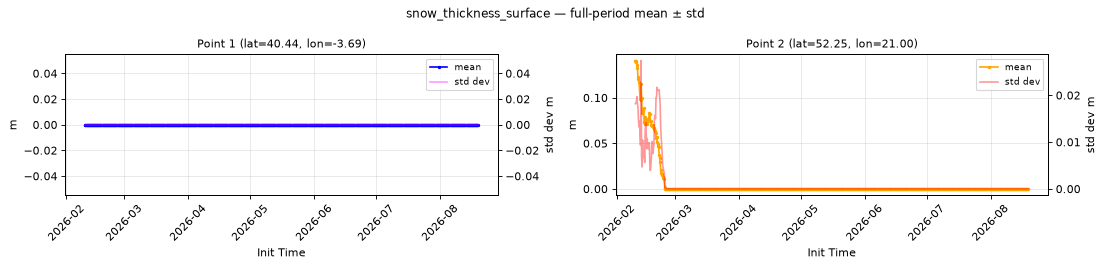
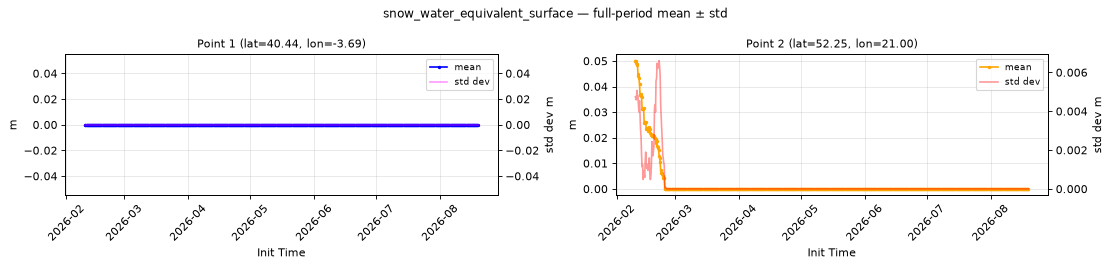
- Seasonal and physical behaviour is coherent, with no unexplained shifts in any variable across the six months of the archive: the Polish snowpack melts out through February, low cloud over inland Iberia collapses in summer, and convective available potential energy and precipitable water rise into July.
Datasets
| Role | Name | ID | Version | URL |
|---|---|---|---|---|
| Validation | DWD ICON-EU forecast, 5 day | dwd-icon-eu-forecast-5-day |
v0.2.0 |
s3://dynamical-dwd-icon-eu/dwd-icon-eu-forecast-5-day/v0.2.0.icechunk |
| Reference | NOAA GEFS analysis | noaa-gefs-analysis |
0.1.2 |
s3://dynamical-noaa-gefs/noaa-gefs-analysis/v0.1.2.icechunk/ |
Run parameters
| Parameter | Value |
|---|---|
| Validation dataset type | forecast |
| Validation time range | init_time 2026-02-10T00:00 → 2026-08-19T06:00 |
| Reference time range | time 2000-01-01T00:00 → 2026-08-19T06:00 |
| Point 1 | lat=40.4375, lon=-3.6875 |
| Point 2 | lat=52.2500, lon=21.0000 |
| Spatial comparison time | init=2026-08-17T00:00, lead=10h (reference at 2026-08-17T09:00) |
| Timeseries period | init=2026-04-17T06:00 |
Availability
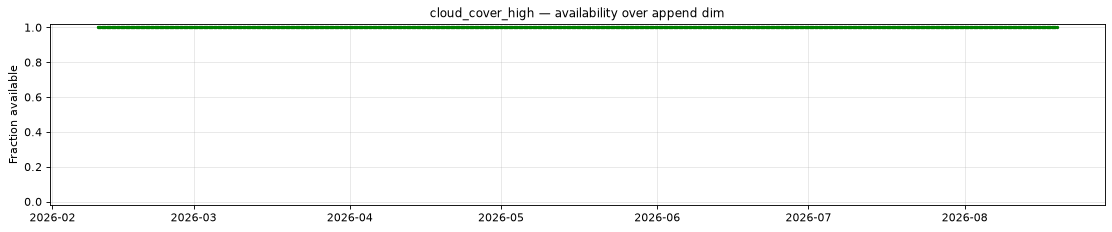
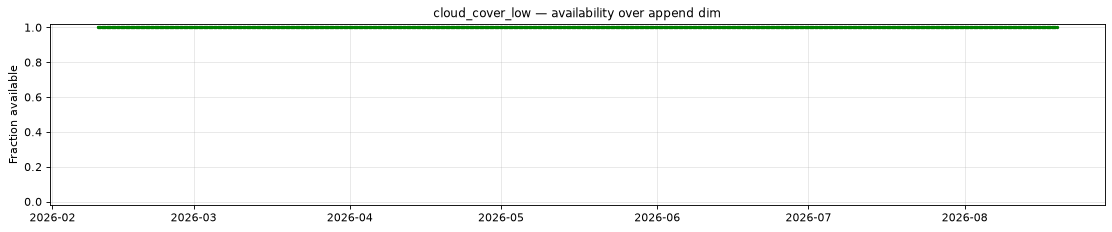
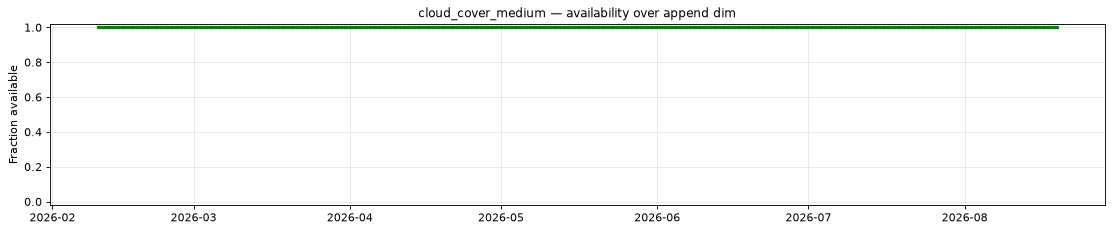
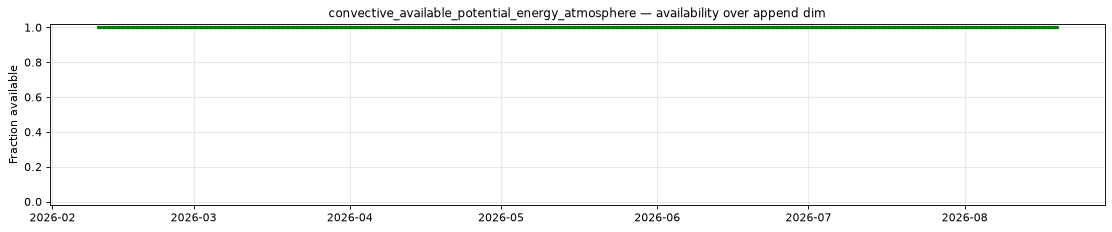
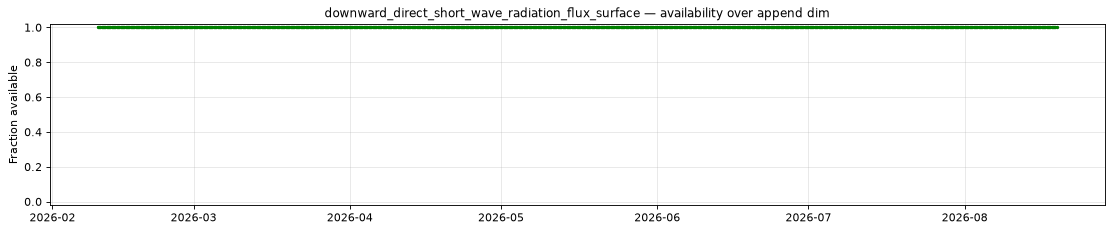
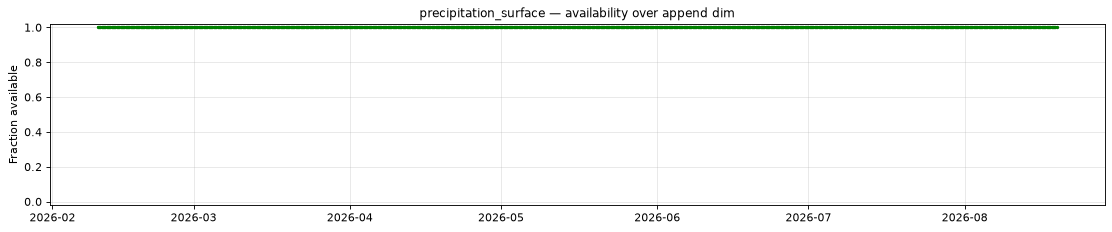
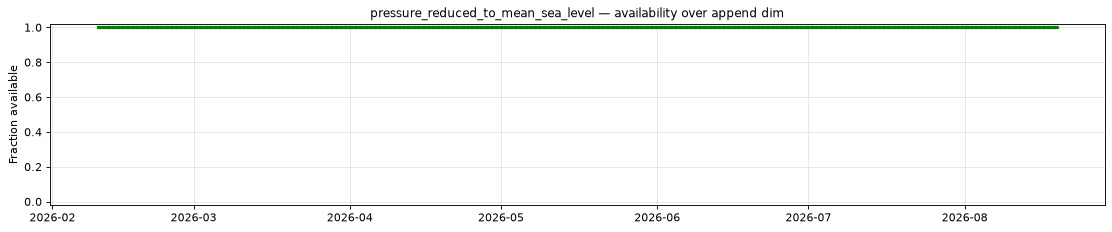
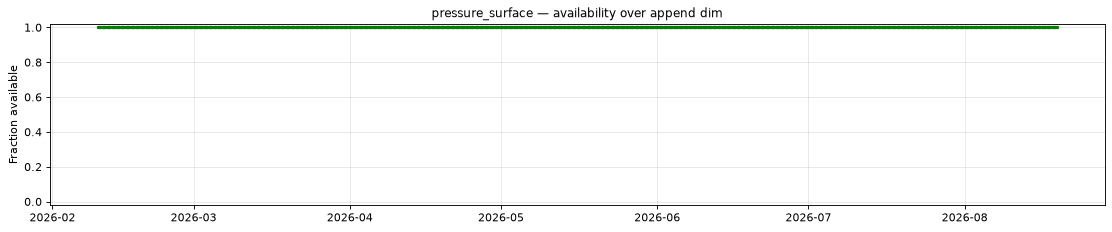
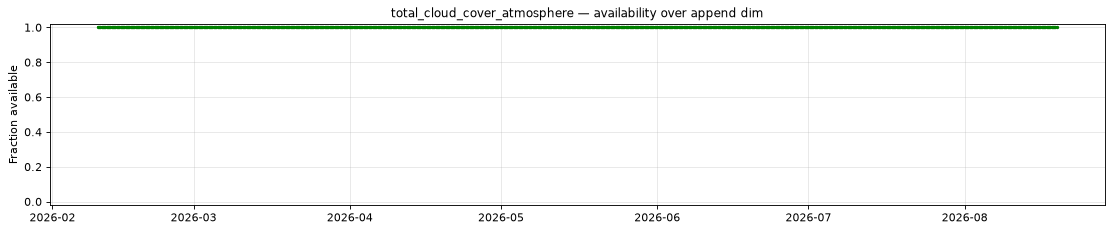
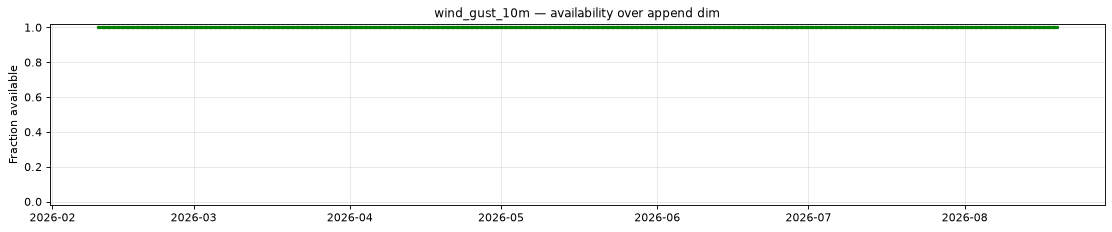
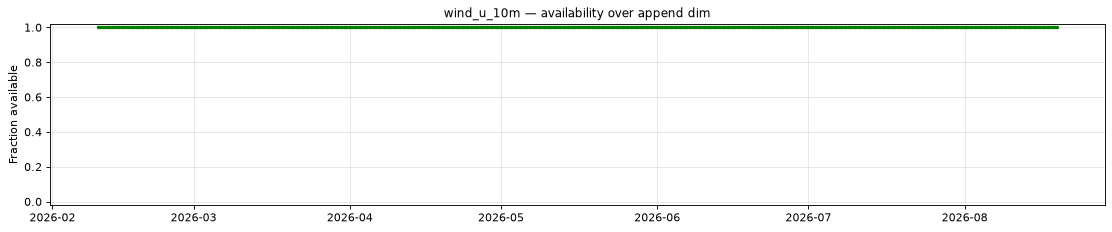
The plot below shows the availability of each variable over time — light red marks unavailable data, dark green marks present data.
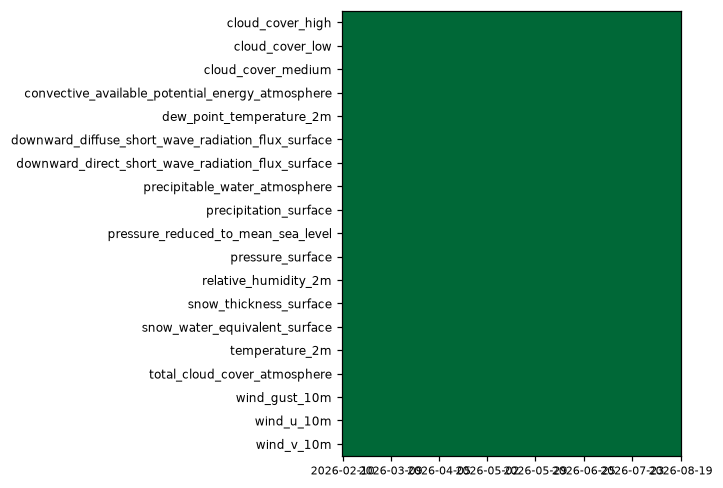
Every variable is complete at every scanned position.
Per-variable details
cloud_cover_high
Metadata
| Field | Value |
|---|---|
| units | percent |
| long_name | High cloud cover |
| short_name | hcc |
| standard_name | cloud_area_fraction_in_atmosphere_layer |
| step_type | instant |
| comment | Cloud cover (0 - 400 hPa). |
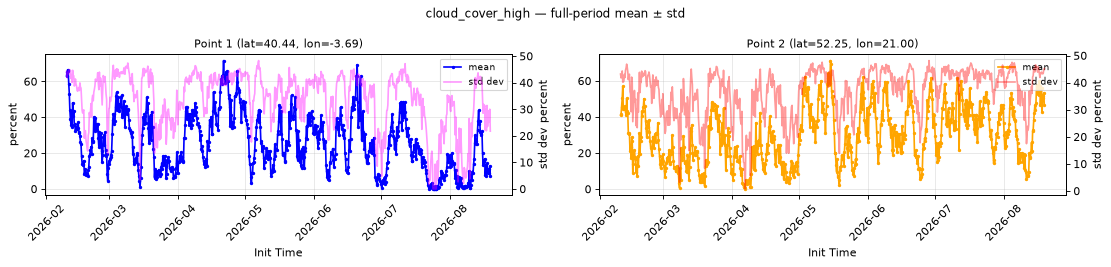
Point time series — 2026-02-10T00:00 - 2026-08-19T06:00
| Point | min | mean | std | max |
|---|---|---|---|---|
| P1 | 0 | 25.96 | 33.89 | 71.65 |
| P2 | 0.07863 | 29.73 | 37.03 | 71.23 |
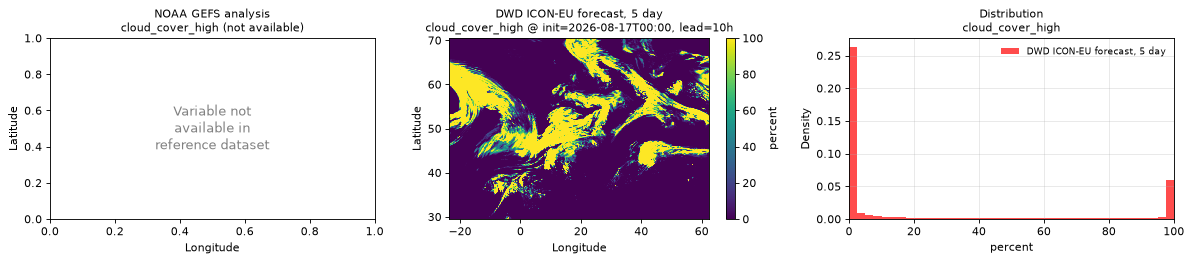
Spatial — init=2026-08-17T00:00, lead=10h (reference not available)
| Source | min | mean | max |
|---|---|---|---|
| Validation | 0 | 22.53 | 100 |
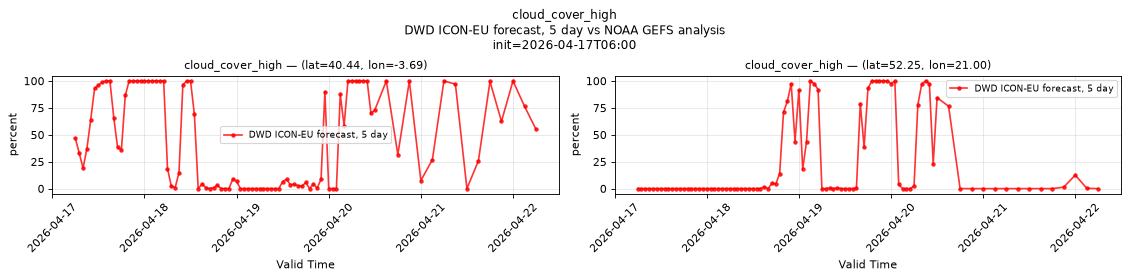
Temporal — init=2026-04-17T06:00
| Source | min | mean | max |
|---|---|---|---|
| P1 Validation | 0 | 45.69 | 100 |
| P2 Validation | 0 | 24.16 | 100 |
Availability — 762 of 762 positions complete; nulls P1 0/70866, P2 0/70866
cloud_cover_low
Metadata
| Field | Value |
|---|---|
| units | percent |
| long_name | Low cloud cover |
| short_name | lcc |
| standard_name | cloud_area_fraction_in_atmosphere_layer |
| step_type | instant |
| comment | Cloud cover (800 hPa - surface). |
Point time series — 2026-02-10T00:00 - 2026-08-19T06:00
| Point | min | mean | std | max |
|---|---|---|---|---|
| P1 | 0 | 11.06 | 11.89 | 67.6 |
| P2 | 0 | 30.06 | 25.63 | 85.8 |
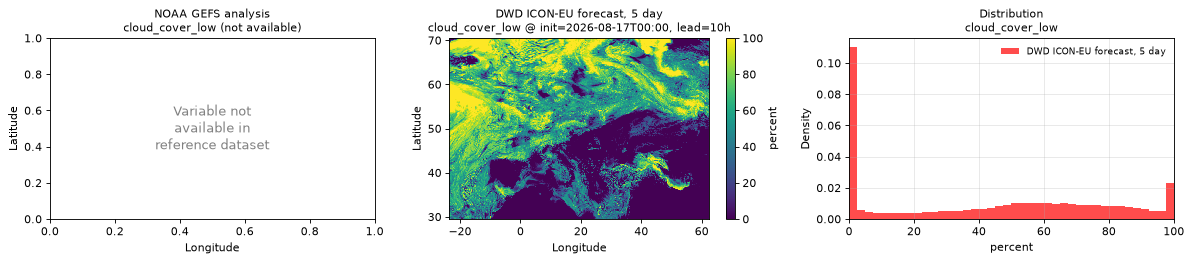
Spatial — init=2026-08-17T00:00, lead=10h (reference not available)
| Source | min | mean | max |
|---|---|---|---|
| Validation | 0 | 42.58 | 100 |
Temporal — init=2026-04-17T06:00
| Source | min | mean | max |
|---|---|---|---|
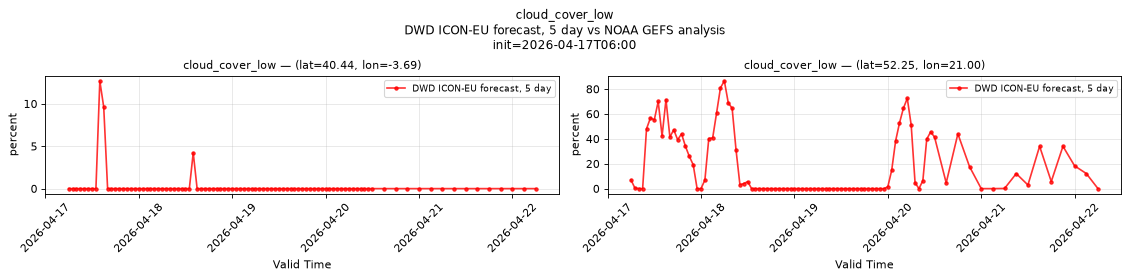
| P1 Validation | 0 | 0.2853 | 12.69 |
| P2 Validation | 0 | 18.44 | 86.5 |
Availability — 762 of 762 positions complete; nulls P1 0/70866, P2 0/70866
cloud_cover_medium
Metadata
| Field | Value |
|---|---|
| units | percent |
| long_name | Medium cloud cover |
| short_name | mcc |
| standard_name | cloud_area_fraction_in_atmosphere_layer |
| step_type | instant |
| comment | Cloud cover (400 - 800 hPa). |
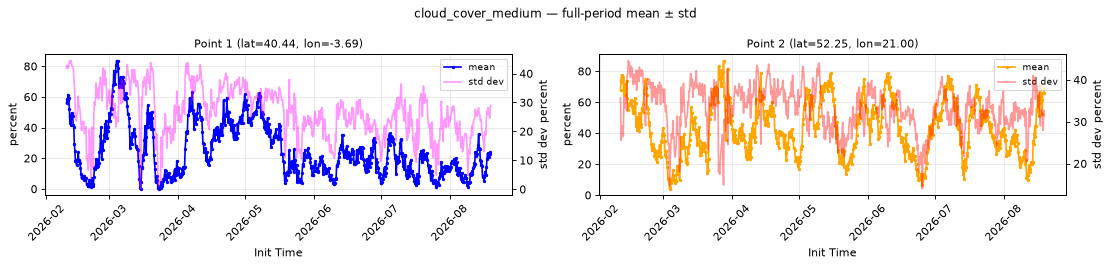
Point time series — 2026-02-10T00:00 - 2026-08-19T06:00
| Point | min | mean | std | max |
|---|---|---|---|---|
| P1 | 0.01277 | 25.05 | 26.61 | 83.69 |
| P2 | 4.033 | 43.42 | 33.13 | 86.87 |
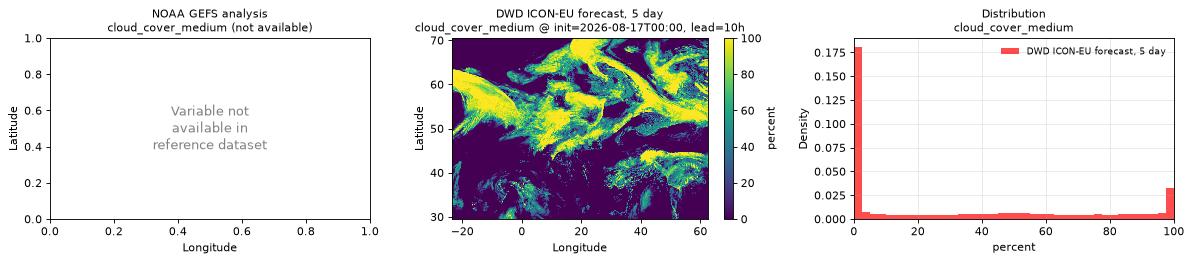
Spatial — init=2026-08-17T00:00, lead=10h (reference not available)
| Source | min | mean | max |
|---|---|---|---|
| Validation | 0 | 31.85 | 100 |
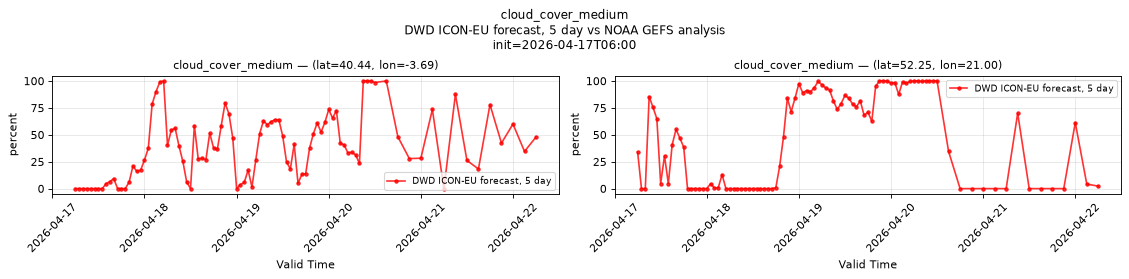
Temporal — init=2026-04-17T06:00
| Source | min | mean | max |
|---|---|---|---|
| P1 Validation | 0 | 38.6 | 100 |
| P2 Validation | 0 | 46.67 | 100 |
Availability — 762 of 762 positions complete; nulls P1 0/70866, P2 0/70866
convective_available_potential_energy_atmosphere
Metadata
| Field | Value |
|---|---|
| units | J kg-1 |
| long_name | Convective available potential energy |
| short_name | cape |
| standard_name | atmosphere_convective_available_potential_energy |
| step_type | instant |
Point time series — 2026-02-10T00:00 - 2026-08-19T06:00
| Point | min | mean | std | max |
|---|---|---|---|---|
| P1 | 0.8203 | 12.27 | 21.6 | 63.62 |
| P2 | 0.8701 | 13.44 | 23.77 | 60.75 |
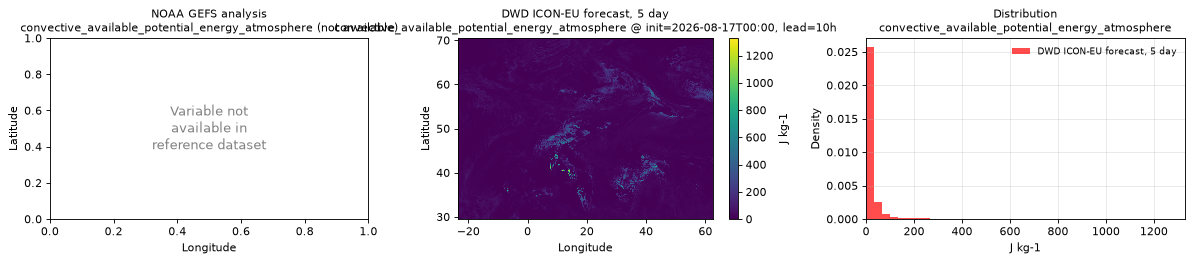
Spatial — init=2026-08-17T00:00, lead=10h (reference not available)
| Source | min | mean | max |
|---|---|---|---|
| Validation | 0 | 22.13 | 1328 |
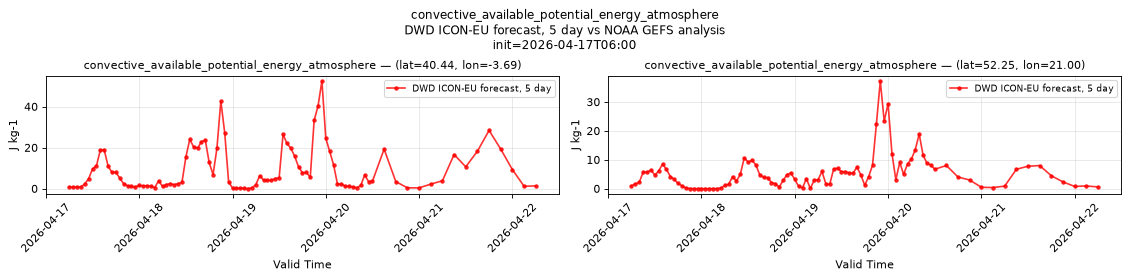
Temporal — init=2026-04-17T06:00
| Source | min | mean | max |
|---|---|---|---|
| P1 Validation | 0 | 9.164 | 52.5 |
| P2 Validation | 0 | 5.395 | 37.25 |
Availability — 762 of 762 positions complete; nulls P1 0/70866, P2 0/70866
dew_point_temperature_2m
Metadata
| Field | Value |
|---|---|
| units | degree_Celsius |
| long_name | 2 metre dewpoint temperature |
| short_name | 2d |
| standard_name | dew_point_temperature |
| step_type | instant |
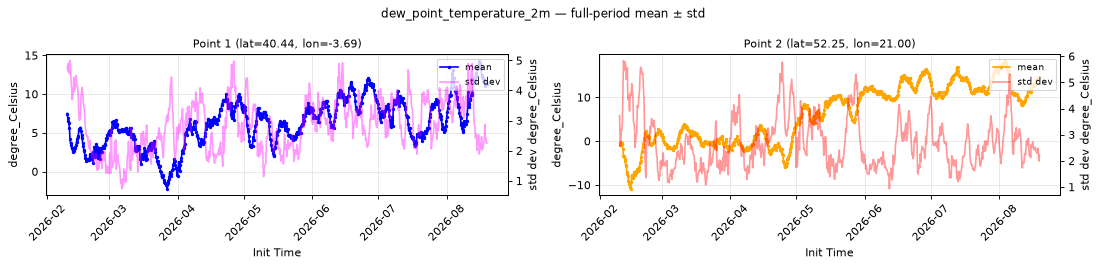
Point time series — 2026-02-10T00:00 - 2026-08-19T06:00
| Point | min | mean | std | max |
|---|---|---|---|---|
| P1 | -2.238 | 6.223 | 2.845 | 14.32 |
| P2 | -10.89 | 6.182 | 2.725 | 18.4 |
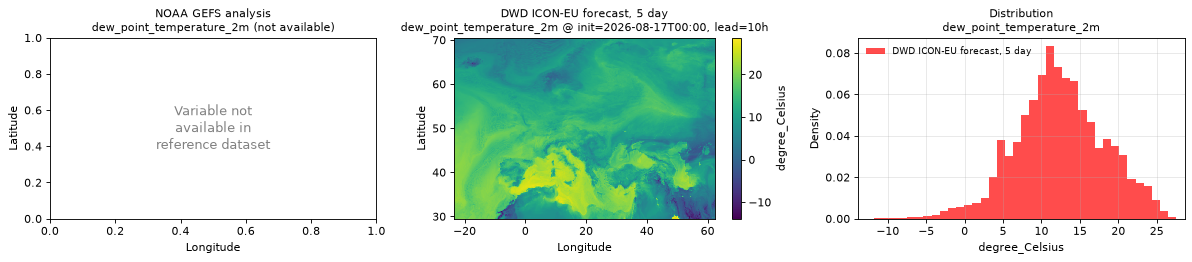
Spatial — init=2026-08-17T00:00, lead=10h (reference not available)
| Source | min | mean | max |
|---|---|---|---|
| Validation | -13.88 | 12.35 | 28.62 |
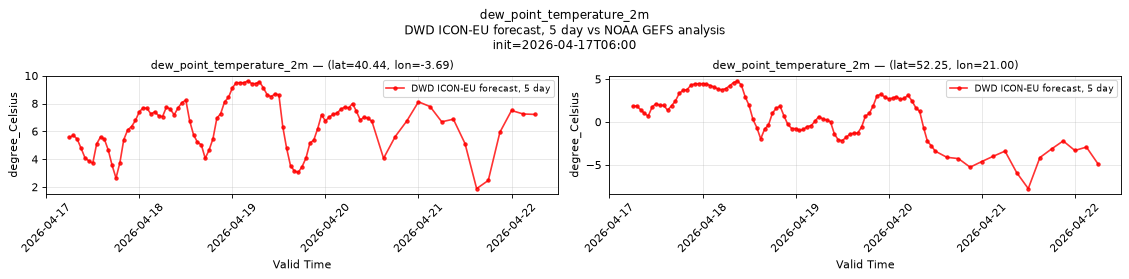
Temporal — init=2026-04-17T06:00
| Source | min | mean | max |
|---|---|---|---|
| P1 Validation | 1.883 | 6.489 | 9.625 |
| P2 Validation | -7.781 | 0.5093 | 4.781 |
Availability — 762 of 762 positions complete; nulls P1 0/70866, P2 0/70866
downward_diffuse_short_wave_radiation_flux_surface
Metadata
| Field | Value |
|---|---|
| units | W m-2 |
| long_name | Surface diffuse short-wave radiation flux |
| short_name | aswdifd_s |
| standard_name | surface_diffuse_downwelling_shortwave_flux_in_air |
| step_type | avg |
| comment | Average flux since the previous forecast step. |
Point time series — 2026-02-10T00:00 - 2026-08-19T06:00
| Point | min | mean | std | max |
|---|---|---|---|---|
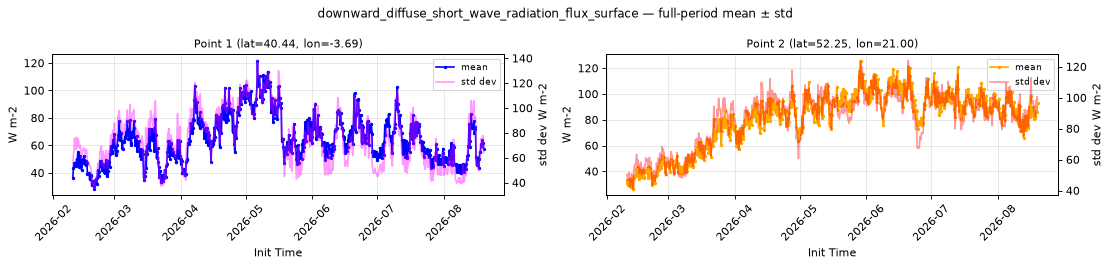
| P1 | 28.31 | 64.52 | 75.23 | 121.7 |
| P2 | 26.4 | 80.65 | 86.79 | 125.8 |
Spatial — init=2026-08-17T00:00, lead=10h (reference not available)
| Source | min | mean | max |
|---|---|---|---|
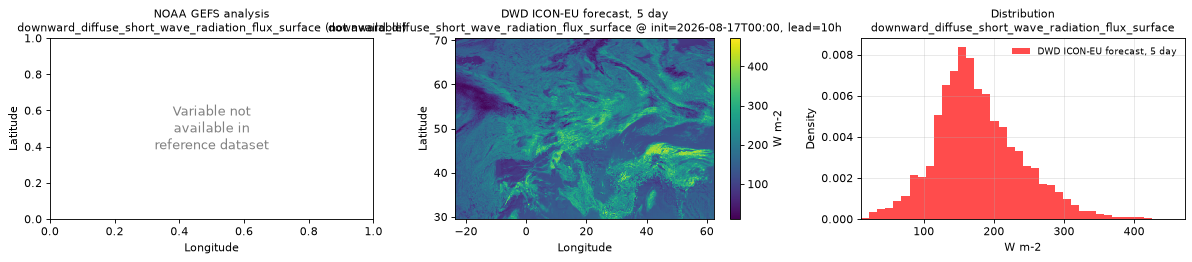
| Validation | 10.56 | 177.7 | 472 |
Temporal — init=2026-04-17T06:00
| Source | min | mean | max |
|---|---|---|---|
| P1 Validation | 0 | 82.07 | 396 |
| P2 Validation | 0 | 97.11 | 392 |
Availability — 762 of 762 positions complete; nulls P1 0/70104, P2 0/70104
downward_direct_short_wave_radiation_flux_surface
Metadata
| Field | Value |
|---|---|
| units | W m-2 |
| long_name | Surface direct short-wave radiation flux |
| short_name | aswdir_s |
| standard_name | surface_direct_downwelling_shortwave_flux_in_air |
| step_type | avg |
| comment | Average flux since the previous forecast step. |
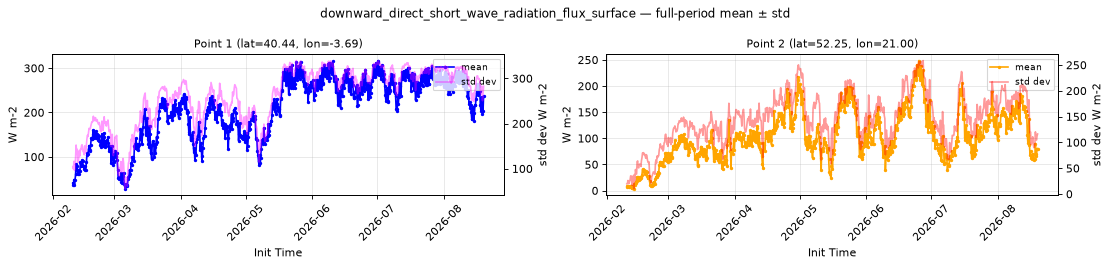
Point time series — 2026-02-10T00:00 - 2026-08-19T06:00
| Point | min | mean | std | max |
|---|---|---|---|---|
| P1 | 27.83 | 206.9 | 260.4 | 317 |
| P2 | 3.326 | 104.1 | 146.7 | 248.6 |
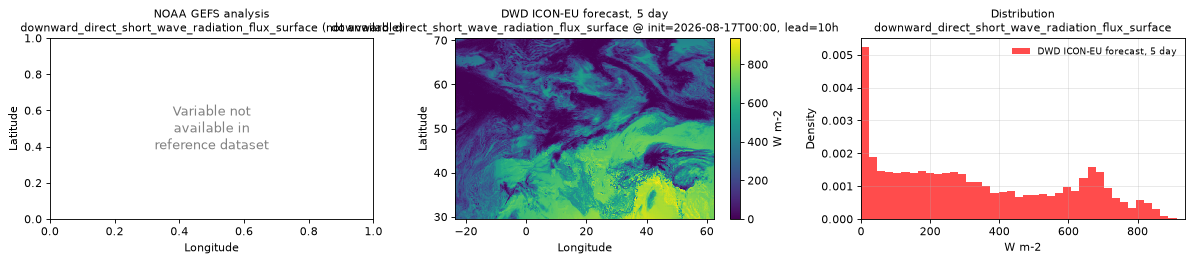
Spatial — init=2026-08-17T00:00, lead=10h (reference not available)
| Source | min | mean | max |
|---|---|---|---|
| Validation | 0 | 330.7 | 936 |
Temporal — init=2026-04-17T06:00
| Source | min | mean | max |
|---|---|---|---|
| P1 Validation | 0 | 199.7 | 740 |
| P2 Validation | 0 | 114 | 624 |
Availability — 762 of 762 positions complete; nulls P1 0/70104, P2 0/70104
precipitable_water_atmosphere
Metadata
| Field | Value |
|---|---|
| units | kg m-2 |
| long_name | Precipitable water |
| short_name | pwat |
| standard_name | atmosphere_mass_content_of_water_vapor |
| step_type | instant |
Point time series — 2026-02-10T00:00 - 2026-08-19T06:00
| Point | min | mean | std | max |
|---|---|---|---|---|
| P1 | 7.445 | 16.91 | 3.301 | 28.21 |
| P2 | 5.406 | 18.44 | 4.31 | 37.51 |
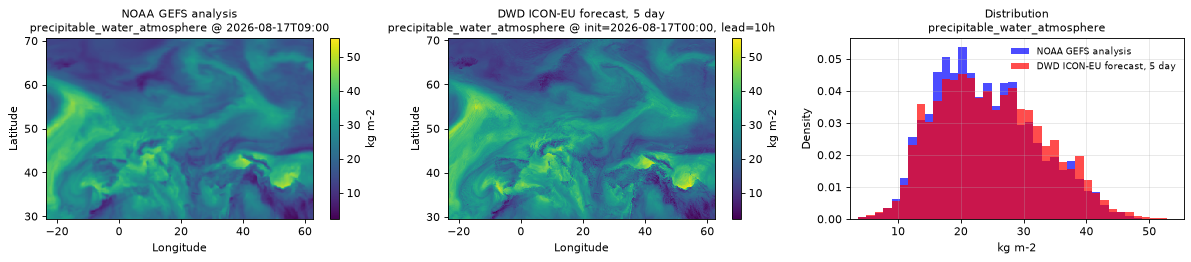
Spatial — init=2026-08-17T00:00, lead=10h (reference at 2026-08-17T09:00)
| Source | min | mean | max |
|---|---|---|---|
| Validation | 2.312 | 24.68 | 55.5 |
| Reference | 3.406 | 23.84 | 50.5 |
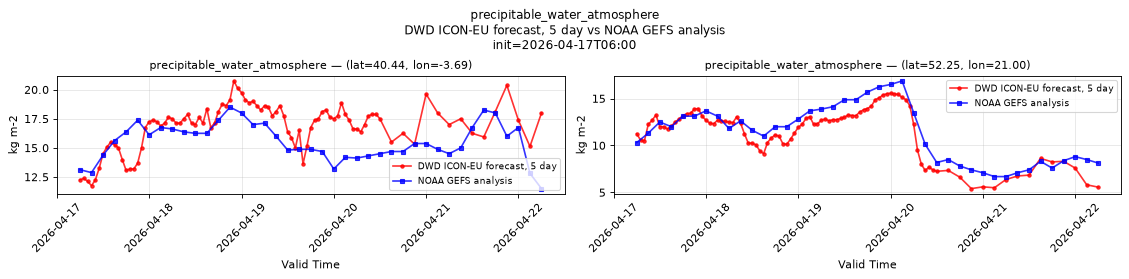
Temporal — init=2026-04-17T06:00
| Source | min | mean | max |
|---|---|---|---|
| P1 Validation | 11.75 | 16.82 | 20.75 |
| P1 Reference | 11.5 | 15.52 | 18.5 |
| P2 Validation | 5.406 | 11.41 | 15.56 |
| P2 Reference | 6.688 | 11.22 | 16.88 |
Availability — 762 of 762 positions complete; nulls P1 0/70866, P2 0/70866
precipitation_surface
Metadata
| Field | Value |
|---|---|
| units | kg m-2 s-1 |
| long_name | Precipitation rate |
| short_name | prate |
| standard_name | precipitation_flux |
| step_type | avg |
| comment | Average precipitation rate since the previous forecast step. Units equivalent to mm/s. |
Point time series — 2026-02-10T00:00 - 2026-08-19T06:00
| Point | min | mean | std | max |
|---|---|---|---|---|
| P1 | 0 | 8.7e-06 | 2.252e-05 | 0.0001689 |
| P2 | 0 | 1.756e-05 | 5.402e-05 | 0.0002163 |
Spatial — init=2026-08-17T00:00, lead=10h (reference at 2026-08-17T09:00)
| Source | min | mean | max |
|---|---|---|---|
| Validation | 0 | 2.169e-05 | 0.002861 |
| Reference | 0 | 1.89e-05 | 0.001595 |
Temporal — init=2026-04-17T06:00
| Source | min | mean | max |
|---|---|---|---|
| P1 Validation | 0 | 2.357e-08 | 1.084e-06 |
| P1 Reference | 0 | 2.234e-06 | 4.625e-05 |
| P2 Validation | 0 | 5.892e-08 | 2.168e-06 |
| P2 Reference | 0 | 1.534e-06 | 3.886e-05 |
Availability — 762 of 762 positions complete; nulls P1 0/70104, P2 0/70104
pressure_reduced_to_mean_sea_level
Metadata
| Field | Value |
|---|---|
| units | Pa |
| long_name | Pressure reduced to MSL |
| short_name | prmsl |
| standard_name | air_pressure_at_mean_sea_level |
| step_type | instant |
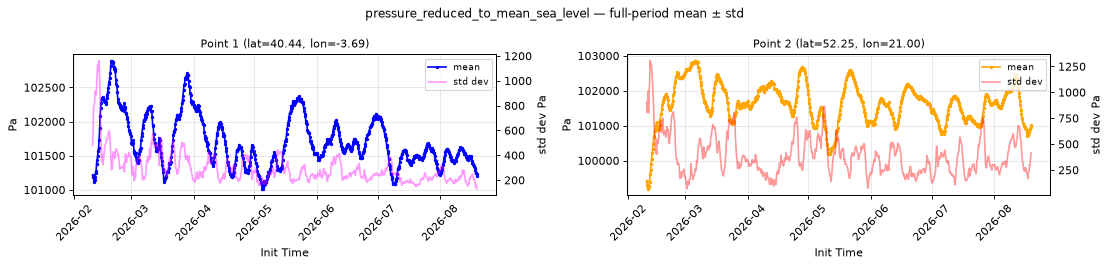
Point time series — 2026-02-10T00:00 - 2026-08-19T06:00
| Point | min | mean | std | max |
|---|---|---|---|---|
| P1 | 1.01e+05 | 1.017e+05 | 296.7 | 1.029e+05 |
| P2 | 9.919e+04 | 1.016e+05 | 386.9 | 1.029e+05 |
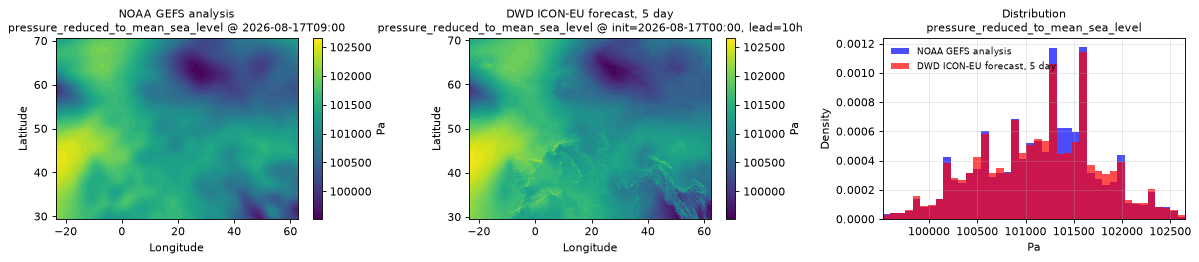
Spatial — init=2026-08-17T00:00, lead=10h (reference at 2026-08-17T09:00)
| Source | min | mean | max |
|---|---|---|---|
| Validation | 9.952e+04 | 1.011e+05 | 1.027e+05 |
| Reference | 9.952e+04 | 1.012e+05 | 1.026e+05 |
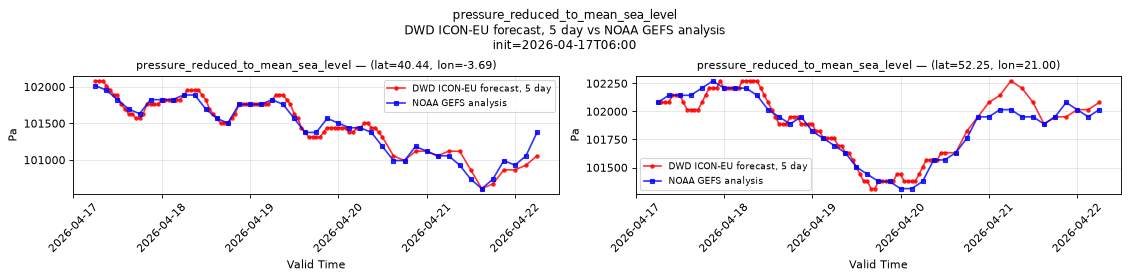
Temporal — init=2026-04-17T06:00
| Source | min | mean | max |
|---|---|---|---|
| P1 Validation | 1.006e+05 | 1.016e+05 | 1.021e+05 |
| P1 Reference | 1.006e+05 | 1.014e+05 | 1.02e+05 |
| P2 Validation | 1.013e+05 | 1.019e+05 | 1.023e+05 |
| P2 Reference | 1.013e+05 | 1.019e+05 | 1.023e+05 |
Availability — 762 of 762 positions complete; nulls P1 0/70866, P2 0/70866
pressure_surface
Metadata
| Field | Value |
|---|---|
| units | Pa |
| long_name | Surface pressure |
| short_name | sp |
| standard_name | surface_air_pressure |
| step_type | instant |
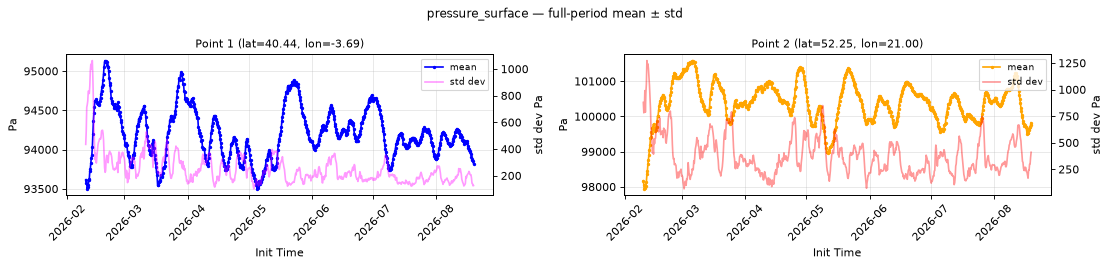
Point time series — 2026-02-10T00:00 - 2026-08-19T06:00
| Point | min | mean | std | max |
|---|---|---|---|---|
| P1 | 9.35e+04 | 9.421e+04 | 254.2 | 9.513e+04 |
| P2 | 9.794e+04 | 1.004e+05 | 379.2 | 1.016e+05 |
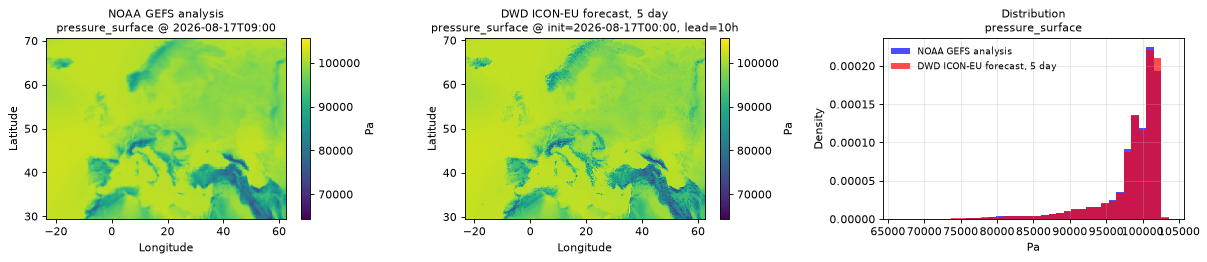
Spatial — init=2026-08-17T00:00, lead=10h (reference at 2026-08-17T09:00)
| Source | min | mean | max |
|---|---|---|---|
| Validation | 6.435e+04 | 9.858e+04 | 1.057e+05 |
| Reference | 7.206e+04 | 9.857e+04 | 1.026e+05 |
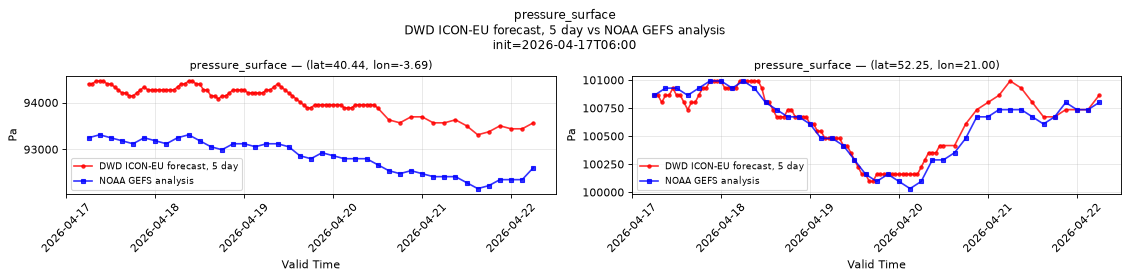
Temporal — init=2026-04-17T06:00
| Source | min | mean | max |
|---|---|---|---|
| P1 Validation | 9.331e+04 | 9.409e+04 | 9.446e+04 |
| P1 Reference | 9.216e+04 | 9.283e+04 | 9.331e+04 |
| P2 Validation | 1.001e+05 | 1.006e+05 | 1.01e+05 |
| P2 Reference | 1e+05 | 1.006e+05 | 1.01e+05 |
Availability — 762 of 762 positions complete; nulls P1 0/70866, P2 0/70866
relative_humidity_2m
Metadata
| Field | Value |
|---|---|
| units | percent |
| long_name | 2 metre relative humidity |
| short_name | 2r |
| standard_name | relative_humidity |
| step_type | instant |
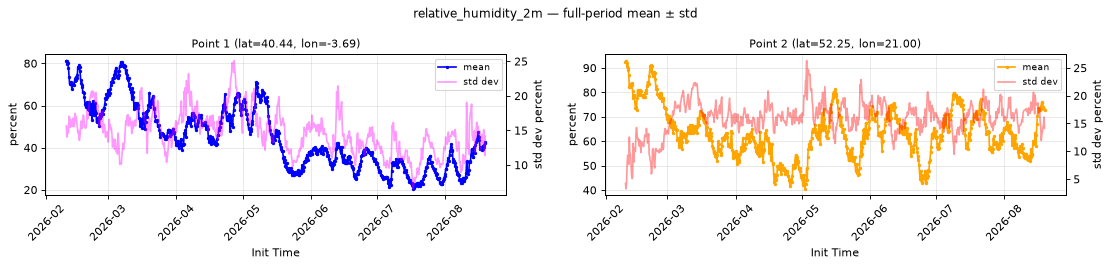
Point time series — 2026-02-10T00:00 - 2026-08-19T06:00
| Point | min | mean | std | max |
|---|---|---|---|---|
| P1 | 20.44 | 45.06 | 14.83 | 81.35 |
| P2 | 40.5 | 63.28 | 16.01 | 92.98 |
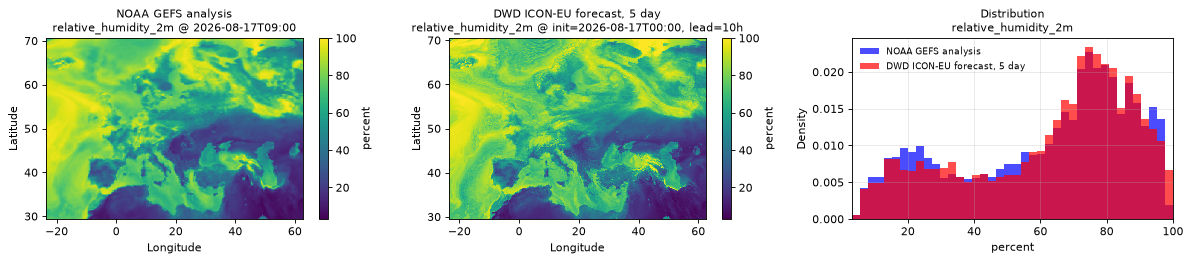
Spatial — init=2026-08-17T00:00, lead=10h (reference at 2026-08-17T09:00)
| Source | min | mean | max |
|---|---|---|---|
| Validation | 3.125 | 62.9 | 100 |
| Reference | 4.156 | 61.27 | 99.5 |
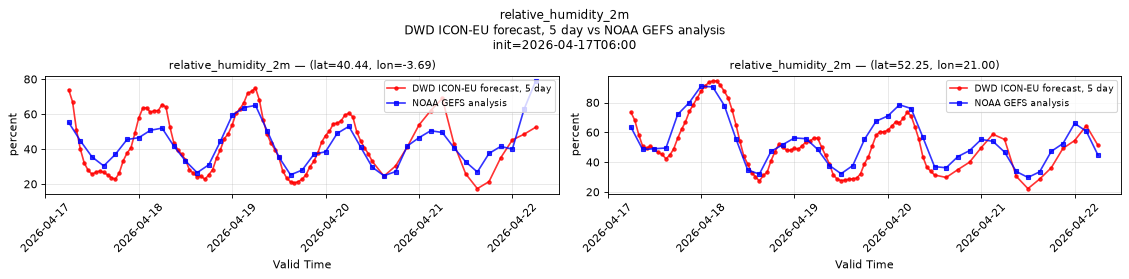
Temporal — init=2026-04-17T06:00
| Source | min | mean | max |
|---|---|---|---|
| P1 Validation | 17.38 | 42.93 | 75 |
| P1 Reference | 24.75 | 42.72 | 79 |
| P2 Validation | 22.25 | 52.48 | 94.5 |
| P2 Reference | 29.75 | 53.79 | 91 |
Availability — 762 of 762 positions complete; nulls P1 0/70866, P2 0/70866
snow_thickness_surface
Metadata
| Field | Value |
|---|---|
| units | m |
| long_name | Snow depth |
| short_name | sde |
| standard_name | surface_snow_thickness |
| step_type | instant |
Point time series — 2026-02-10T00:00 - 2026-08-19T06:00
| Point | min | mean | std | max |
|---|---|---|---|---|
| P1 | 0 | 0 | 0 | 0 |
| P2 | 0 | 0.005387 | 0.0009189 | 0.1408 |
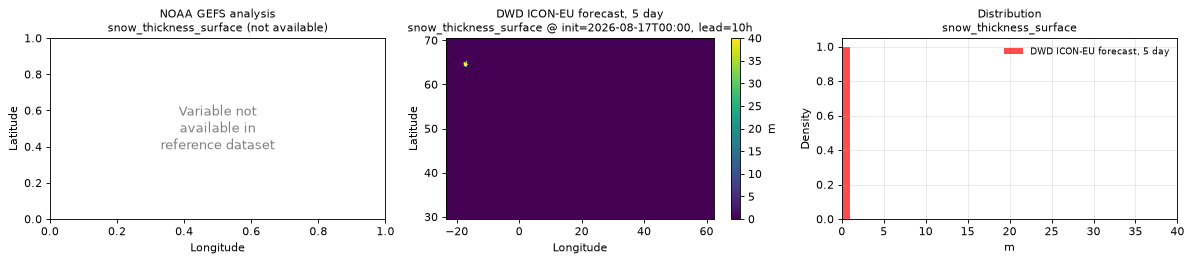
Spatial — init=2026-08-17T00:00, lead=10h (reference not available)
| Source | min | mean | max |
|---|---|---|---|
| Validation | 0 | 0.01634 | 40 |
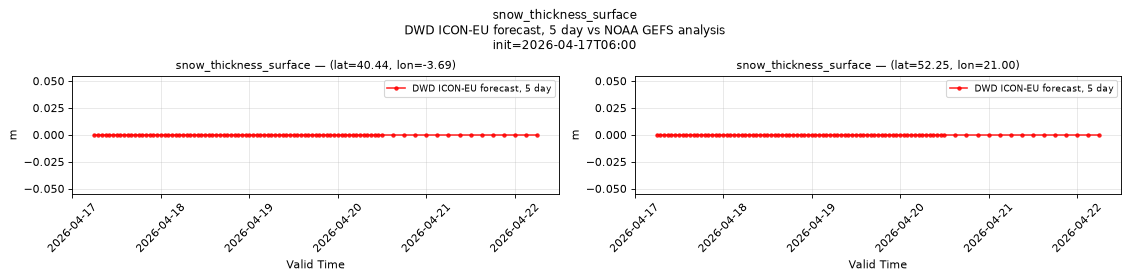
Temporal — init=2026-04-17T06:00
| Source | min | mean | max |
|---|---|---|---|
| P1 Validation | 0 | 0 | 0 |
| P2 Validation | 0 | 0 | 0 |
Availability — 762 of 762 positions complete; nulls P1 0/70866, P2 0/70866
snow_water_equivalent_surface
Metadata
| Field | Value |
|---|---|
| units | m |
| long_name | Snow depth water equivalent |
| short_name | sd |
| standard_name | lwe_thickness_of_surface_snow_amount |
| step_type | instant |
| comment | Set to 0 over water surfaces and snow-free land points. |
Point time series — 2026-02-10T00:00 - 2026-08-19T06:00
| Point | min | mean | std | max |
|---|---|---|---|---|
| P1 | 0 | 0 | 0 | 0 |
| P2 | 0 | 0.001825 | 0.0002238 | 0.05014 |
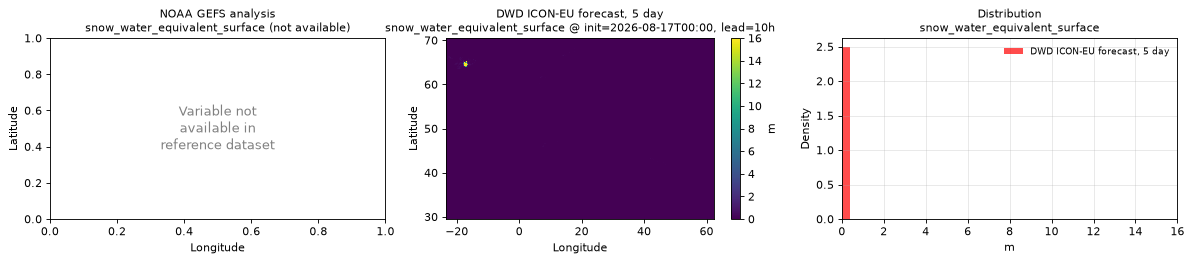
Spatial — init=2026-08-17T00:00, lead=10h (reference not available)
| Source | min | mean | max |
|---|---|---|---|
| Validation | 0 | 0.006518 | 16 |
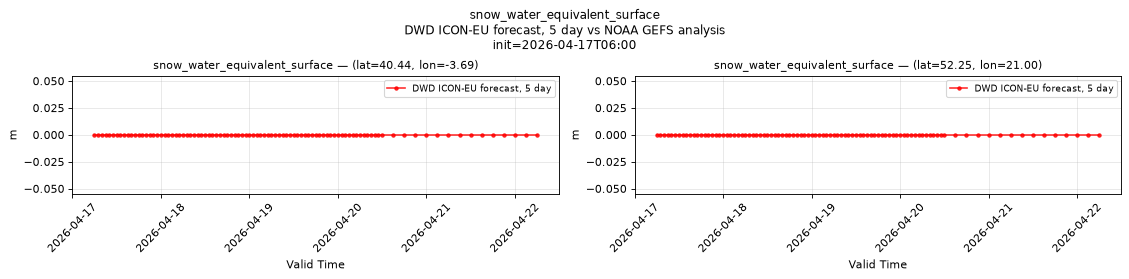
Temporal — init=2026-04-17T06:00
| Source | min | mean | max |
|---|---|---|---|
| P1 Validation | 0 | 0 | 0 |
| P2 Validation | 0 | 0 | 0 |
Availability — 762 of 762 positions complete; nulls P1 0/70866, P2 0/70866
temperature_2m
Metadata
| Field | Value |
|---|---|
| units | degree_Celsius |
| long_name | 2 metre temperature |
| short_name | 2t |
| standard_name | air_temperature |
| step_type | instant |
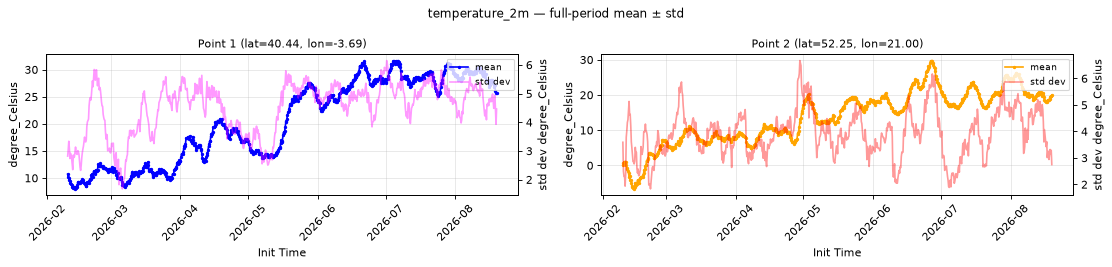
Point time series — 2026-02-10T00:00 - 2026-08-19T06:00
| Point | min | mean | std | max |
|---|---|---|---|---|
| P1 | 8.005 | 20.44 | 4.501 | 31.67 |
| P2 | -6.635 | 13.82 | 3.924 | 29.76 |
Spatial — init=2026-08-17T00:00, lead=10h (reference at 2026-08-17T09:00)
| Source | min | mean | max |
|---|---|---|---|
| Validation | -1 | 21.87 | 51.25 |
| Reference | 1.453 | 21.46 | 49.75 |
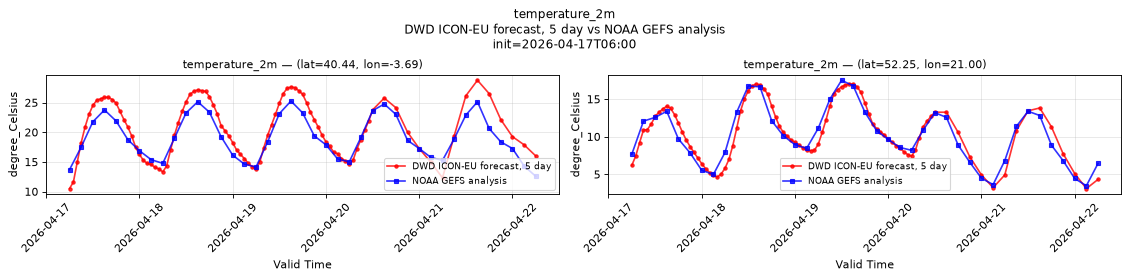
Temporal — init=2026-04-17T06:00
| Source | min | mean | max |
|---|---|---|---|
| P1 Validation | 10.5 | 20.41 | 28.75 |
| P1 Reference | 12.56 | 19.13 | 25.25 |
| P2 Validation | 3.094 | 10.68 | 17 |
| P2 Reference | 3.469 | 10.08 | 17.5 |
Availability — 762 of 762 positions complete; nulls P1 0/70866, P2 0/70866
total_cloud_cover_atmosphere
Metadata
| Field | Value |
|---|---|
| units | percent |
| long_name | Total cloud cover |
| short_name | tcc |
| standard_name | cloud_area_fraction |
| step_type | instant |
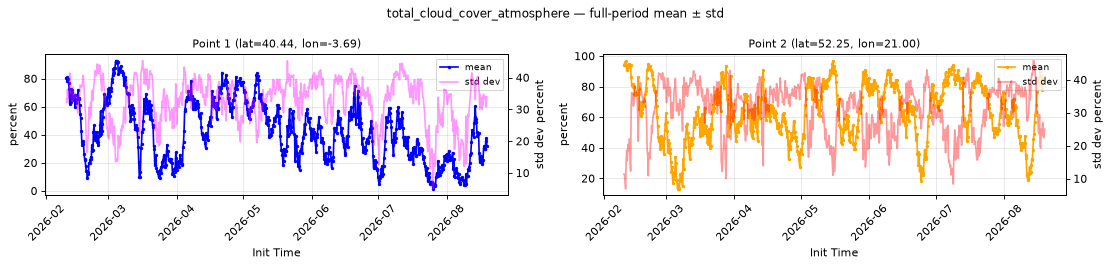
Point time series — 2026-02-10T00:00 - 2026-08-19T06:00
| Point | min | mean | std | max |
|---|---|---|---|---|
| P1 | 1.397 | 42.63 | 32.78 | 92.79 |
| P2 | 13.1 | 63.95 | 31.05 | 96.98 |
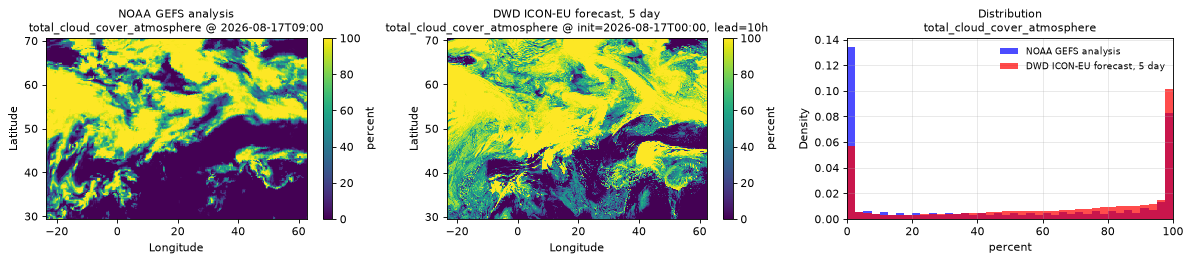
Spatial — init=2026-08-17T00:00, lead=10h (reference at 2026-08-17T09:00)
| Source | min | mean | max |
|---|---|---|---|
| Validation | 0 | 61.91 | 100 |
| Reference | 0 | 45.66 | 100 |
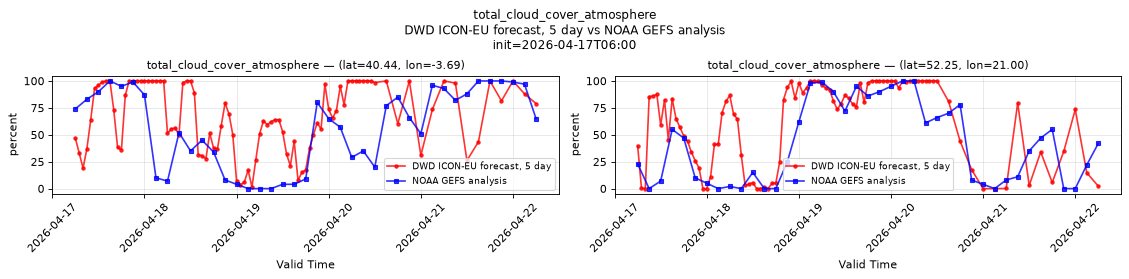
Temporal — init=2026-04-17T06:00
| Source | min | mean | max |
|---|---|---|---|
| P1 Validation | 1.445 | 66.4 | 100 |
| P1 Reference | 0 | 56.71 | 100 |
| P2 Validation | 0 | 60.73 | 100 |
| P2 Reference | 0 | 41.05 | 100 |
Availability — 762 of 762 positions complete; nulls P1 0/70866, P2 0/70866
wind_gust_10m
Metadata
| Field | Value |
|---|---|
| units | m s-1 |
| long_name | Maximum 10 metre wind gust since previous post-processing |
| short_name | 10fg |
| standard_name | wind_speed_of_gust |
| step_type | max |
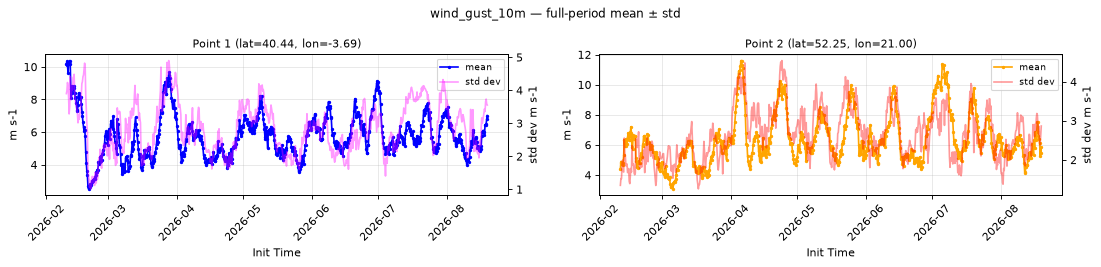
Point time series — 2026-02-10T00:00 - 2026-08-19T06:00
| Point | min | mean | std | max |
|---|---|---|---|---|
| P1 | 2.521 | 5.766 | 2.853 | 10.39 |
| P2 | 3.079 | 6.379 | 2.642 | 11.61 |
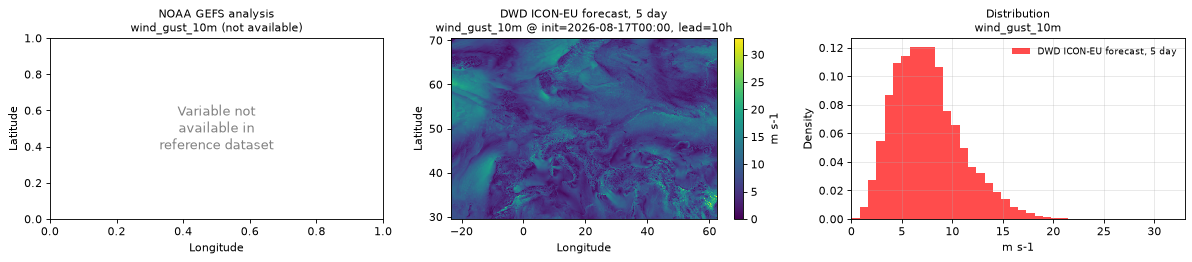
Spatial — init=2026-08-17T00:00, lead=10h (reference not available)
| Source | min | mean | max |
|---|---|---|---|
| Validation | 0 | 7.563 | 33 |
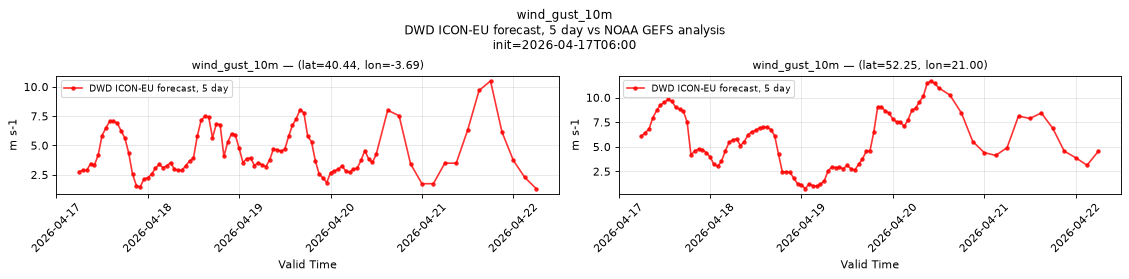
Temporal — init=2026-04-17T06:00
| Source | min | mean | max |
|---|---|---|---|
| P1 Validation | 1.312 | 4.375 | 10.5 |
| P2 Validation | 0.75 | 5.786 | 11.69 |
Availability — 762 of 762 positions complete; nulls P1 0/70104, P2 0/70104
wind_u_10m
Metadata
| Field | Value |
|---|---|
| units | m s-1 |
| long_name | 10 metre U wind component |
| short_name | 10u |
| standard_name | eastward_wind |
| step_type | instant |
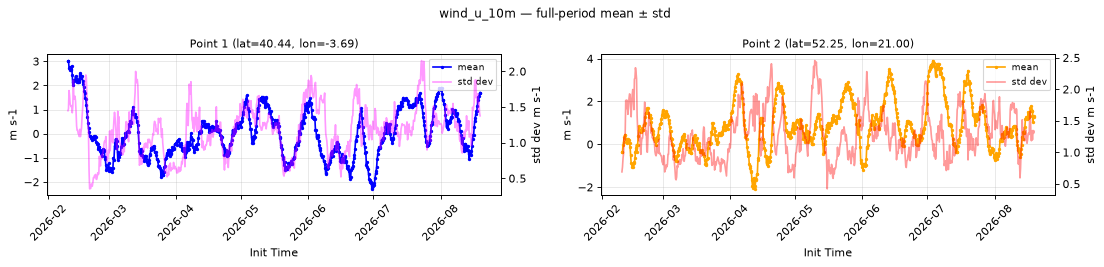
Point time series — 2026-02-10T00:00 - 2026-08-19T06:00
| Point | min | mean | std | max |
|---|---|---|---|---|
| P1 | -2.287 | 0.01631 | 1.186 | 3.031 |
| P2 | -2.082 | 0.8696 | 1.291 | 3.907 |
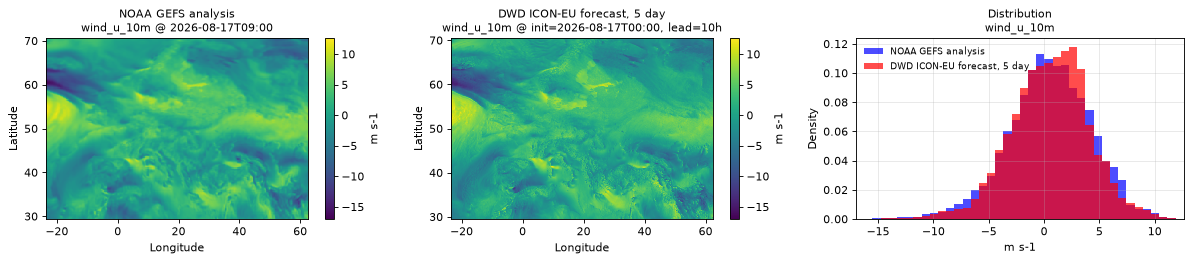
Spatial — init=2026-08-17T00:00, lead=10h (reference at 2026-08-17T09:00)
| Source | min | mean | max |
|---|---|---|---|
| Validation | -14.88 | 0.5231 | 12.62 |
| Reference | -17 | 0.5042 | 12.5 |
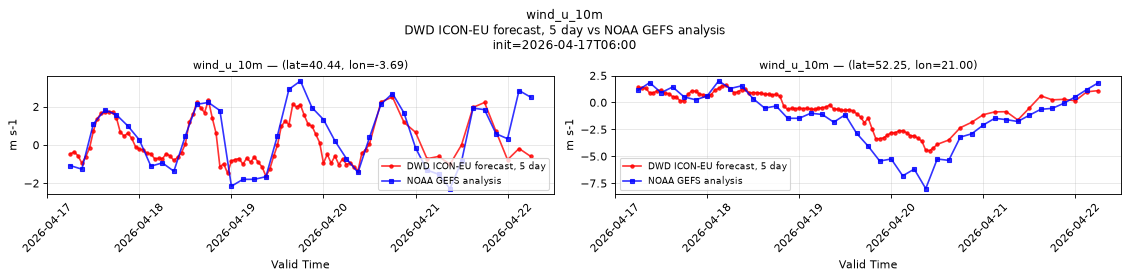
Temporal — init=2026-04-17T06:00
| Source | min | mean | max |
|---|---|---|---|
| P1 Validation | -1.633 | 0.1375 | 2.5 |
| P1 Reference | -2.281 | 0.44 | 3.344 |
| P2 Validation | -4.469 | -0.5374 | 1.617 |
| P2 Reference | -8 | -1.419 | 2 |
Availability — 762 of 762 positions complete; nulls P1 0/70866, P2 0/70866
wind_v_10m
Metadata
| Field | Value |
|---|---|
| units | m s-1 |
| long_name | 10 metre V wind component |
| short_name | 10v |
| standard_name | northward_wind |
| step_type | instant |
Point time series — 2026-02-10T00:00 - 2026-08-19T06:00
| Point | min | mean | std | max |
|---|---|---|---|---|
| P1 | -3.342 | 0.001309 | 1.308 | 1.684 |
| P2 | -2.901 | -0.3243 | 1.322 | 1.817 |
Spatial — init=2026-08-17T00:00, lead=10h (reference at 2026-08-17T09:00)
| Source | min | mean | max |
|---|---|---|---|
| Validation | -16.12 | -0.6665 | 15.06 |
| Reference | -15.75 | -0.661 | 13.75 |
Temporal — init=2026-04-17T06:00
| Source | min | mean | max |
|---|---|---|---|
| P1 Validation | -2.109 | 0.2438 | 3.75 |
| P1 Reference | -2.406 | 0.5647 | 3.594 |
| P2 Validation | -3.594 | -1.348 | 0.9141 |
| P2 Reference | -5.5 | -2.19 | 1.078 |
Availability — 762 of 762 positions complete; nulls P1 0/70866, P2 0/70866