Knowing the moment a forecast is ready
Forecast production is a factory assembly line, a fulfillment center, and a delivery route all in one. Lewis Fry Richardson's Weather Forecasting Factory was not too far off.

Every dataset in the dynamical.org catalog (so far) is downstream of a model run that someone else produces on their own cadence. And the initialization is just the beginning (literally and philosophically). Then the files start landing, one by one, eventually trickling in over tens of minutes (or even hours) rather than appearing all at once. If your pipeline depends on that data, you have two bad options: pretend you can divine a cron schedule that will "always work," or poll wildly.
And to add to that, we had questions like:
- How often does the full GEFS run complete "late"?
- What does "late" even mean? What is the spread of the min to the max latencies from init?
- What does the rollout of a forecast look like, file by file, minute by minute?
- How do different delivery routes (read: file destinations) impact latency?
We sought to answer these questions and many more so that the dynamical.org catalog would be resilient, low-latency, and designed around the minute details of its upstream sources. The prompt for actually sitting down and answering them was a question Will Hobbs posted on LinkedIn about NOAA model file availability.
So, we built a tool called wxopticon to remove that guesswork (I pronounce it "waxopticon", and I say it in a slightly mischievous voice and picture Saruman reaching for the Palantir — no, not THAT Palantir. Oh never mind). It watches upstream weather sources and dynamical.org's own catalog stores, and it answers three operational questions:
- When can I expect lead-group X dataset Y?
- Was this run on time?
- Is this in-flight run trending on time?
You can see all of this on the pipeline status page.
The second component is a system that enables consumers to create subscriptions (via webhooks, Slack notifications, etc.) to meaningful events (e.g., "notify me when IFS ENS progress:f024 is complete" or "warn me when GEFS on AWS looks like it might arrive late").
How it works, briefly
wxopticon is a set of stateless functions over a single append-only event log in object storage. The log is the source of truth, and everything else (the dashboard, status and timing, the readiness milestones) is a pure replay of it.
A lean detection scan runs every two minutes: it replays the log to find the runs still expected, probes their upstream locations, appends any new state transitions, and fans each new milestone out to subscribers. A separate summarize pass runs every five minutes to refresh the status feed and seed "delayed" signals. For products with a notification stream (e.g., AWS SNS), a continuous listener catches arrivals within seconds instead of waiting for the next scan.
What a year of arrivals actually looks like
Because every arrival is in the log, we can replay the whole dang thing. Over the last year, wxopticon recorded roughly 1.9 million file arrivals across 9,150 completed product-runs of thirteen upstream feeds.
A run arrives over time. The moment a run starts and the moment it's complete can be many hours apart, and the shape of that arrival looks different for every model.
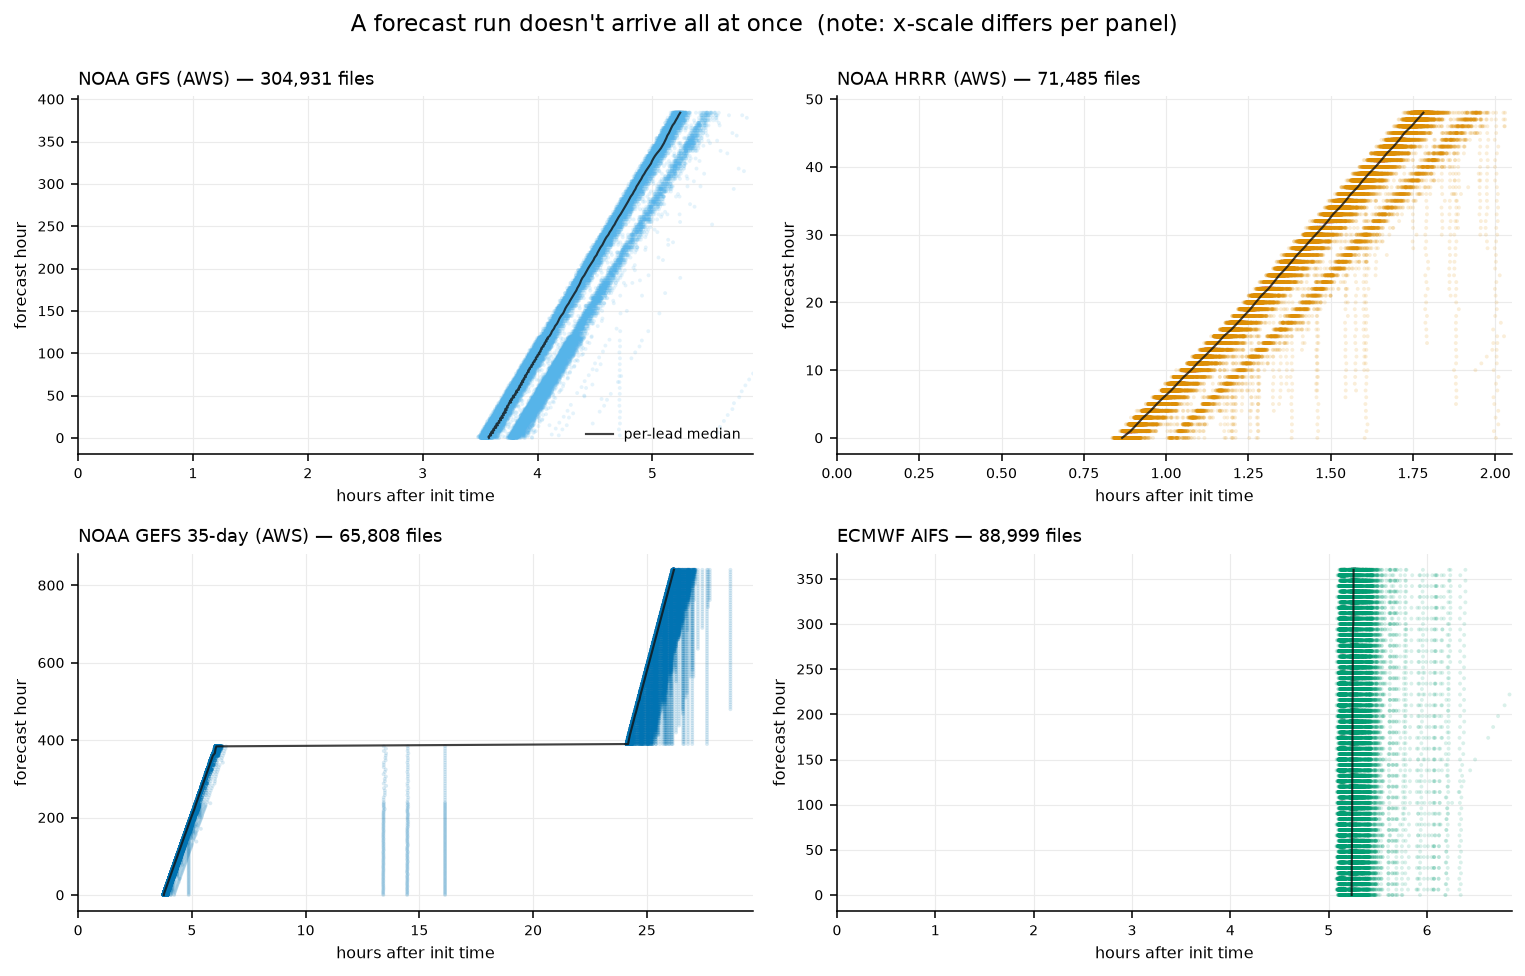
This is why "ready" is a series of milestones; a short-range consumer can start using GEFS the instant the early lead groups land, long before the full run completes.
The feeds are punctualish! Measured from init time to the last file of the run, the median completion time is about 1h47m for HRRR, 3h37m for DWD's ICON-EU, 5h15m for AIFS, 5h22m for GFS, and a full ~26h for GEFS's 35-day run.
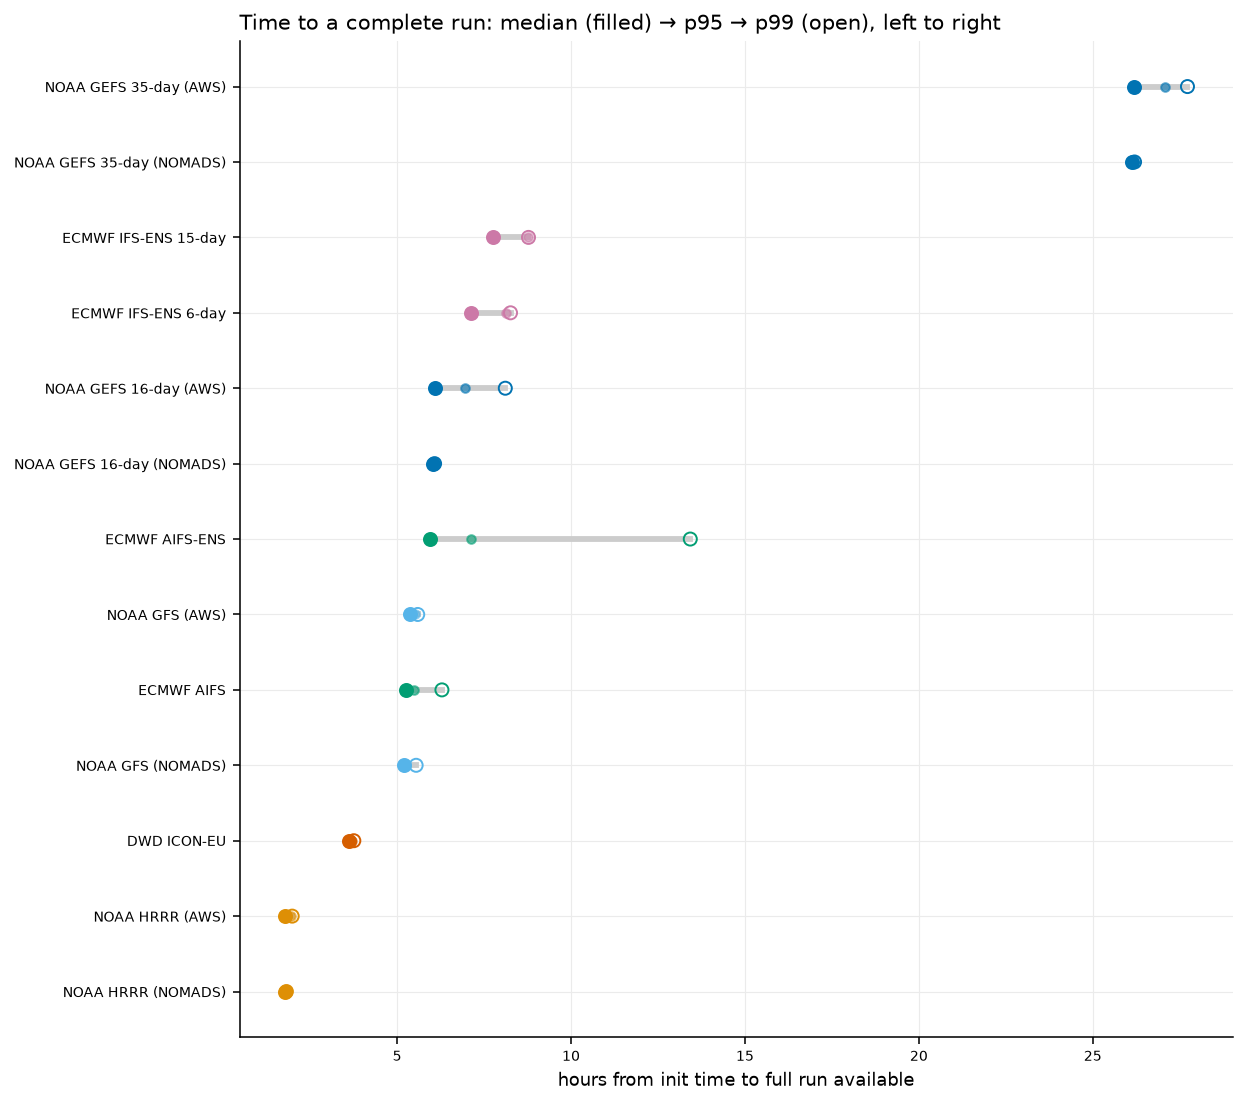
GFS completes within a 13-minute band from its median to its 99th percentile, run after run. Regularity is exactly what makes a learned next-run expectation meaningful. A "late" signal is useful because on-time performance is so consistent.
What "ready" actually means
wxopticon models each run's progress as a sequence of readiness boundaries. Rather than a single "done" flag, a run crosses named milestones as its lead hours become available:
| kind | fires when |
|---|---|
progress |
every lead ≤ an intermediate lead-group horizon is available (e.g., progress:f240) |
complete |
the full run is available — you don't need to know group names |
in_flight |
a still-running run is behind its learned schedule |
advisory |
the upstream agency opens or resolves a dissemination advisory |
That table describes events, not run states. We initially mixed those concepts
together, which made it hard to say whether delayed meant "still running" or
"finished, but late." The current model has two orthogonal axes:
statusis lifecycle:pending,in_flight,complete,failed, orunobserved.timingis the judgment:on_timeordelayed, when there is enough history to make one.
I went back and forth on the correct threshold for "delayed." Our first pass split the question in two: an in-flight run was delayed at p95 plus one minute, while a completed run was judged against p99. Raw p95 was obviously too harsh: by definition, it would flag roughly one ordinary run in twenty. But adding one minute still hugged very consistent feeds too tightly, and p99 was a volatile tail statistic answering a different question.
We replayed a year of arrivals and compared several buffers above p95:
- a fixed 30 minutes, which ignores whether a product normally takes two hours or twenty-six;
- ten percent of p50, which scales with typical latency but not with the distribution's actual width;
p95 + (p95 - p50), which adapts to dispersion but collapses back toward p95 on a very tight feed.
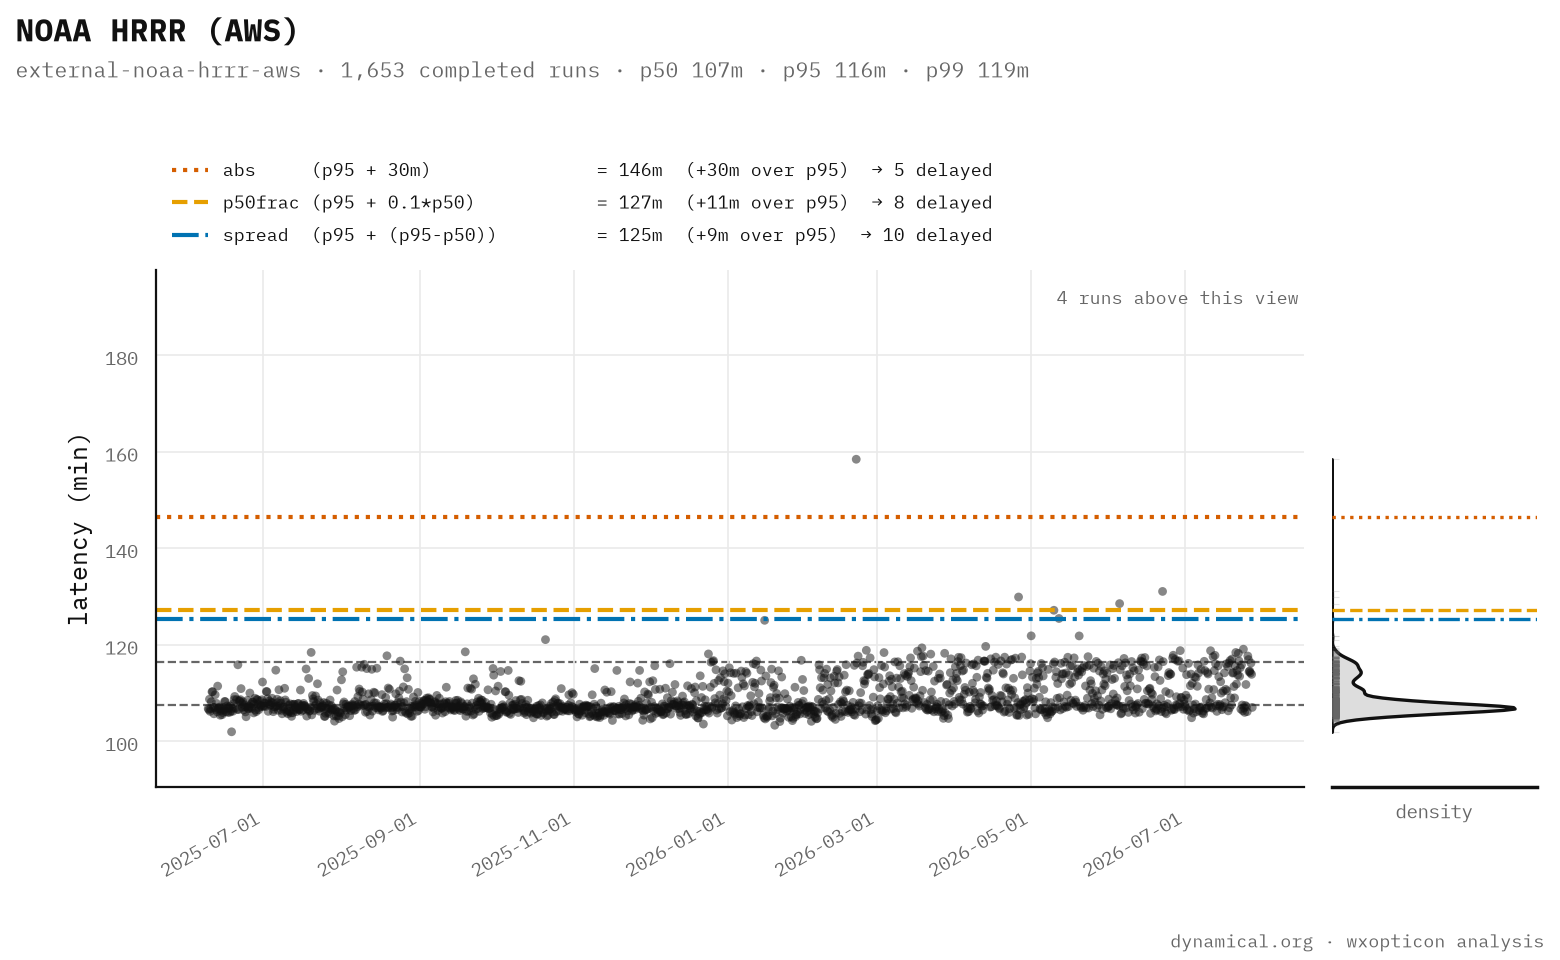
The challenge was to come up with something formulaic that behaved sensibly across tight and wide distributions. What worked best was something not on our original list: a dispersion buffer with a floor:
spreadf = p95 + max(p95 - p50, 15 minutes)
Each product gets its own spreadf from a trailing 90-day window. Each lead
group gets one too. This is useful: if GFS is still working toward
day 10 after its day-10 group would normally be ready, wxopticon can mark the
run in_flight and delayed before the full 16-day run reaches its later
deadline. The event names the lead group that triggered the warning.
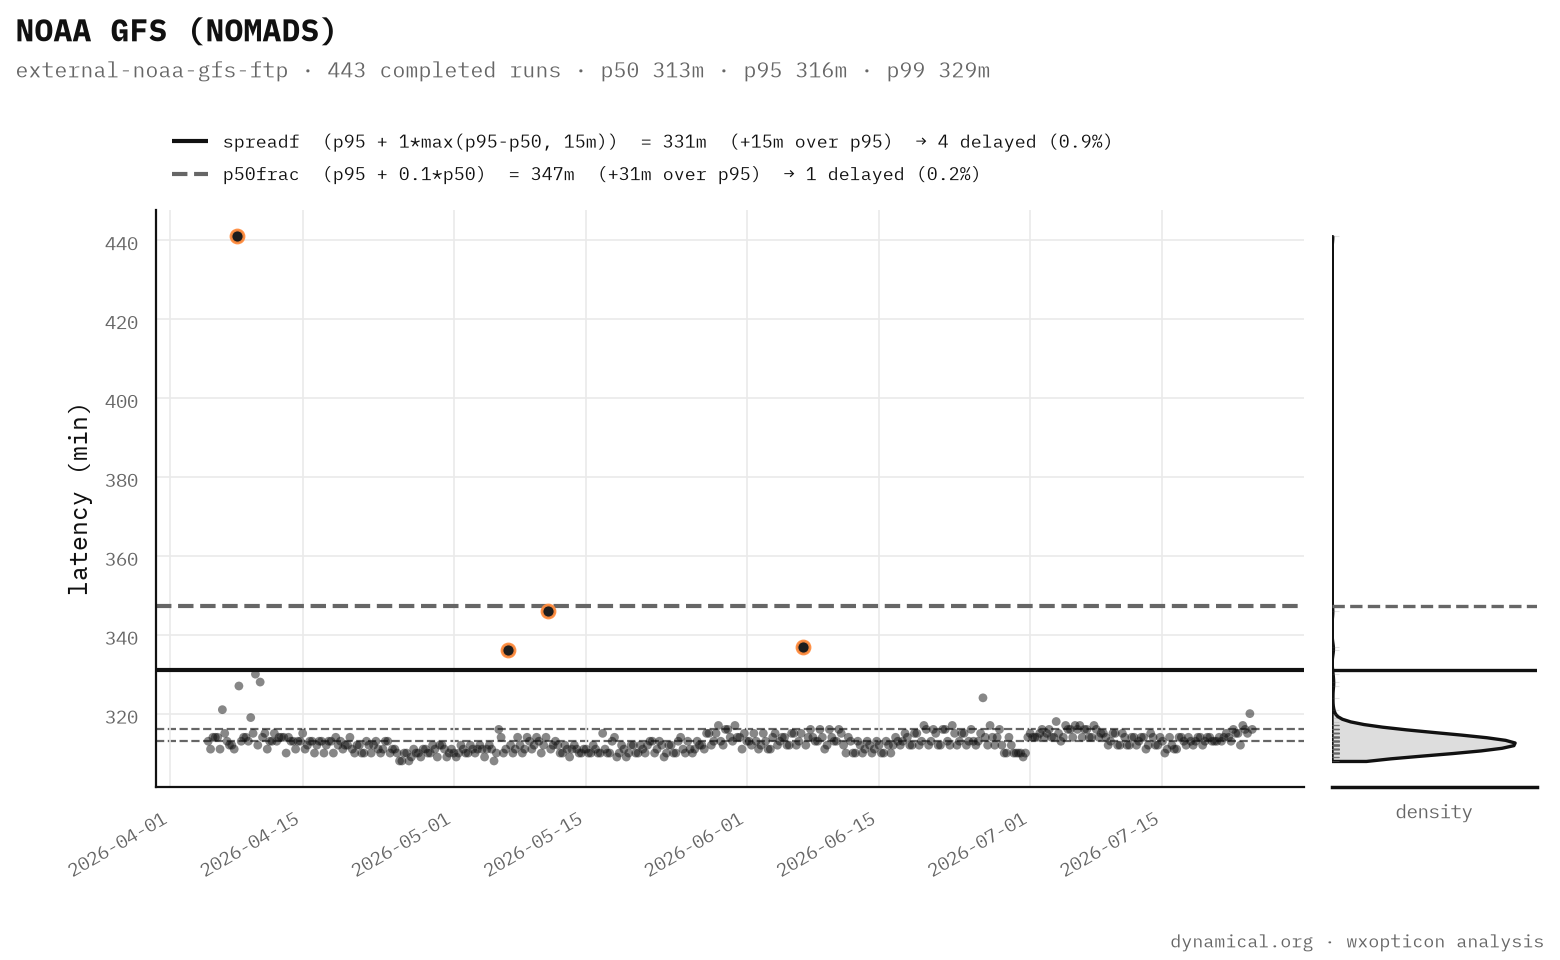
The spreadf approach now drives the dashboard, in-flight warnings, and the completed run's timing.
Can a delayed lead-group predict a delayed run?
We also wanted to explore the question: can delayed lead groups foretell the full run being delayed? Using the spreadf methodology, lead groups produced 46 observable early warnings, or about 0.5% of runs:
- 20 (43.5%) persisted to a completed full-run delay;
- 26 (56.5%) recovered and completed on time;
- the median warning arrived 63 minutes before the run completed;
- for the warnings that persisted, the median lead over the full-run deadline was 57 minutes.
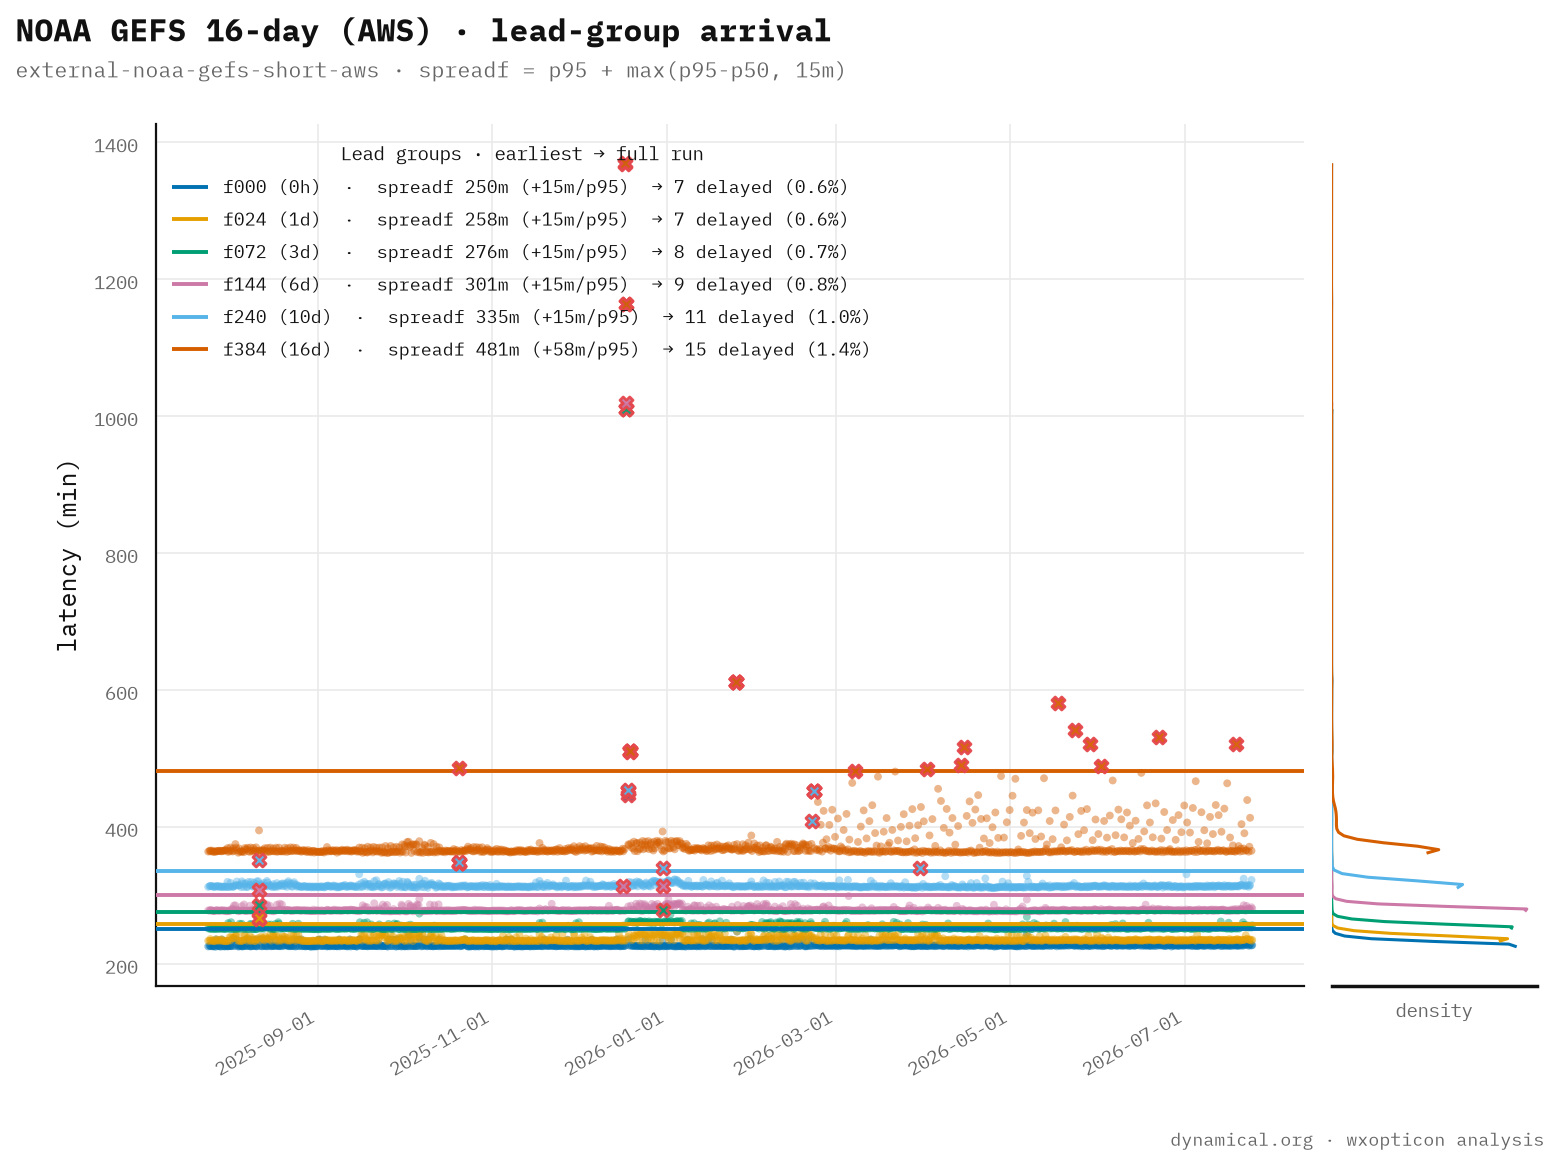
An in_flight event triggered by
a lead group might be a useful warning depending on one's sensitivity to delays. Or one could subscribe to
complete_delayed if they only wanted confirmed late completions.
How do delays correlate with agency advisories?
From time to time, ECMWF and NOAA, for example, issue dissemination advisories: memorable ones include the dramatic power outage impacting the Bologna data center, or the crazy summer when NOMADS FTP took early retirement (too soon?).
We now ingest these in real time and surface delays on our status and pipeline pages. We have backfilled the archive through early 2022.
Using these, we asked yet another question: Can lead-group delays detect official advisories early?
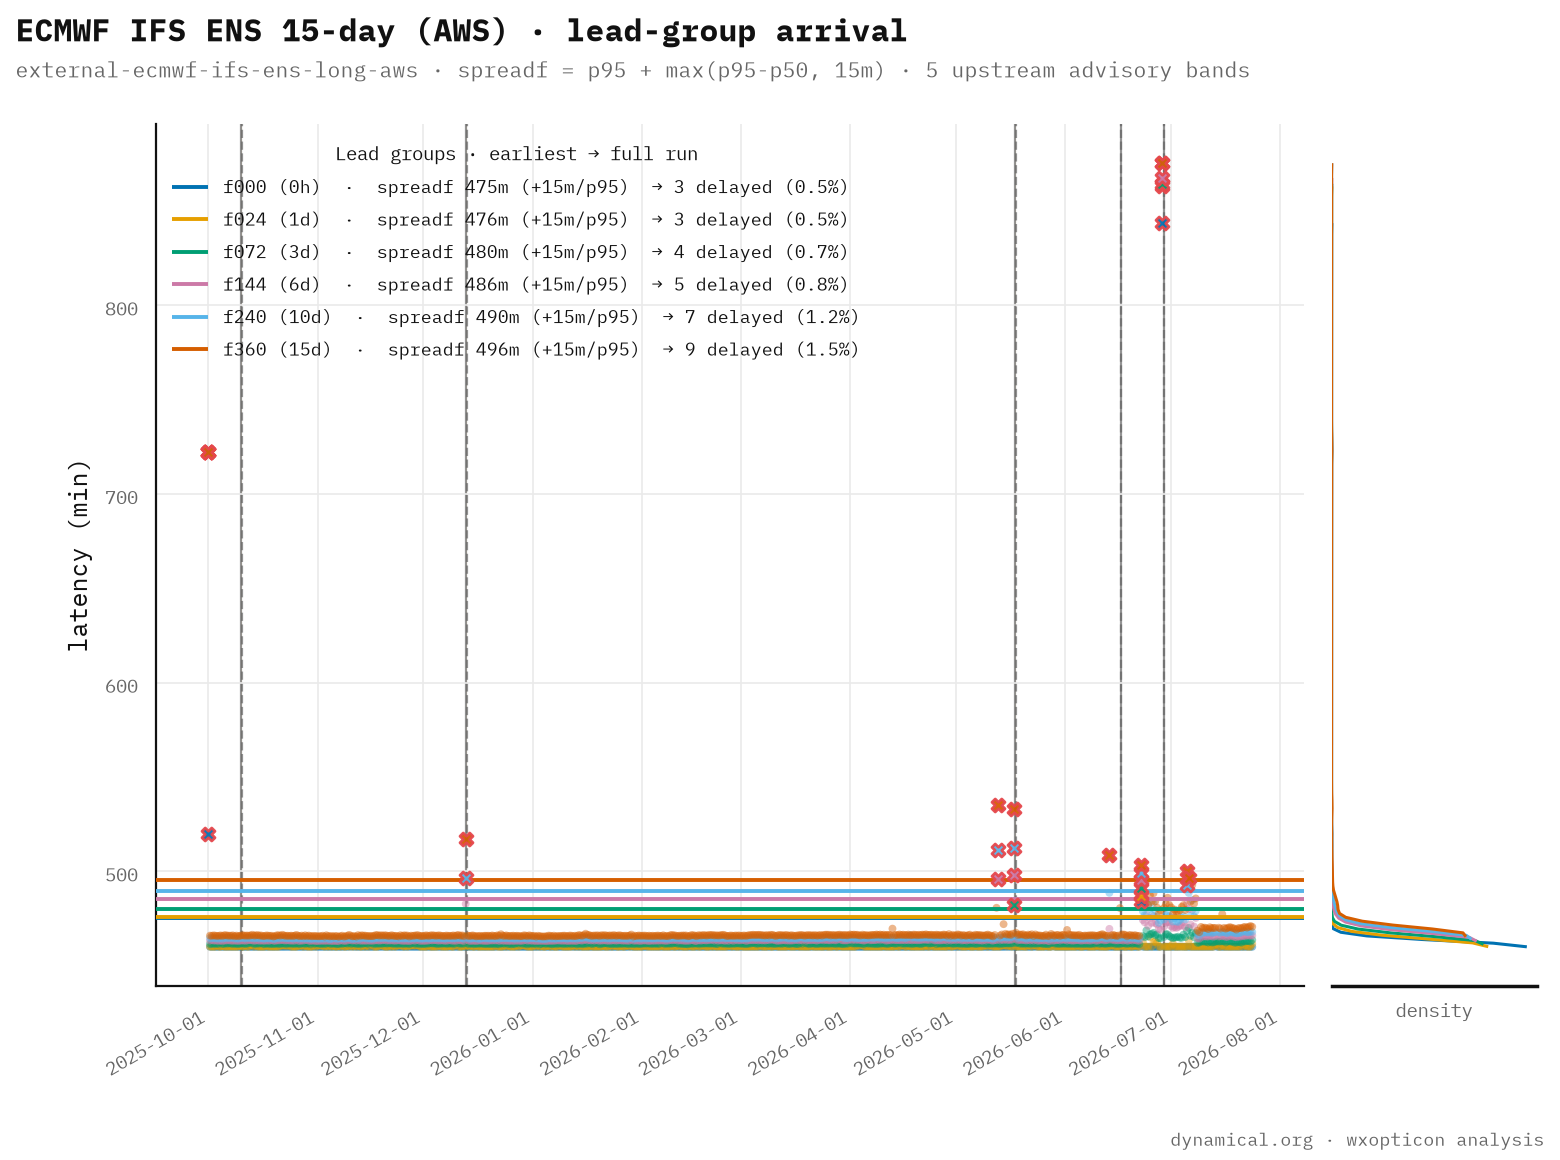
Not conclusively, based on the archive we have. We found 24 product/run matches with an opening agency advisory. Four also experienced a lead-group delay, and those delays followed the agency post by roughly 2, 11, 96, and 196 minutes. That is too small a sample for a broad conclusion, but it is enough to reject the claim that lead-group spreadf was an earlier advisory detector in this period.
Subscriptions and feeds
If you can expose an inbound HTTP endpoint, webhooks are a good way to be notified of specific dissemination events or delay conditions. wxopticon POSTs a signed JSON body to your endpoint the moment a run crosses a boundary you've subscribed to:
{
  "event_id": "noaa-gfs/external-noaa-gfs-aws/2026-06-10T06:00Z/complete",
  "group_id": "noaa-gfs",
  "product_id": "external-noaa-gfs-aws",
  "product_label": "NOAA GFS forecast (AWS)",
  "init_time": "2026-06-10T06:00:00Z",
  "kind": "complete",
  "lead_group": "f384",
  "lead_group_label": "16d",
  "max_lead_hours": 384,
  "occurred_at": "2026-06-10T11:12:04Z",
  "latency_s": 18724.0,
  "timing": "on_time"
}
Subscriptions are managed at status.dynamical.org/webhooks; access is currently allowlisted, so get in touch if you'd like to try it. You can even attach a small sandboxed Python function that runs against the just-arrived dataset and shapes the payload or filters out deliveries you don't want.
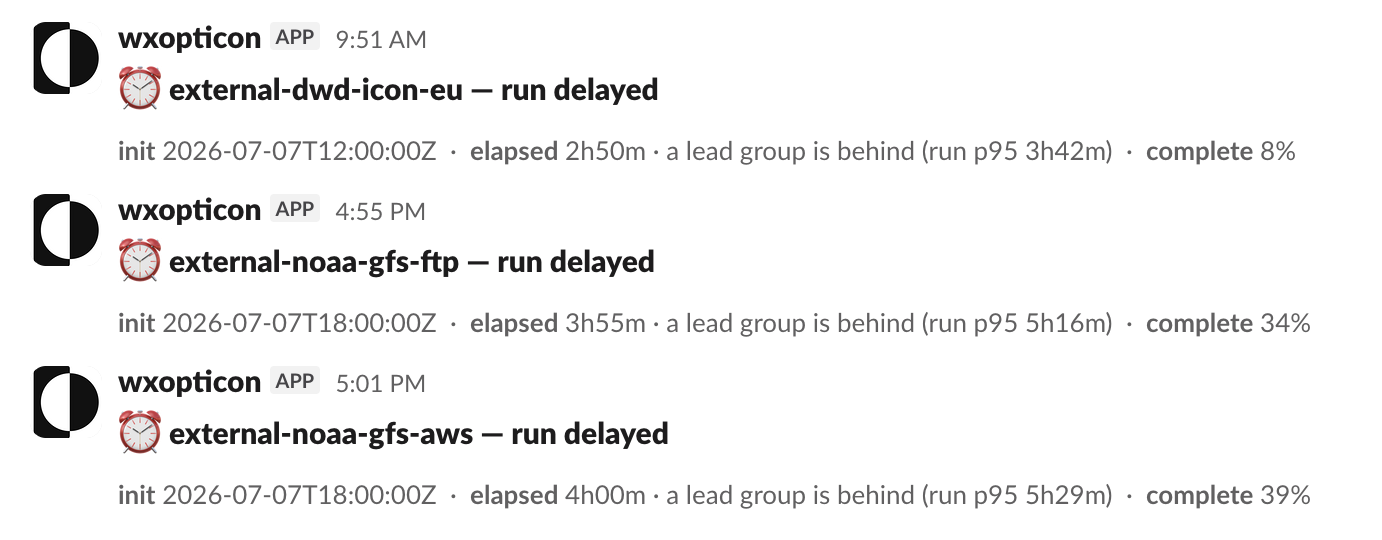
For those of you who hear the soft footfall of the IT team plodding imperceptibly, but threateningly, in the distance — coming closer, ever closer at the mention of webhooks, wxopticon publishes the same events as a single JSON file you fetch on your own schedule, with no subscription or auth:
https://assets.dynamical.org/wxopticon/feed.json
It's a product-keyed snapshot. Each product carries its most recent runs, and every run nests the same discrete arrival events a webhook would deliver. Active agency advisories sit in a top-level list because one incident can span products or cycles; affected products carry references back to them.
{
  "generated_at": "2026-06-10T09:45:00+00:00",
  "products": {
    "external-noaa-gfs-aws": {
      "label": "NOAA GFS (AWS)",
      "runs": [
        { "init_time": "2026-06-10T06:00:00+00:00", "status": "in_flight",
          "completion_pct": 0.62, "timing": "on_time",
          "events": [
            { "event_id": "noaa-gfs/external-noaa-gfs-aws/2026-06-10T06:00Z/progress/f240",
              "group_id": "noaa-gfs", "product_id": "external-noaa-gfs-aws",
              "product_label": "NOAA GFS forecast (AWS)",
              "kind": "progress", "lead_group": "f240", "lead_group_label": "10d",
              "occurred_at": "2026-06-10T09:41:03Z", "timing": "on_time" }
          ] }
      ]
    }
  },
  "advisories": []
}
The nested events are identical to what a webhook carries (minus the
subscription id), so the client logic is the same: select the products you care
about, and dedupe on event_id across polls. The file is refreshed each five-minute cycle and
served with Cache-Control: max-age=5, stale-while-revalidate=10, so feel free to slam it.
Where to go from here
- Watch the pipeline live: dynamical.org/status/pipeline
- Poll the feed: assets.dynamical.org/wxopticon/feed.json
- Manage webhook subscriptions: status.dynamical.org/webhooks
We will continue to tune how "delayed" is determined. And as wxopticon now also ingests, archives, and cross-references official source advisories (an ECMWF dissemination delay, for example), we will continue to explore patterns.
wxopticon is a living but experimental piece of our infrastructure. If there's a source you'd like us to watch, or a boundary you wish you could subscribe to, let us know.