NOAA REFS forecast, 3 hourly, virtual validation report
This dataset validation report plots a sample of values from the NOAA REFS forecast, 3 hourly, virtual dataset over time and across space, comparing where possible to a previously validated reference dataset. It also reports the quantity of unavailable values and their associated timestamps. These analyses are one layer of a multi-layered dataset validation process we perform at dynamical.org and also provide users a preview of the dataset contents.
Report generation start time: 2026-10-13T21:02:28 UTC
Summary
This dataset has been validated and is ready for experimental use. NOAA RRFS/REFS is pre-operational and under development, so expect some changes to model output. The data contains selected instances of implausible outputs, like strongly negative precipitation in specific forecasts, and flash flood guidance probabilities are partially missing in some forecasts. See the review notes below.
What looks good
- Every source file is present at every forecast from August 13 to October 12, 2026.
- A sample of 9,440 stored references decoded cleanly and matches directly decoded source messages.
- Maps are correctly oriented on the 3 km CONUS grid, and weather systems line up across related variables.
- Probabilities stay within 0 to 100% and nest correctly: they fall with a stricter threshold or longer recurrence interval, and at a given lead a longer window is never below a shorter one.
- Each accumulation window starts at its own length (3, 6, 12 or 24 hours) and repeats every 3 hours.
- No step changes or drift appear across the archive.
Review notes
- Precipitation amounts are strongly negative over parts of two forecasts. In the forecasts initialized September 23, 2026 at 12:00 and 18:00 UTC, the 3 and 6 hour amounts covering 18:00 to 21:00 UTC on September 23 reach -124 kg m⁻² in the probability-matched mean and about -9 kg m⁻² in the mean.
- Elsewhere, precipitation and snowfall amounts can be very slightly negative where none falls, down to -0.0625 kg m⁻² and about -0.00003 m.
- Fewer ensemble members contribute from lead 45 hours. Every forecast combines 14 members through lead 42 hours, 13 at leads 45 to 48, 12 at lead 51 and 6 at leads 54 to 60. At each step standard deviations drop and probabilities move in coarser steps, and a longer accumulation window can read lower than a shorter window it contains from an earlier lead.
- Flash flood guidance probabilities are partially missing in some 00:00 UTC forecasts. Missing areas hold negative values at every lead; mask them as each variable's metadata describes. Recurrence-interval probabilities are unaffected.
- 3 hour guidance: August 14, 18 and 21, September 3, 12 and 15, and October 7, 2026.
- 6 hour guidance: the same forecasts, plus August 15 and 22, 2026.
Datasets
| Role | Name | ID | Version | URL |
|---|---|---|---|---|
| Validation | NOAA REFS forecast, 3 hourly, virtual | noaa-refs-forecast-3-hourly-virtual |
v0.1.0 |
s3://dynamical-noaa-refs/noaa-refs-forecast-3-hourly-virtual/v0.1.0.icechunk |
| Reference | NOAA GEFS analysis | noaa-gefs-analysis |
0.1.2 |
s3://dynamical-noaa-gefs/noaa-gefs-analysis/v0.1.2.icechunk/ |
Run parameters
| Parameter | Value |
|---|---|
| Validation dataset type | forecast |
| Validation time range | init_time 2026-08-13T00:00 → 2026-10-12T18:00 |
| Reference time range | time 2000-01-01T00:00 → 2026-10-13T12:00 |
| Point 1 | lat=30.7040, lon=-88.0040 |
| Point 2 | lat=39.6059, lon=-105.8851 |
| Spatial comparison time | init=2026-10-11T06:00, lead=24h (reference at 2026-10-12T06:00) |
| Timeseries period | init=2026-10-11T06:00 |
| Store type | virtual — availability manifest-probed; value series sampled |
Availability
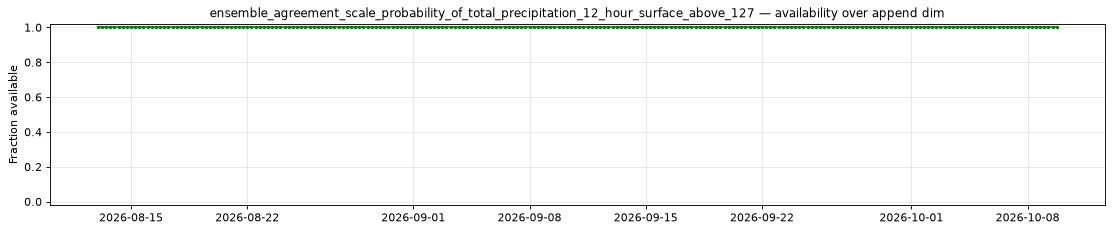
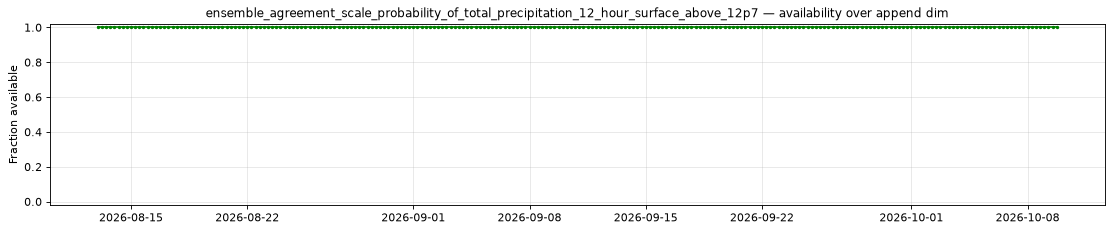
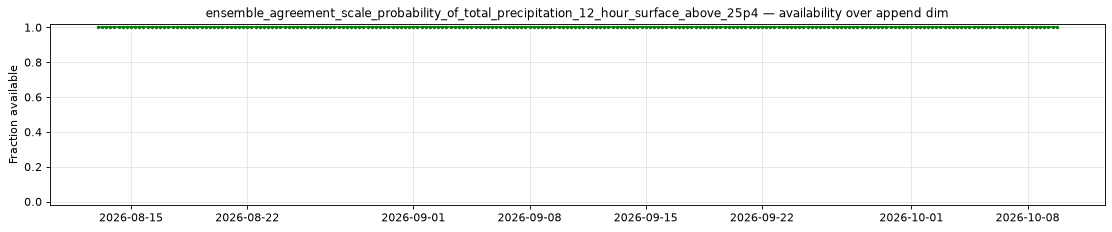
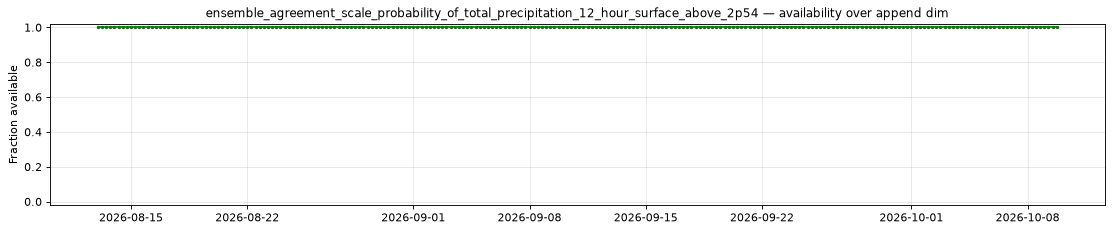
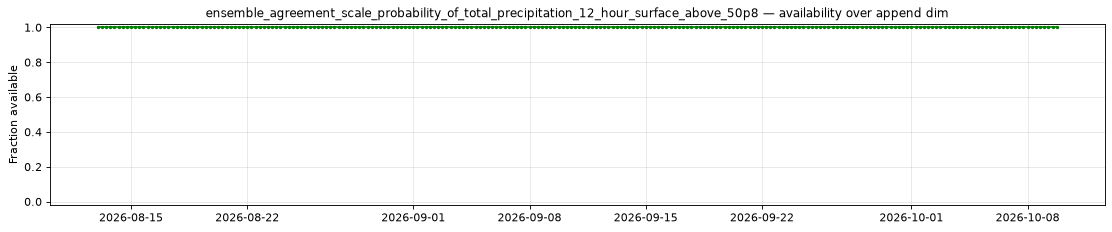
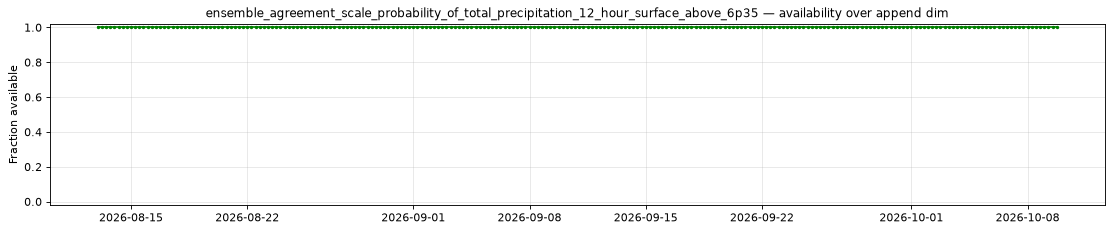
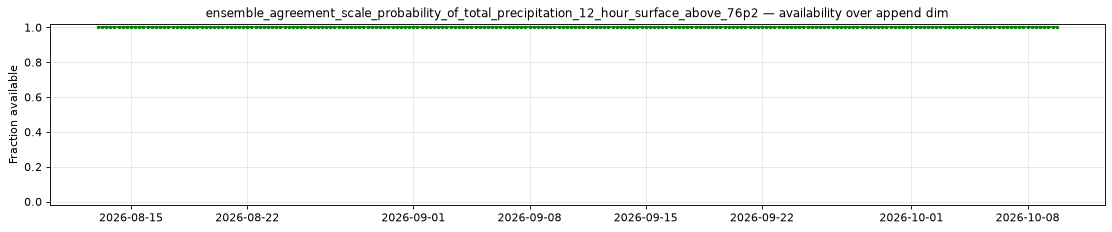
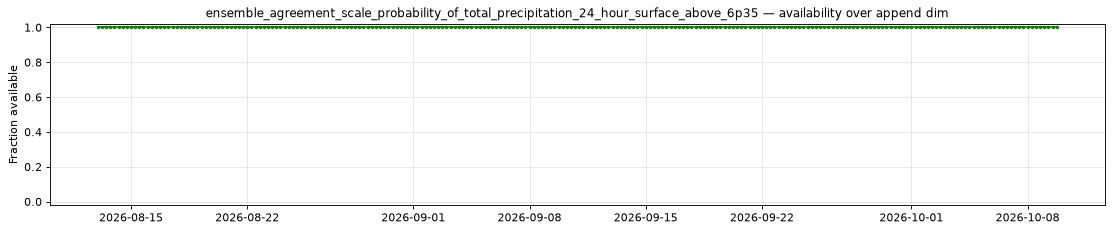
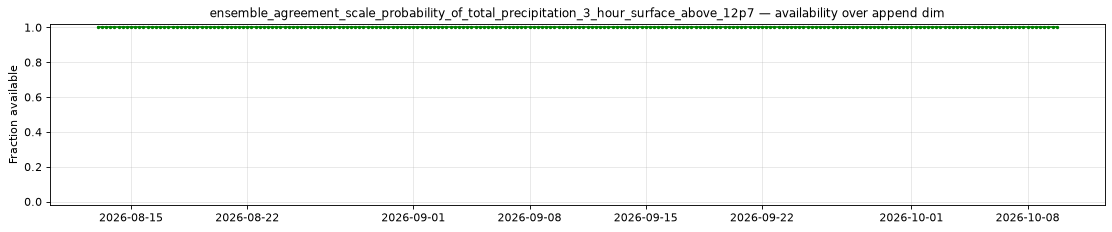
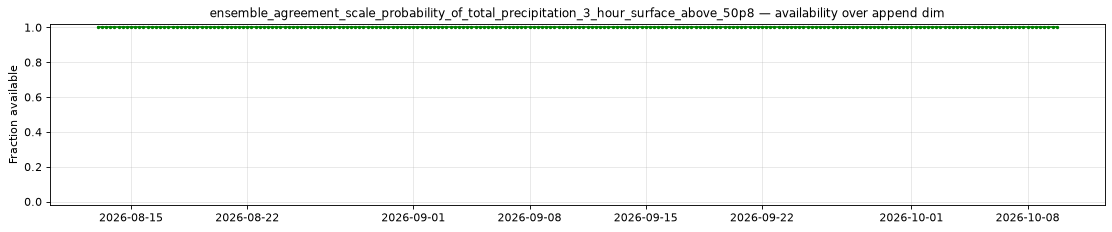
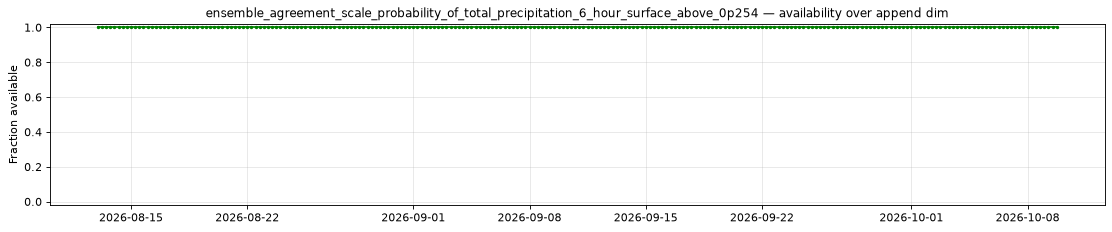
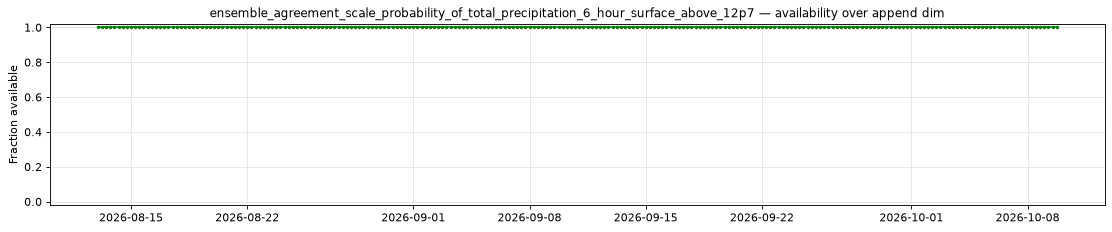
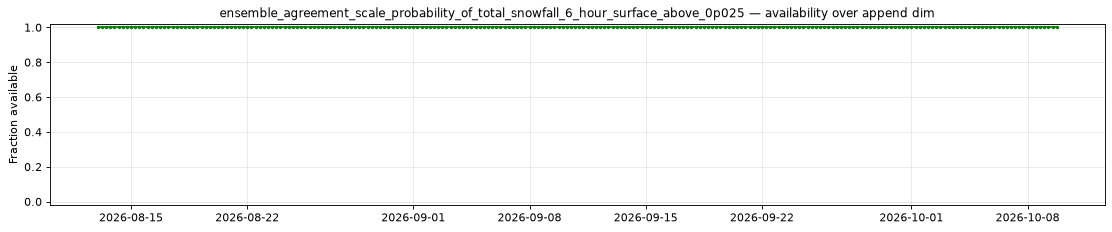
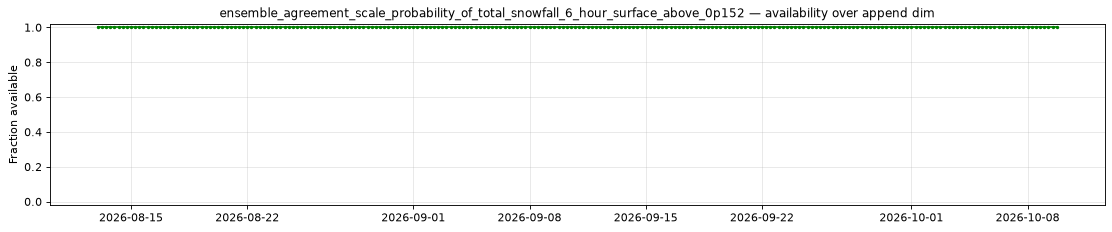
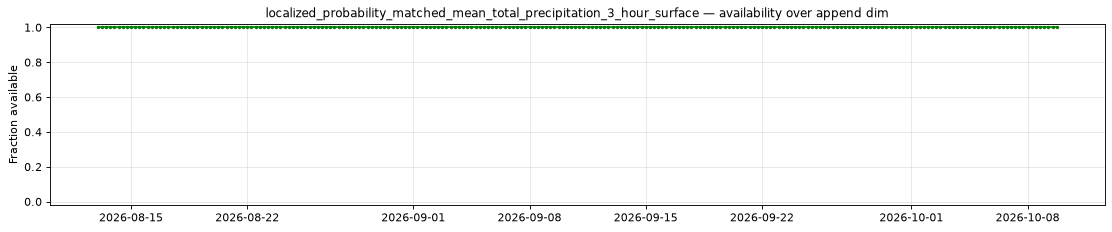
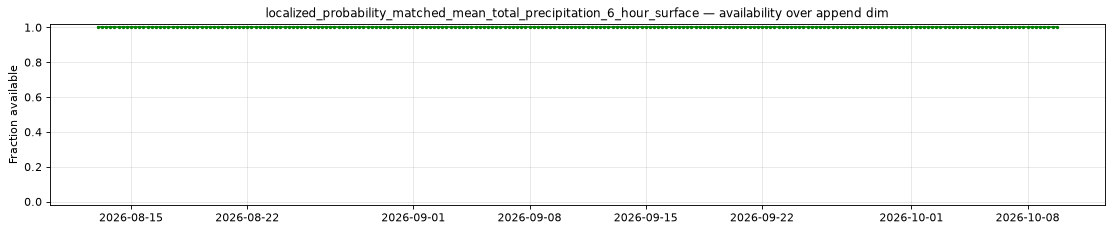
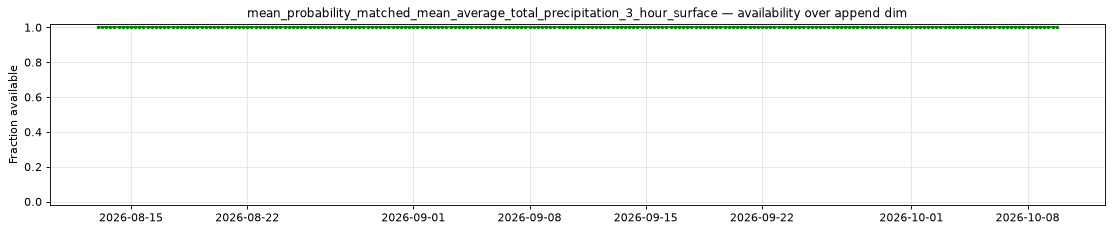
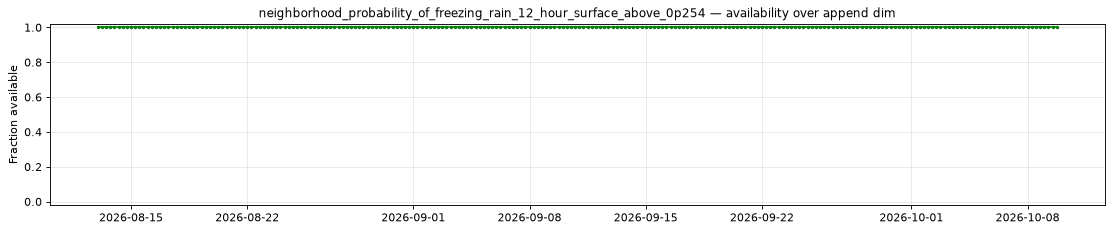
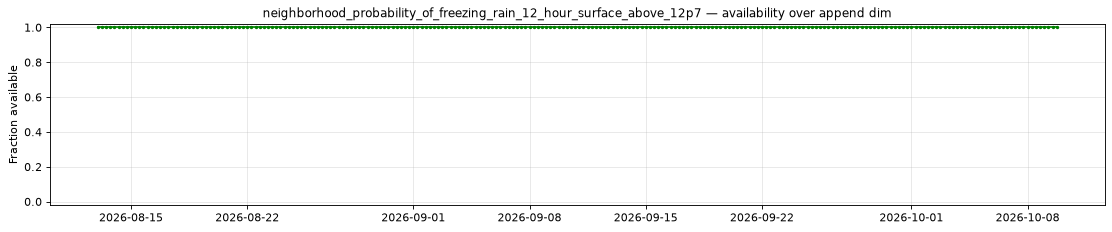
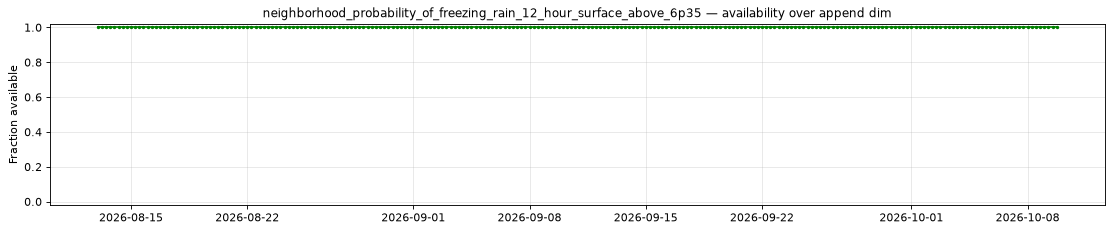
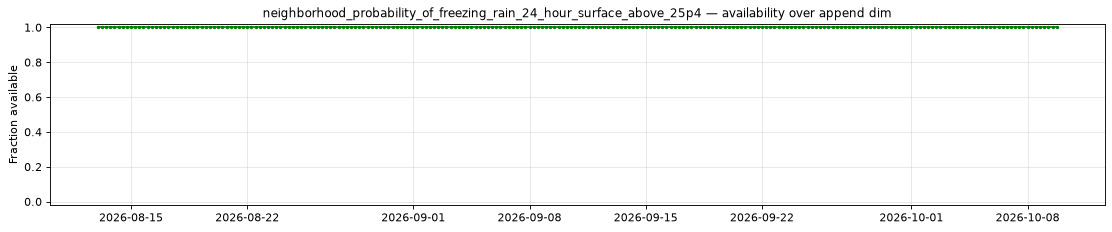
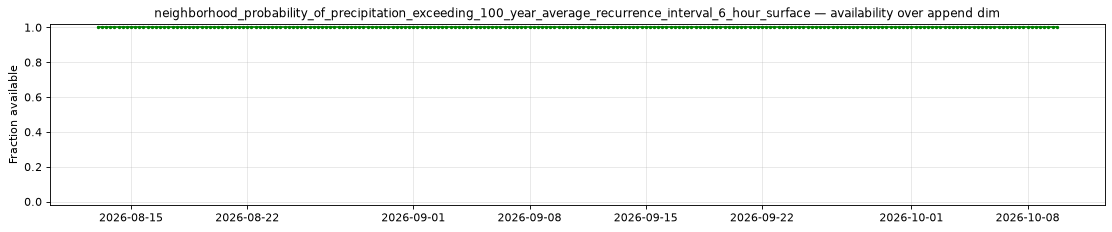
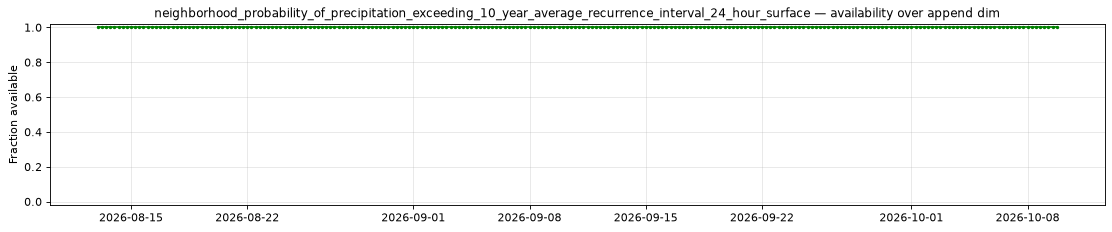
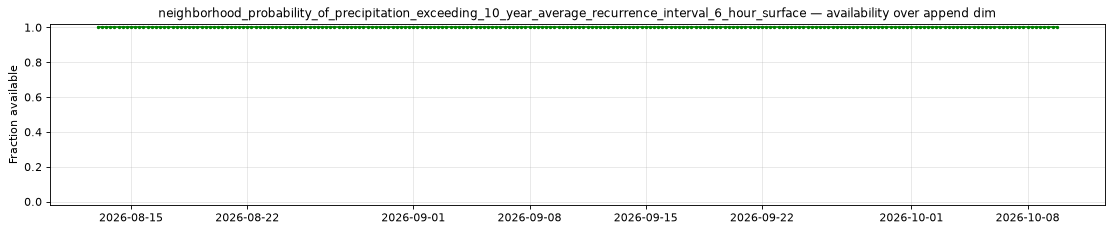
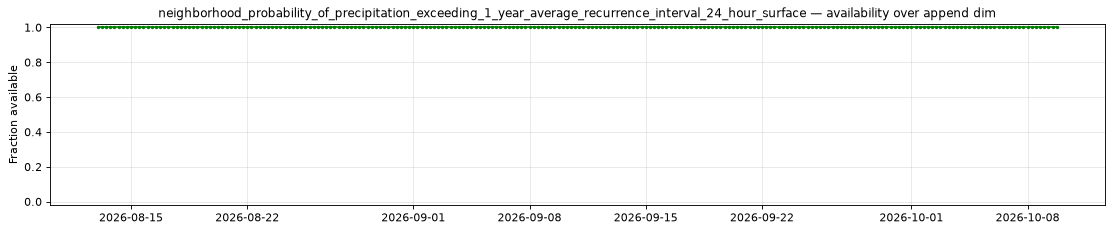
The plot below shows the availability of each variable over time — light red marks unavailable data, dark green marks present data.
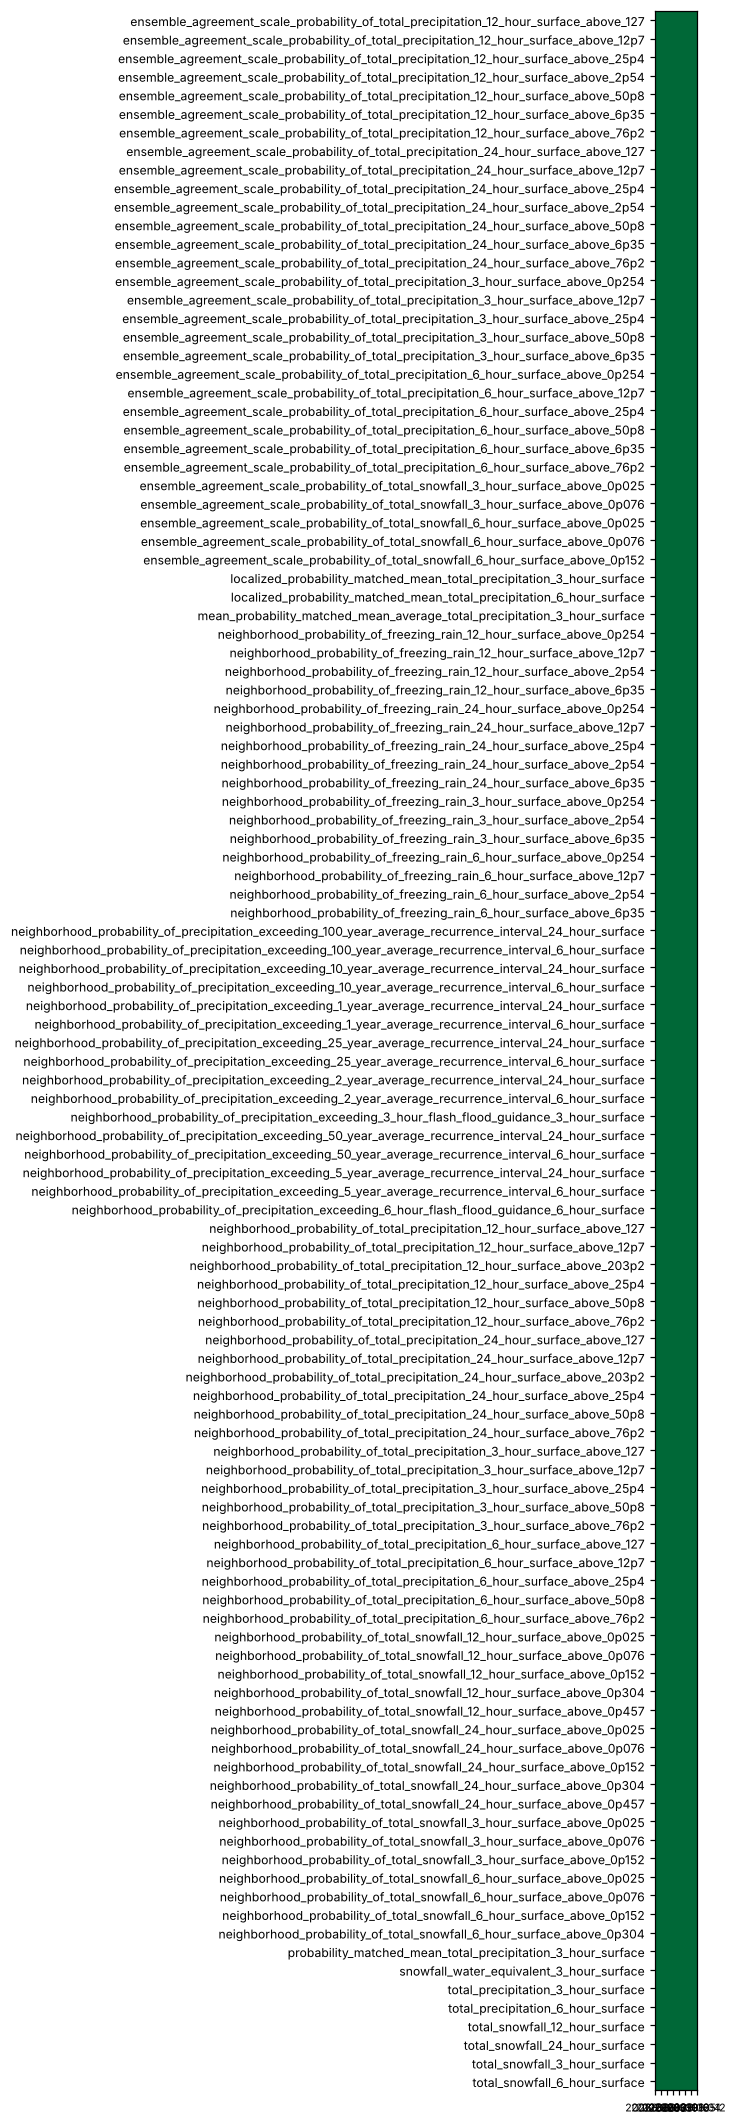
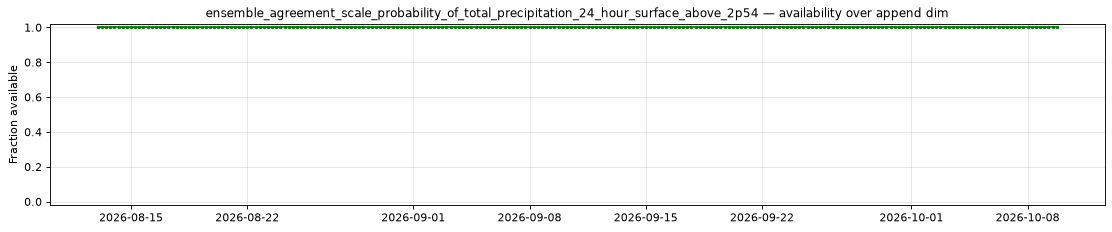
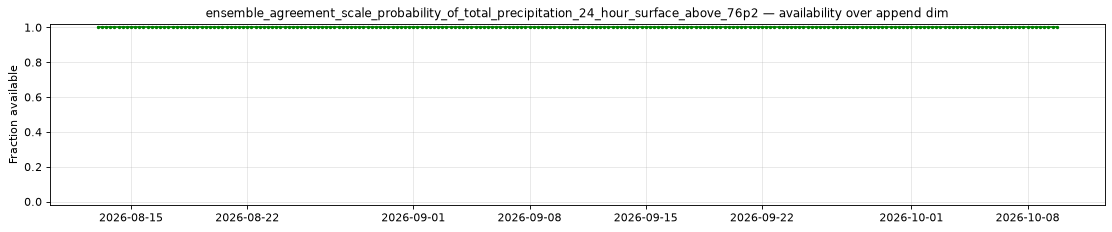
Every variable is complete at every scanned position.
Decode health
9440 references decoded successfully, sampled across 20 of 244 append-dim regions, 5 leads and up to 3 present levels per group variable.
Per-variable details
ensemble_agreement_scale_probability_of_total_precipitation_12_hour_surface_above_127
Metadata
| Field | Value |
|---|---|
| units | percent |
| long_name | Ensemble agreement scale probability of 12 hour total precipitation (surface) above 127 kg m-2 |
| short_name | ensemble_agreement_scale_probability_of_total_precipitation_12_hour_surface_above_127 |
| standard_name | n/a |
| step_type | accum |
| comment | Threshold applies to the preceding 12 hours of accumulation. Published every 3 forecast hours from lead 12 hours. Ensemble agreement scale probability of 12 hour total precipitation (surface) above 127 kg m-2. |
Point time series — 2026-08-13T00:00 - 2026-10-12T18:00, sampled lead=12h
| Point | min | mean | max |
|---|---|---|---|
| P1 | 0 | 0.04897 | 2.25 |
| P2 | 0 | 0 | 0 |
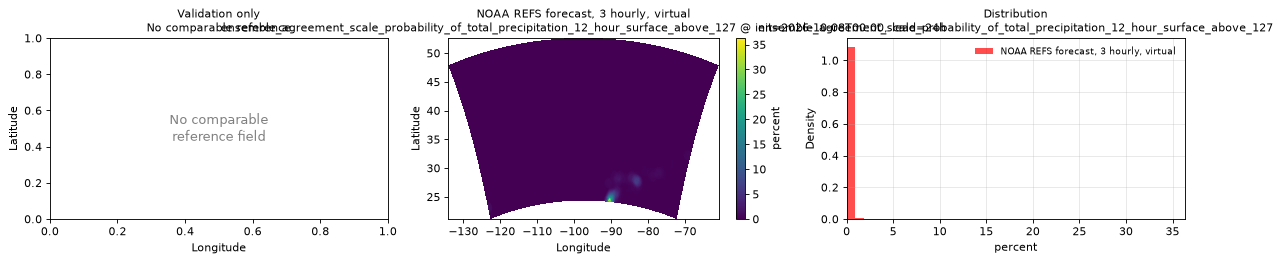
Spatial — init=2026-10-11T06:00, lead=24h (reference not available)
| Source | min | mean | max |
|---|---|---|---|
| Validation | 0 | 0.002851 | 0.9893 |
Temporal — init=2026-10-11T06:00
| Source | min | mean | max |
|---|---|---|---|
| P1 Validation | 0 | 0 | 0 |
| P2 Validation | 0 | 0 | 0 |
Availability — 244 of 244 positions complete
ensemble_agreement_scale_probability_of_total_precipitation_12_hour_surface_above_12p7
Metadata
| Field | Value |
|---|---|
| units | percent |
| long_name | Ensemble agreement scale probability of 12 hour total precipitation (surface) above 12.7 kg m-2 |
| short_name | ensemble_agreement_scale_probability_of_total_precipitation_12_hour_surface_above_12p7 |
| standard_name | n/a |
| step_type | accum |
| comment | Threshold applies to the preceding 12 hours of accumulation. Published every 3 forecast hours from lead 12 hours. Ensemble agreement scale probability of 12 hour total precipitation (surface) above 12.7 kg m-2. |
Point time series — 2026-08-13T00:00 - 2026-10-12T18:00, sampled lead=12h
| Point | min | mean | max |
|---|---|---|---|
| P1 | 0 | 5.417 | 84.47 |
| P2 | 0 | 1.263 | 41.41 |
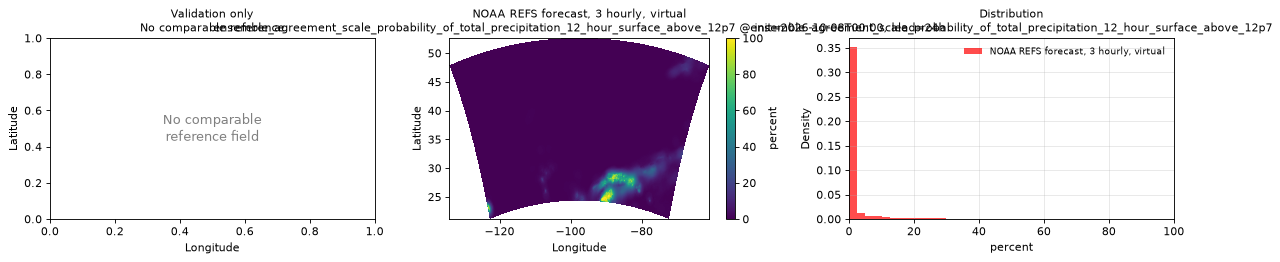
Spatial — init=2026-10-11T06:00, lead=24h (reference not available)
| Source | min | mean | max |
|---|---|---|---|
| Validation | 0 | 6.014 | 100 |
Temporal — init=2026-10-11T06:00
| Source | min | mean | max |
|---|---|---|---|
| P1 Validation | 0 | 0 | 0 |
| P2 Validation | 0 | 0.08272 | 0.4688 |
Availability — 244 of 244 positions complete


ensemble_agreement_scale_probability_of_total_precipitation_12_hour_surface_above_25p4
Metadata
| Field | Value |
|---|---|
| units | percent |
| long_name | Ensemble agreement scale probability of 12 hour total precipitation (surface) above 25.4 kg m-2 |
| short_name | ensemble_agreement_scale_probability_of_total_precipitation_12_hour_surface_above_25p4 |
| standard_name | n/a |
| step_type | accum |
| comment | Threshold applies to the preceding 12 hours of accumulation. Published every 3 forecast hours from lead 12 hours. Ensemble agreement scale probability of 12 hour total precipitation (surface) above 25.4 kg m-2. |
Point time series — 2026-08-13T00:00 - 2026-10-12T18:00, sampled lead=12h
| Point | min | mean | max |
|---|---|---|---|
| P1 | 0 | 2.798 | 49.34 |
| P2 | 0 | 0.147 | 10.09 |
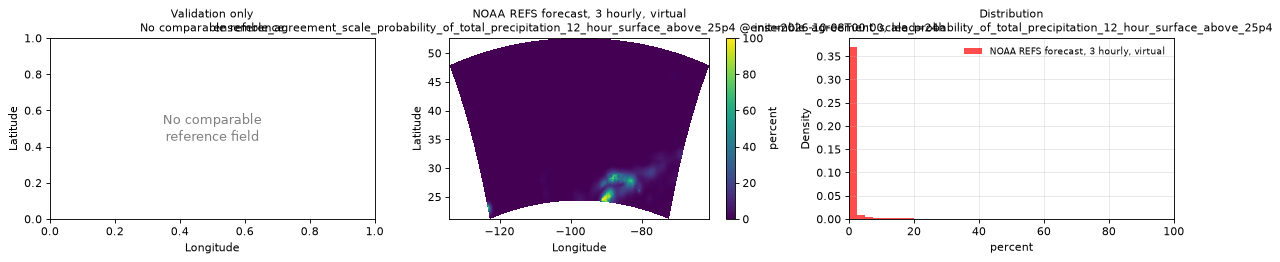
Spatial — init=2026-10-11T06:00, lead=24h (reference not available)
| Source | min | mean | max |
|---|---|---|---|
| Validation | 0 | 1.841 | 98.28 |
Temporal — init=2026-10-11T06:00
| Source | min | mean | max |
|---|---|---|---|
| P1 Validation | 0 | 0 | 0 |
| P2 Validation | 0 | 0 | 0 |
Availability — 244 of 244 positions complete


ensemble_agreement_scale_probability_of_total_precipitation_12_hour_surface_above_2p54
Metadata
| Field | Value |
|---|---|
| units | percent |
| long_name | Ensemble agreement scale probability of 12 hour total precipitation (surface) above 2.54 kg m-2 |
| short_name | ensemble_agreement_scale_probability_of_total_precipitation_12_hour_surface_above_2p54 |
| standard_name | n/a |
| step_type | accum |
| comment | Threshold applies to the preceding 12 hours of accumulation. Published every 3 forecast hours from lead 12 hours. Ensemble agreement scale probability of 12 hour total precipitation (surface) above 2.54 kg m-2. |
Point time series — 2026-08-13T00:00 - 2026-10-12T18:00, sampled lead=12h
| Point | min | mean | max |
|---|---|---|---|
| P1 | 0 | 18.14 | 100 |
| P2 | 0 | 14.35 | 96.81 |
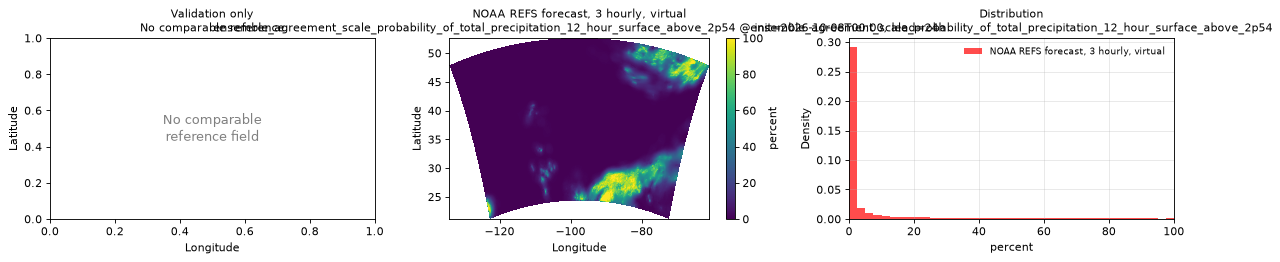
Spatial — init=2026-10-11T06:00, lead=24h (reference not available)
| Source | min | mean | max |
|---|---|---|---|
| Validation | 0 | 18.9 | 100 |
Temporal — init=2026-10-11T06:00
| Source | min | mean | max |
|---|---|---|---|
| P1 Validation | 0 | 0 | 0 |
| P2 Validation | 0.5 | 6.43 | 19.34 |
Availability — 244 of 244 positions complete

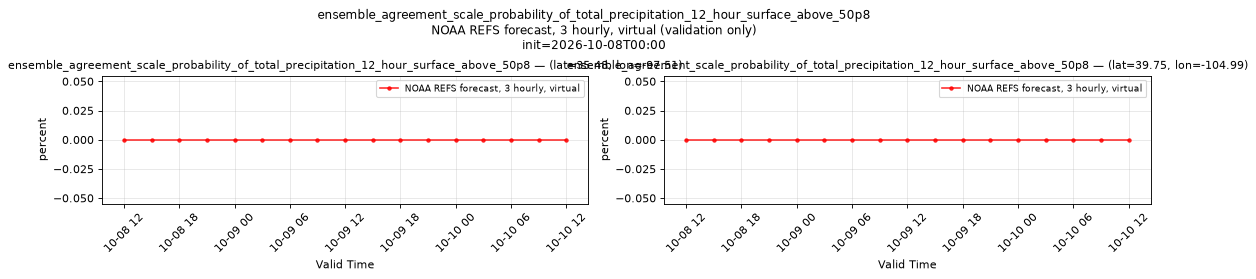
ensemble_agreement_scale_probability_of_total_precipitation_12_hour_surface_above_50p8
Metadata
| Field | Value |
|---|---|
| units | percent |
| long_name | Ensemble agreement scale probability of 12 hour total precipitation (surface) above 50.8 kg m-2 |
| short_name | ensemble_agreement_scale_probability_of_total_precipitation_12_hour_surface_above_50p8 |
| standard_name | n/a |
| step_type | accum |
| comment | Threshold applies to the preceding 12 hours of accumulation. Published every 3 forecast hours from lead 12 hours. Ensemble agreement scale probability of 12 hour total precipitation (surface) above 50.8 kg m-2. |
Point time series — 2026-08-13T00:00 - 2026-10-12T18:00, sampled lead=12h
| Point | min | mean | max |
|---|---|---|---|
| P1 | 0 | 0.8915 | 21.84 |
| P2 | 0 | 0.004915 | 0.25 |
Spatial — init=2026-10-11T06:00, lead=24h (reference not available)
| Source | min | mean | max |
|---|---|---|---|
| Validation | 0 | 0.2525 | 59.8 |
Temporal — init=2026-10-11T06:00
| Source | min | mean | max |
|---|---|---|---|
| P1 Validation | 0 | 0 | 0 |
| P2 Validation | 0 | 0 | 0 |
Availability — 244 of 244 positions complete

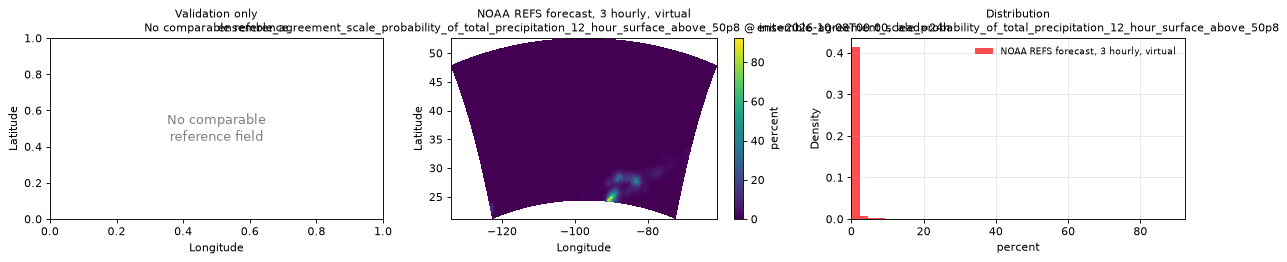
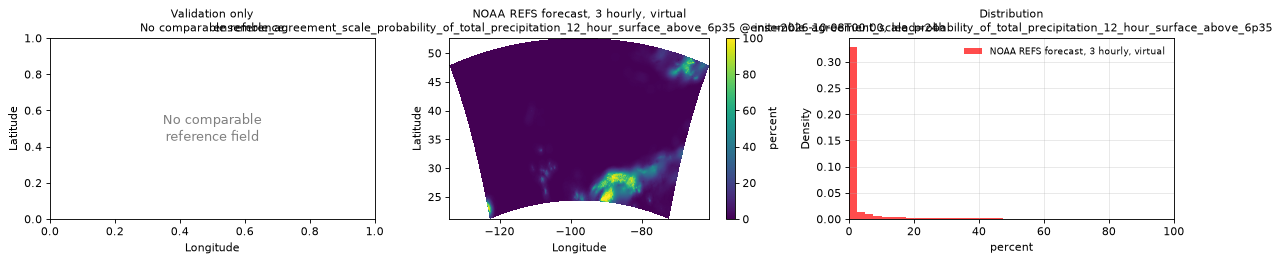
ensemble_agreement_scale_probability_of_total_precipitation_12_hour_surface_above_6p35
Metadata
| Field | Value |
|---|---|
| units | percent |
| long_name | Ensemble agreement scale probability of 12 hour total precipitation (surface) above 6.35 kg m-2 |
| short_name | ensemble_agreement_scale_probability_of_total_precipitation_12_hour_surface_above_6p35 |
| standard_name | n/a |
| step_type | accum |
| comment | Threshold applies to the preceding 12 hours of accumulation. Published every 3 forecast hours from lead 12 hours. Ensemble agreement scale probability of 12 hour total precipitation (surface) above 6.35 kg m-2. |
Point time series — 2026-08-13T00:00 - 2026-10-12T18:00, sampled lead=12h
| Point | min | mean | max |
|---|---|---|---|
| P1 | 0 | 8.719 | 92.84 |
| P2 | 0 | 5.9 | 80.88 |
Spatial — init=2026-10-11T06:00, lead=24h (reference not available)
| Source | min | mean | max |
|---|---|---|---|
| Validation | 0 | 11.3 | 100 |
Temporal — init=2026-10-11T06:00
| Source | min | mean | max |
|---|---|---|---|
| P1 Validation | 0 | 0 | 0 |
| P2 Validation | 0.03125 | 1.509 | 4.969 |
Availability — 244 of 244 positions complete

ensemble_agreement_scale_probability_of_total_precipitation_12_hour_surface_above_76p2
Metadata
| Field | Value |
|---|---|
| units | percent |
| long_name | Ensemble agreement scale probability of 12 hour total precipitation (surface) above 76.2 kg m-2 |
| short_name | ensemble_agreement_scale_probability_of_total_precipitation_12_hour_surface_above_76p2 |
| standard_name | n/a |
| step_type | accum |
| comment | Threshold applies to the preceding 12 hours of accumulation. Published every 3 forecast hours from lead 12 hours. Ensemble agreement scale probability of 12 hour total precipitation (surface) above 76.2 kg m-2. |
Point time series — 2026-08-13T00:00 - 2026-10-12T18:00, sampled lead=12h
| Point | min | mean | max |
|---|---|---|---|
| P1 | 0 | 0.3138 | 10.09 |
| P2 | 0 | 0.0003202 | 0.02734 |
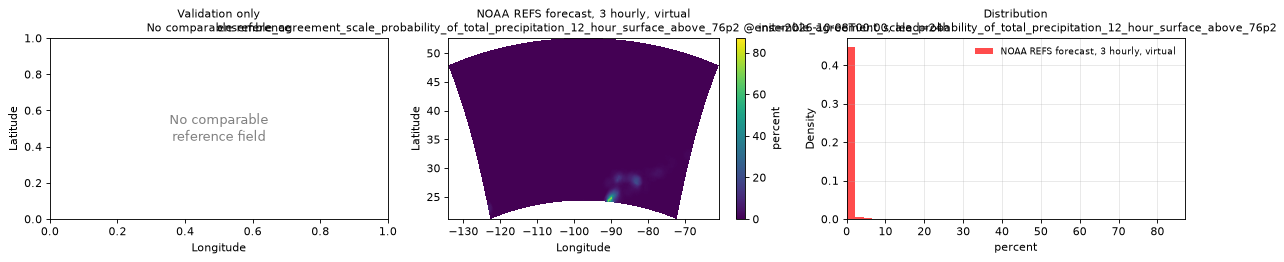
Spatial — init=2026-10-11T06:00, lead=24h (reference not available)
| Source | min | mean | max |
|---|---|---|---|
| Validation | 0 | 0.04749 | 7.496 |
Temporal — init=2026-10-11T06:00
| Source | min | mean | max |
|---|---|---|---|
| P1 Validation | 0 | 0 | 0 |
| P2 Validation | 0 | 0 | 0 |
Availability — 244 of 244 positions complete
ensemble_agreement_scale_probability_of_total_precipitation_24_hour_surface_above_127
Metadata
| Field | Value |
|---|---|
| units | percent |
| long_name | Ensemble agreement scale probability of 24 hour total precipitation (surface) above 127 kg m-2 |
| short_name | ensemble_agreement_scale_probability_of_total_precipitation_24_hour_surface_above_127 |
| standard_name | n/a |
| step_type | accum |
| comment | Threshold applies to the preceding 24 hours of accumulation. Published every 3 forecast hours from lead 24 hours. Ensemble agreement scale probability of 24 hour total precipitation (surface) above 127 kg m-2. |
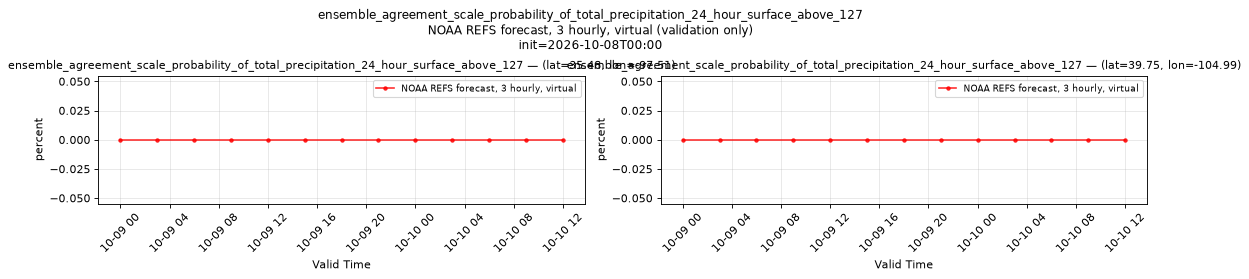
Point time series — 2026-08-13T00:00 - 2026-10-12T18:00, sampled lead=24h
| Point | min | mean | max |
|---|---|---|---|
| P1 | 0 | 0.2732 | 10.6 |
| P2 | 0 | 0 | 0 |
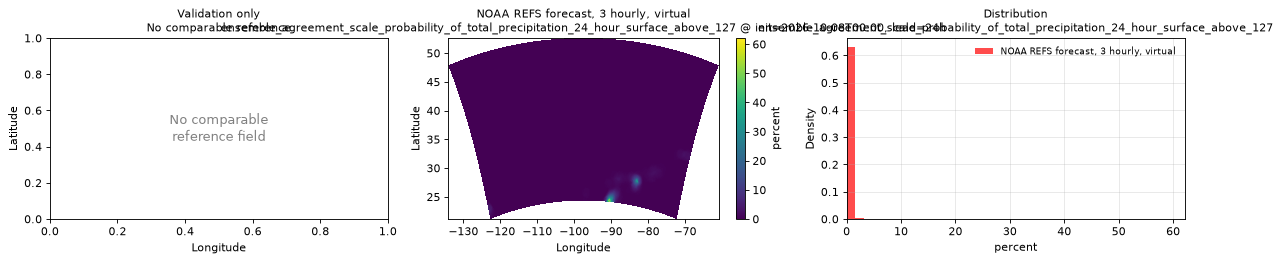
Spatial — init=2026-10-11T06:00, lead=24h (reference not available)
| Source | min | mean | max |
|---|---|---|---|
| Validation | 0 | 0.1643 | 82.78 |
Temporal — init=2026-10-11T06:00
| Source | min | mean | max |
|---|---|---|---|
| P1 Validation | 0 | 0 | 0 |
| P2 Validation | 0 | 0 | 0 |
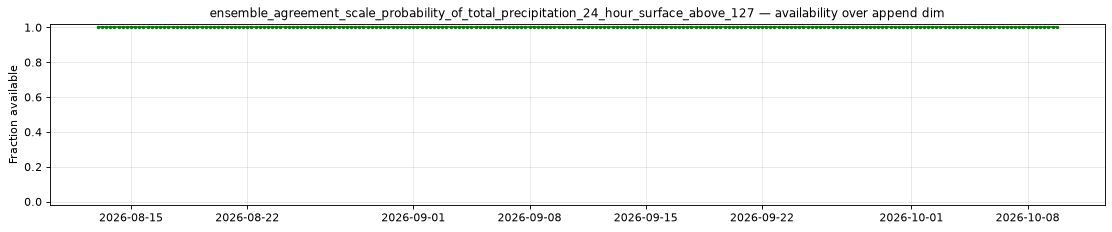
Availability — 244 of 244 positions complete
ensemble_agreement_scale_probability_of_total_precipitation_24_hour_surface_above_12p7
Metadata
| Field | Value |
|---|---|
| units | percent |
| long_name | Ensemble agreement scale probability of 24 hour total precipitation (surface) above 12.7 kg m-2 |
| short_name | ensemble_agreement_scale_probability_of_total_precipitation_24_hour_surface_above_12p7 |
| standard_name | n/a |
| step_type | accum |
| comment | Threshold applies to the preceding 24 hours of accumulation. Published every 3 forecast hours from lead 24 hours. Ensemble agreement scale probability of 24 hour total precipitation (surface) above 12.7 kg m-2. |
Point time series — 2026-08-13T00:00 - 2026-10-12T18:00, sampled lead=24h
| Point | min | mean | max |
|---|---|---|---|
| P1 | 0 | 10.76 | 97.12 |
| P2 | 0 | 3.672 | 54.69 |
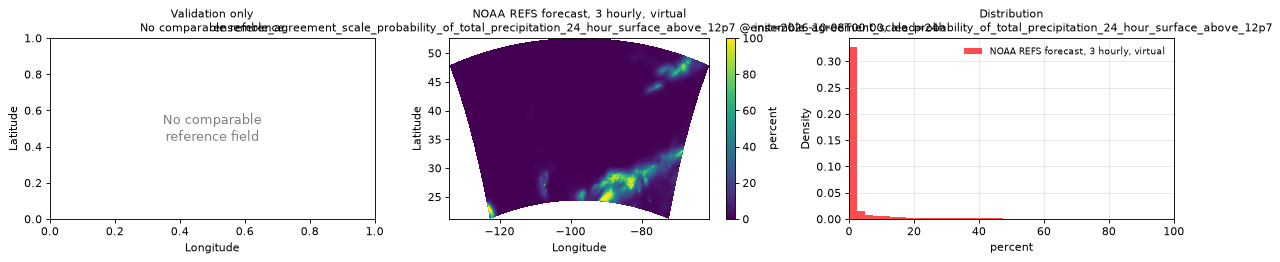
Spatial — init=2026-10-11T06:00, lead=24h (reference not available)
| Source | min | mean | max |
|---|---|---|---|
| Validation | 0 | 12.65 | 100 |
Temporal — init=2026-10-11T06:00
| Source | min | mean | max |
|---|---|---|---|
| P1 Validation | 0 | 0 | 0 |
| P2 Validation | 0.03125 | 0.3101 | 0.6875 |
Availability — 244 of 244 positions complete

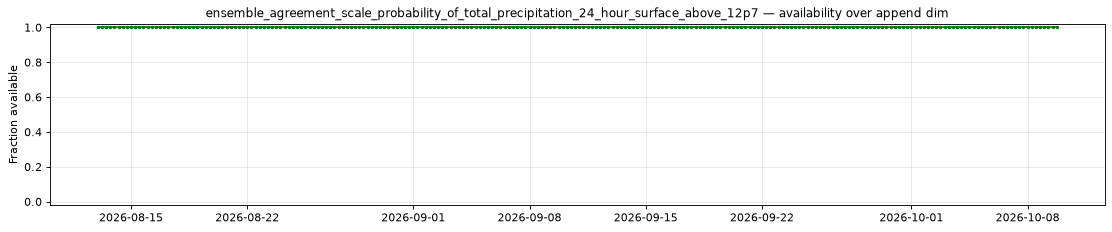
ensemble_agreement_scale_probability_of_total_precipitation_24_hour_surface_above_25p4
Metadata
| Field | Value |
|---|---|
| units | percent |
| long_name | Ensemble agreement scale probability of 24 hour total precipitation (surface) above 25.4 kg m-2 |
| short_name | ensemble_agreement_scale_probability_of_total_precipitation_24_hour_surface_above_25p4 |
| standard_name | n/a |
| step_type | accum |
| comment | Threshold applies to the preceding 24 hours of accumulation. Published every 3 forecast hours from lead 24 hours. Ensemble agreement scale probability of 24 hour total precipitation (surface) above 25.4 kg m-2. |
Point time series — 2026-08-13T00:00 - 2026-10-12T18:00, sampled lead=24h
| Point | min | mean | max |
|---|---|---|---|
| P1 | 0 | 6.224 | 80 |
| P2 | 0 | 0.4497 | 13.72 |
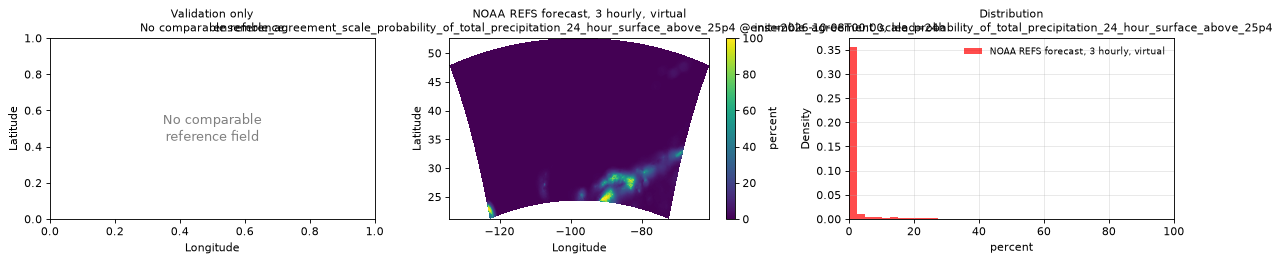
Spatial — init=2026-10-11T06:00, lead=24h (reference not available)
| Source | min | mean | max |
|---|---|---|---|
| Validation | 0 | 6.153 | 100 |
Temporal — init=2026-10-11T06:00
| Source | min | mean | max |
|---|---|---|---|
| P1 Validation | 0 | 0 | 0 |
| P2 Validation | 0 | 0 | 0 |
Availability — 244 of 244 positions complete

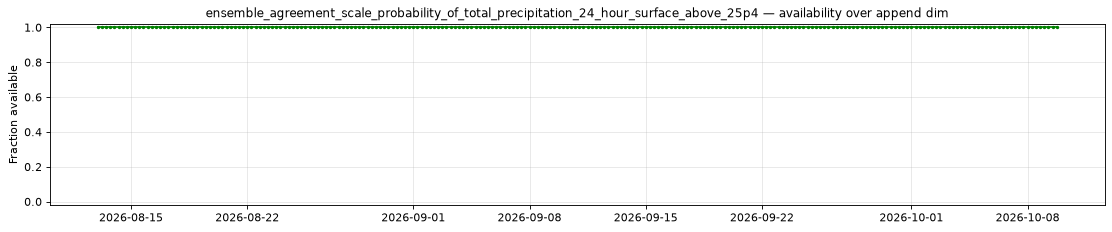
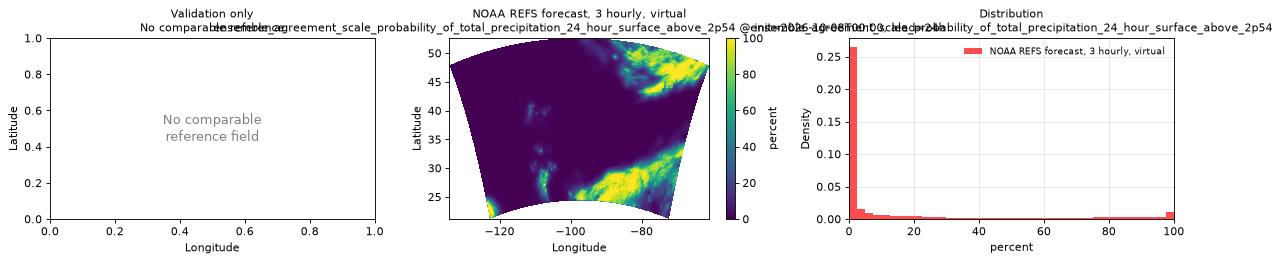
ensemble_agreement_scale_probability_of_total_precipitation_24_hour_surface_above_2p54
Metadata
| Field | Value |
|---|---|
| units | percent |
| long_name | Ensemble agreement scale probability of 24 hour total precipitation (surface) above 2.54 kg m-2 |
| short_name | ensemble_agreement_scale_probability_of_total_precipitation_24_hour_surface_above_2p54 |
| standard_name | n/a |
| step_type | accum |
| comment | Threshold applies to the preceding 24 hours of accumulation. Published every 3 forecast hours from lead 24 hours. Ensemble agreement scale probability of 24 hour total precipitation (surface) above 2.54 kg m-2. |
Point time series — 2026-08-13T00:00 - 2026-10-12T18:00, sampled lead=24h
| Point | min | mean | max |
|---|---|---|---|
| P1 | 0 | 33.26 | 100 |
| P2 | 0 | 27.42 | 98.91 |
Spatial — init=2026-10-11T06:00, lead=24h (reference not available)
| Source | min | mean | max |
|---|---|---|---|
| Validation | 0 | 28.32 | 100 |
Temporal — init=2026-10-11T06:00
| Source | min | mean | max |
|---|---|---|---|
| P1 Validation | 0 | 0 | 0 |
| P2 Validation | 5.75 | 10.65 | 20.84 |
Availability — 244 of 244 positions complete

ensemble_agreement_scale_probability_of_total_precipitation_24_hour_surface_above_50p8
Metadata
| Field | Value |
|---|---|
| units | percent |
| long_name | Ensemble agreement scale probability of 24 hour total precipitation (surface) above 50.8 kg m-2 |
| short_name | ensemble_agreement_scale_probability_of_total_precipitation_24_hour_surface_above_50p8 |
| standard_name | n/a |
| step_type | accum |
| comment | Threshold applies to the preceding 24 hours of accumulation. Published every 3 forecast hours from lead 24 hours. Ensemble agreement scale probability of 24 hour total precipitation (surface) above 50.8 kg m-2. |
Point time series — 2026-08-13T00:00 - 2026-10-12T18:00, sampled lead=24h
| Point | min | mean | max |
|---|---|---|---|
| P1 | 0 | 2.374 | 49.69 |
| P2 | 0 | 0.0145 | 0.375 |
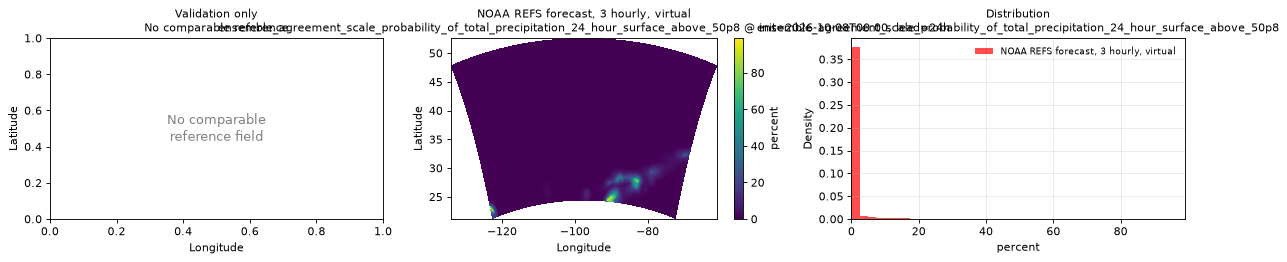
Spatial — init=2026-10-11T06:00, lead=24h (reference not available)
| Source | min | mean | max |
|---|---|---|---|
| Validation | 0 | 1.468 | 100 |
Temporal — init=2026-10-11T06:00
| Source | min | mean | max |
|---|---|---|---|
| P1 Validation | 0 | 0 | 0 |
| P2 Validation | 0 | 0 | 0 |
Availability — 244 of 244 positions complete

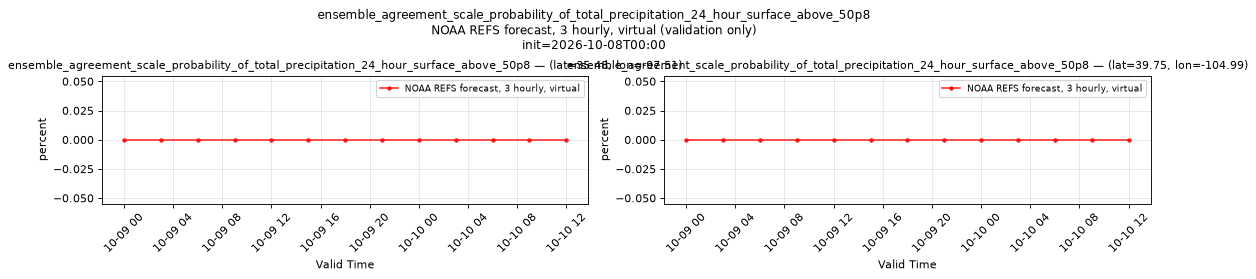
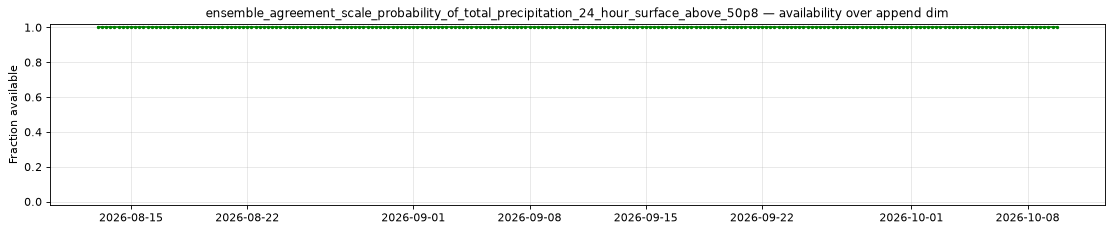
ensemble_agreement_scale_probability_of_total_precipitation_24_hour_surface_above_6p35
Metadata
| Field | Value |
|---|---|
| units | percent |
| long_name | Ensemble agreement scale probability of 24 hour total precipitation (surface) above 6.35 kg m-2 |
| short_name | ensemble_agreement_scale_probability_of_total_precipitation_24_hour_surface_above_6p35 |
| standard_name | n/a |
| step_type | accum |
| comment | Threshold applies to the preceding 24 hours of accumulation. Published every 3 forecast hours from lead 24 hours. Ensemble agreement scale probability of 24 hour total precipitation (surface) above 6.35 kg m-2. |
Point time series — 2026-08-13T00:00 - 2026-10-12T18:00, sampled lead=24h
| Point | min | mean | max |
|---|---|---|---|
| P1 | 0 | 17.84 | 100 |
| P2 | 0 | 13.4 | 85.47 |
Spatial — init=2026-10-11T06:00, lead=24h (reference not available)
| Source | min | mean | max |
|---|---|---|---|
| Validation | 0 | 19.21 | 100 |
Temporal — init=2026-10-11T06:00
| Source | min | mean | max |
|---|---|---|---|
| P1 Validation | 0 | 0 | 0 |
| P2 Validation | 0.9375 | 4.531 | 6.688 |
Availability — 244 of 244 positions complete
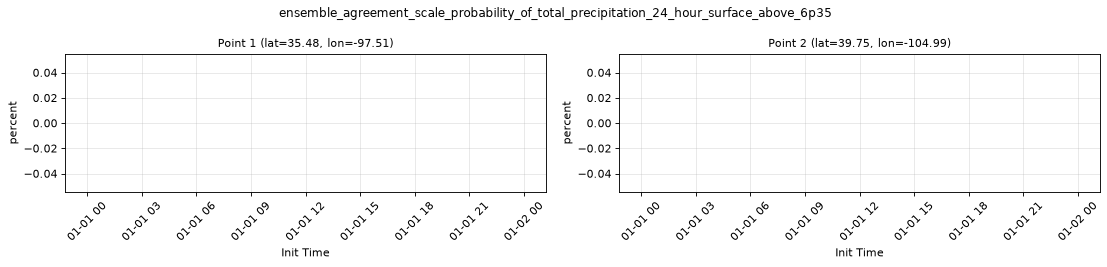
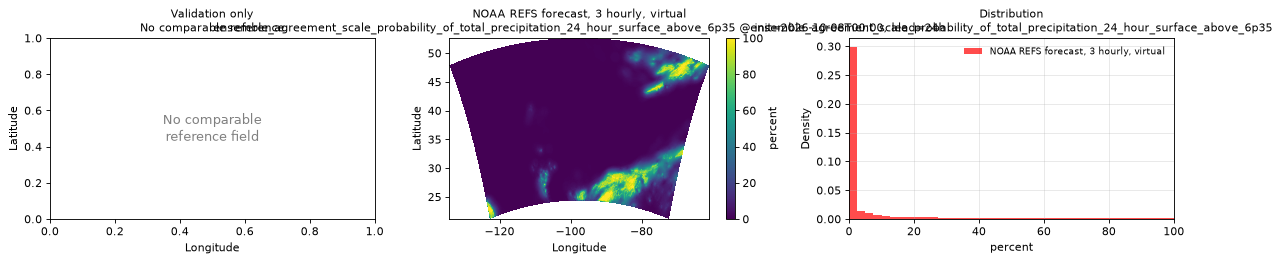

ensemble_agreement_scale_probability_of_total_precipitation_24_hour_surface_above_76p2
Metadata
| Field | Value |
|---|---|
| units | percent |
| long_name | Ensemble agreement scale probability of 24 hour total precipitation (surface) above 76.2 kg m-2 |
| short_name | ensemble_agreement_scale_probability_of_total_precipitation_24_hour_surface_above_76p2 |
| standard_name | n/a |
| step_type | accum |
| comment | Threshold applies to the preceding 24 hours of accumulation. Published every 3 forecast hours from lead 24 hours. Ensemble agreement scale probability of 24 hour total precipitation (surface) above 76.2 kg m-2. |
Point time series — 2026-08-13T00:00 - 2026-10-12T18:00, sampled lead=24h
| Point | min | mean | max |
|---|---|---|---|
| P1 | 0 | 1.057 | 30.73 |
| P2 | 0 | 0.0007364 | 0.03125 |
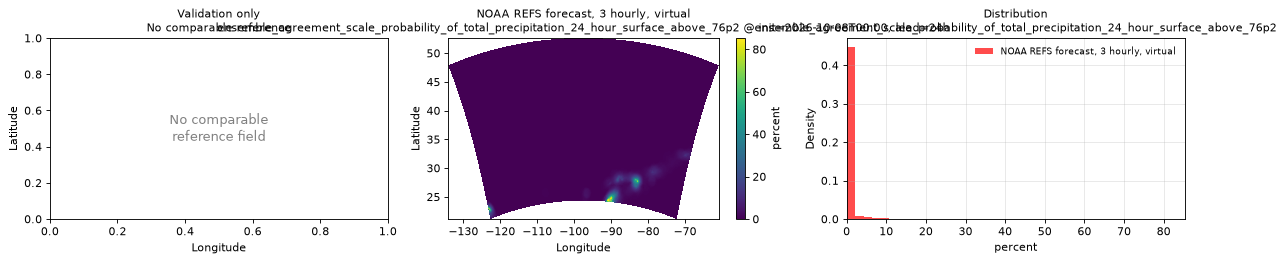
Spatial — init=2026-10-11T06:00, lead=24h (reference not available)
| Source | min | mean | max |
|---|---|---|---|
| Validation | 0 | 0.504 | 99.91 |
Temporal — init=2026-10-11T06:00
| Source | min | mean | max |
|---|---|---|---|
| P1 Validation | 0 | 0 | 0 |
| P2 Validation | 0 | 0 | 0 |
Availability — 244 of 244 positions complete
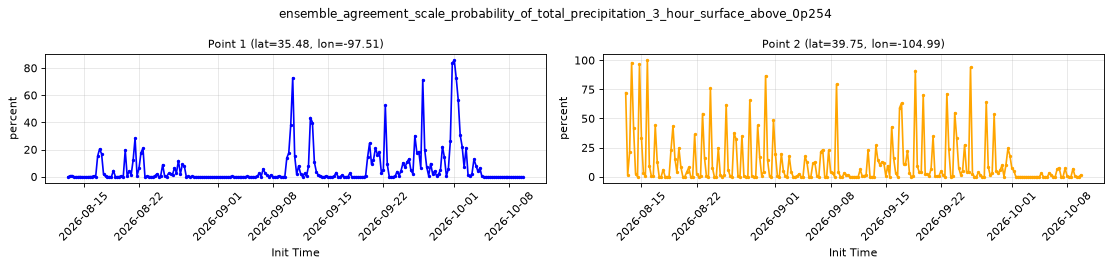
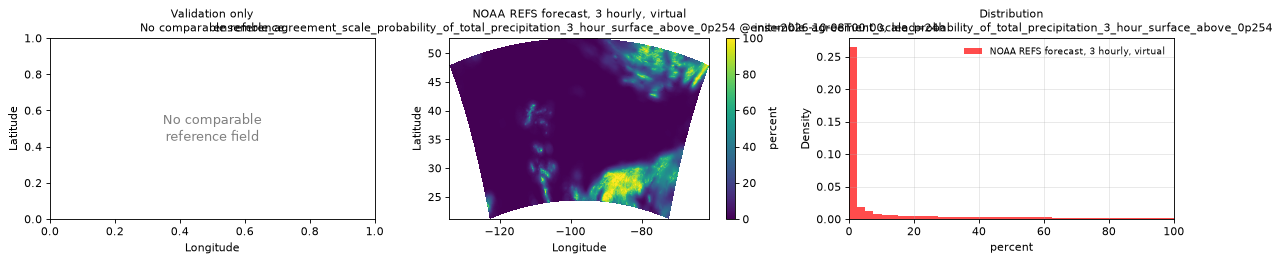
ensemble_agreement_scale_probability_of_total_precipitation_3_hour_surface_above_0p254
Metadata
| Field | Value |
|---|---|
| units | percent |
| long_name | Ensemble agreement scale probability of 3 hour total precipitation (surface) above 0.254 kg m-2 |
| short_name | ensemble_agreement_scale_probability_of_total_precipitation_3_hour_surface_above_0p254 |
| standard_name | n/a |
| step_type | accum |
| comment | Threshold applies to the preceding 3 hours of accumulation. Published every 3 forecast hours from lead 3 hours. Ensemble agreement scale probability of 3 hour total precipitation (surface) above 0.254 kg m-2. |
Point time series — 2026-08-13T00:00 - 2026-10-12T18:00, sampled lead=3h
| Point | min | mean | max |
|---|---|---|---|
| P1 | 0 | 24.58 | 99.97 |
| P2 | 0 | 12.83 | 96.72 |
Spatial — init=2026-10-11T06:00, lead=24h (reference not available)
| Source | min | mean | max |
|---|---|---|---|
| Validation | 0 | 17.72 | 100 |
Temporal — init=2026-10-11T06:00
| Source | min | mean | max |
|---|---|---|---|
| P1 Validation | 0 | 0 | 0 |
| P2 Validation | 1.156 | 12.05 | 35.09 |
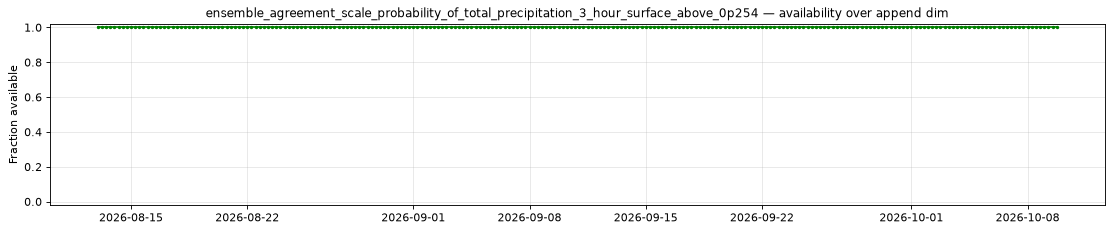
Availability — 244 of 244 positions complete

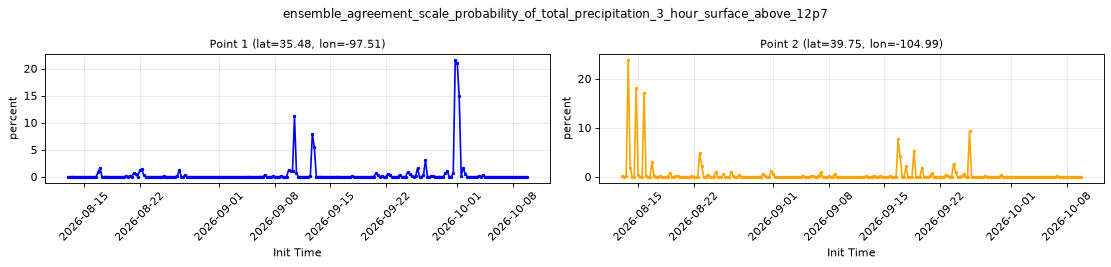
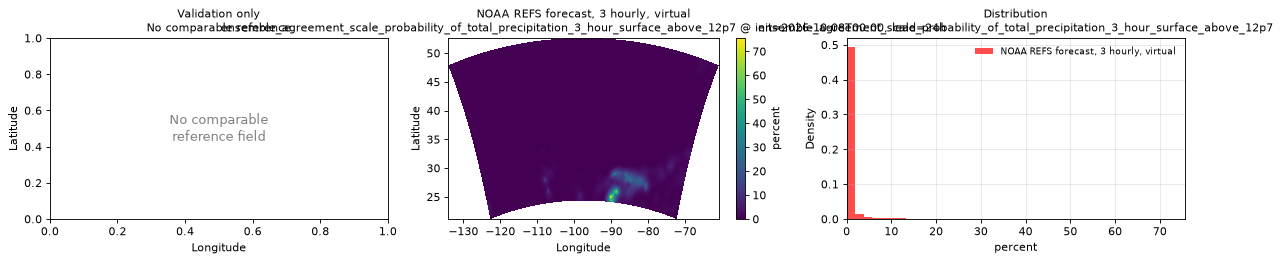
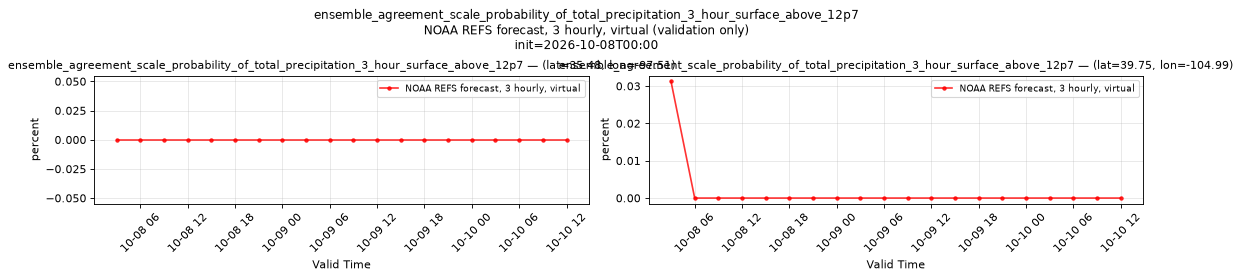
ensemble_agreement_scale_probability_of_total_precipitation_3_hour_surface_above_12p7
Metadata
| Field | Value |
|---|---|
| units | percent |
| long_name | Ensemble agreement scale probability of 3 hour total precipitation (surface) above 12.7 kg m-2 |
| short_name | ensemble_agreement_scale_probability_of_total_precipitation_3_hour_surface_above_12p7 |
| standard_name | n/a |
| step_type | accum |
| comment | Threshold applies to the preceding 3 hours of accumulation. Published every 3 forecast hours from lead 3 hours. Ensemble agreement scale probability of 3 hour total precipitation (surface) above 12.7 kg m-2. |
Point time series — 2026-08-13T00:00 - 2026-10-12T18:00, sampled lead=3h
| Point | min | mean | max |
|---|---|---|---|
| P1 | 0 | 1.659 | 51.69 |
| P2 | 0 | 0.111 | 5.125 |
Spatial — init=2026-10-11T06:00, lead=24h (reference not available)
| Source | min | mean | max |
|---|---|---|---|
| Validation | 0 | 0.8392 | 81.44 |
Temporal — init=2026-10-11T06:00
| Source | min | mean | max |
|---|---|---|---|
| P1 Validation | 0 | 0 | 0 |
| P2 Validation | 0 | 0 | 0 |
Availability — 244 of 244 positions complete
ensemble_agreement_scale_probability_of_total_precipitation_3_hour_surface_above_25p4
Metadata
| Field | Value |
|---|---|
| units | percent |
| long_name | Ensemble agreement scale probability of 3 hour total precipitation (surface) above 25.4 kg m-2 |
| short_name | ensemble_agreement_scale_probability_of_total_precipitation_3_hour_surface_above_25p4 |
| standard_name | n/a |
| step_type | accum |
| comment | Threshold applies to the preceding 3 hours of accumulation. Published every 3 forecast hours from lead 3 hours. Ensemble agreement scale probability of 3 hour total precipitation (surface) above 25.4 kg m-2. |
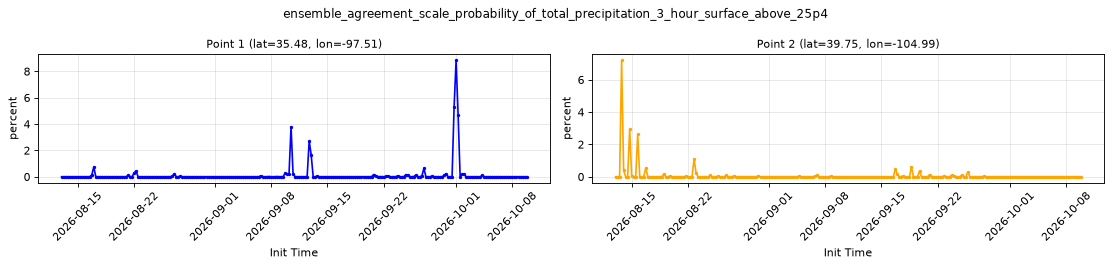
Point time series — 2026-08-13T00:00 - 2026-10-12T18:00, sampled lead=3h
| Point | min | mean | max |
|---|---|---|---|
| P1 | 0 | 0.7663 | 33.3 |
| P2 | 0 | 0.006724 | 0.4844 |
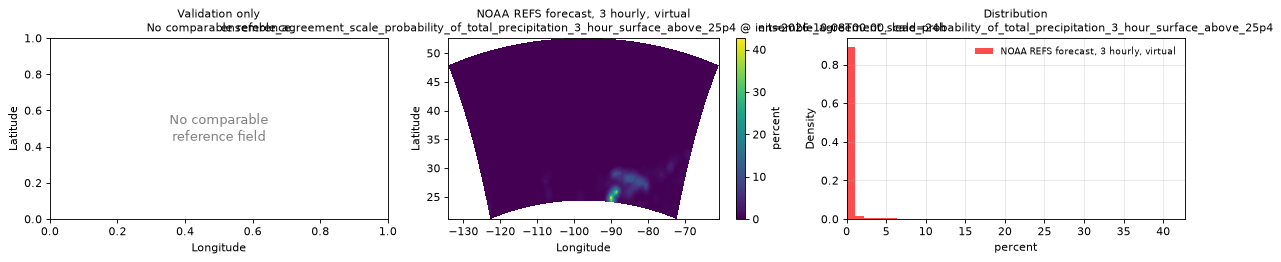
Spatial — init=2026-10-11T06:00, lead=24h (reference not available)
| Source | min | mean | max |
|---|---|---|---|
| Validation | 0 | 0.147 | 27.31 |
Temporal — init=2026-10-11T06:00
| Source | min | mean | max |
|---|---|---|---|
| P1 Validation | 0 | 0 | 0 |
| P2 Validation | 0 | 0 | 0 |
Availability — 244 of 244 positions complete
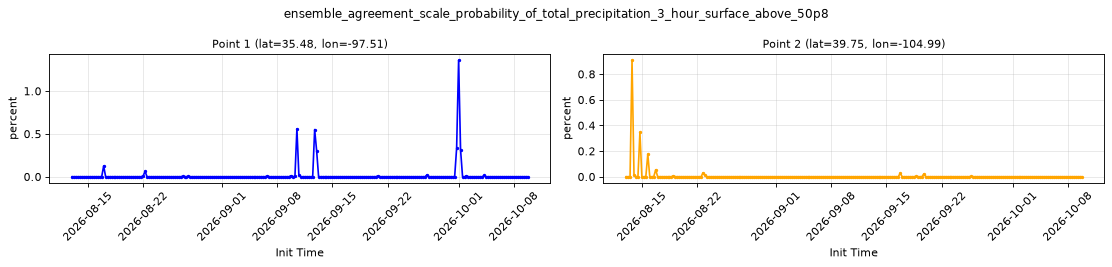
ensemble_agreement_scale_probability_of_total_precipitation_3_hour_surface_above_50p8
Metadata
| Field | Value |
|---|---|
| units | percent |
| long_name | Ensemble agreement scale probability of 3 hour total precipitation (surface) above 50.8 kg m-2 |
| short_name | ensemble_agreement_scale_probability_of_total_precipitation_3_hour_surface_above_50p8 |
| standard_name | n/a |
| step_type | accum |
| comment | Threshold applies to the preceding 3 hours of accumulation. Published every 3 forecast hours from lead 3 hours. Ensemble agreement scale probability of 3 hour total precipitation (surface) above 50.8 kg m-2. |
Point time series — 2026-08-13T00:00 - 2026-10-12T18:00, sampled lead=3h
| Point | min | mean | max |
|---|---|---|---|
| P1 | 0 | 0.1584 | 3.689 |
| P2 | 0 | 1.601e-05 | 0.001953 |
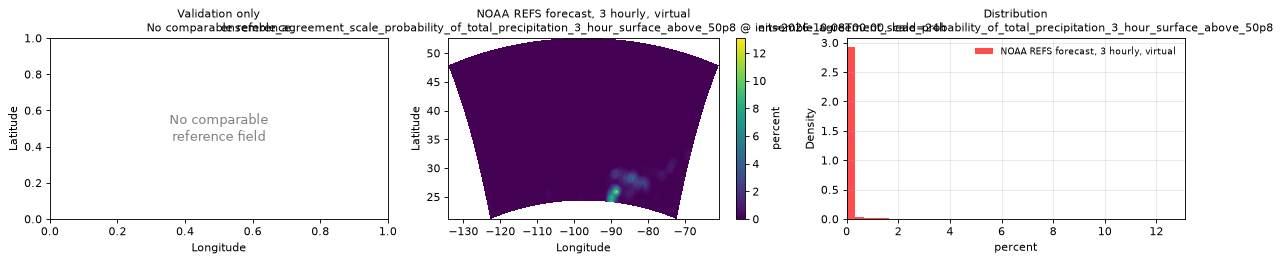
Spatial — init=2026-10-11T06:00, lead=24h (reference not available)
| Source | min | mean | max |
|---|---|---|---|
| Validation | 0 | 0.008893 | 0.7485 |
Temporal — init=2026-10-11T06:00
| Source | min | mean | max |
|---|---|---|---|
| P1 Validation | 0 | 0 | 0 |
| P2 Validation | 0 | 0 | 0 |
Availability — 244 of 244 positions complete

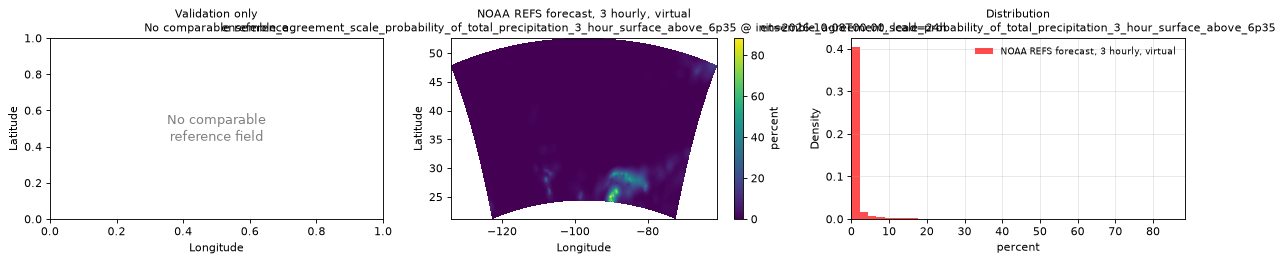
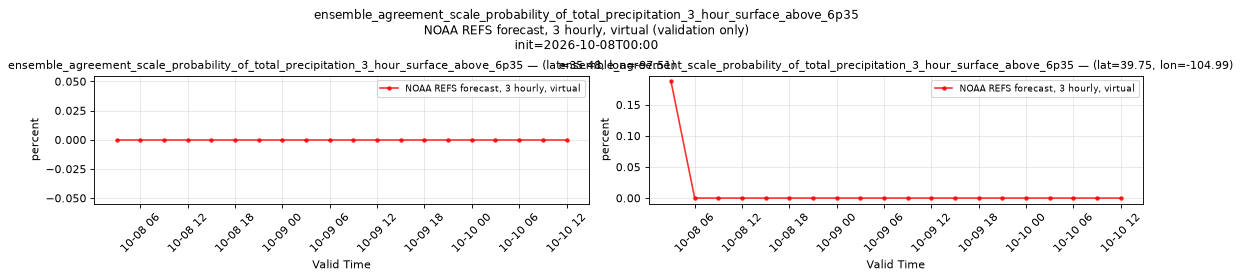
ensemble_agreement_scale_probability_of_total_precipitation_3_hour_surface_above_6p35
Metadata
| Field | Value |
|---|---|
| units | percent |
| long_name | Ensemble agreement scale probability of 3 hour total precipitation (surface) above 6.35 kg m-2 |
| short_name | ensemble_agreement_scale_probability_of_total_precipitation_3_hour_surface_above_6p35 |
| standard_name | n/a |
| step_type | accum |
| comment | Threshold applies to the preceding 3 hours of accumulation. Published every 3 forecast hours from lead 3 hours. Ensemble agreement scale probability of 3 hour total precipitation (surface) above 6.35 kg m-2. |
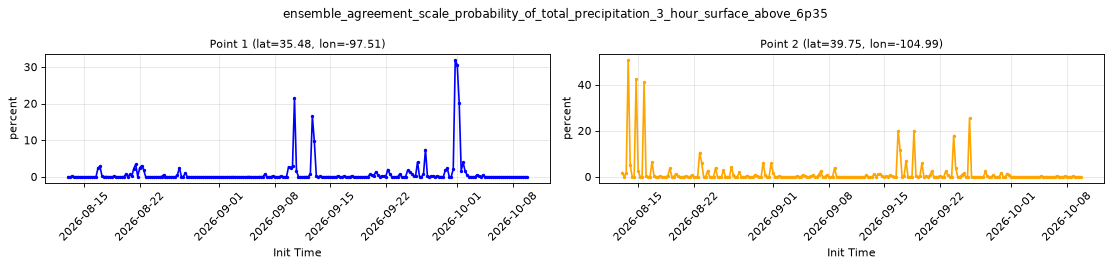
Point time series — 2026-08-13T00:00 - 2026-10-12T18:00, sampled lead=3h
| Point | min | mean | max |
|---|---|---|---|
| P1 | 0 | 2.793 | 68.16 |
| P2 | 0 | 0.7435 | 32.28 |
Spatial — init=2026-10-11T06:00, lead=24h (reference not available)
| Source | min | mean | max |
|---|---|---|---|
| Validation | 0 | 2.389 | 100 |
Temporal — init=2026-10-11T06:00
| Source | min | mean | max |
|---|---|---|---|
| P1 Validation | 0 | 0 | 0 |
| P2 Validation | 0 | 0.0625 | 0.4688 |
Availability — 244 of 244 positions complete
ensemble_agreement_scale_probability_of_total_precipitation_6_hour_surface_above_0p254
Metadata
| Field | Value |
|---|---|
| units | percent |
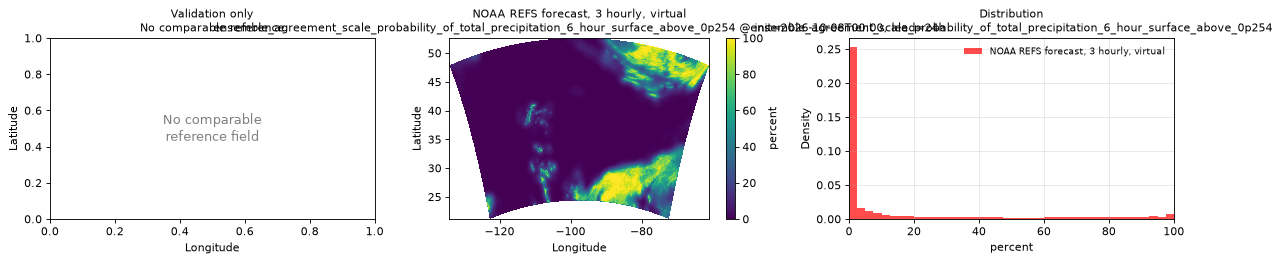
| long_name | Ensemble agreement scale probability of 6 hour total precipitation (surface) above 0.254 kg m-2 |
| short_name | ensemble_agreement_scale_probability_of_total_precipitation_6_hour_surface_above_0p254 |
| standard_name | n/a |
| step_type | accum |
| comment | Threshold applies to the preceding 6 hours of accumulation. Published every 3 forecast hours from lead 6 hours. Ensemble agreement scale probability of 6 hour total precipitation (surface) above 0.254 kg m-2. |
Point time series — 2026-08-13T00:00 - 2026-10-12T18:00, sampled lead=6h
| Point | min | mean | max |
|---|---|---|---|
| P1 | 0 | 34.64 | 100 |
| P2 | 0 | 21.07 | 100 |
Spatial — init=2026-10-11T06:00, lead=24h (reference not available)
| Source | min | mean | max |
|---|---|---|---|
| Validation | 0 | 25.23 | 100 |
Temporal — init=2026-10-11T06:00
| Source | min | mean | max |
|---|---|---|---|
| P1 Validation | 0 | 0 | 0 |
| P2 Validation | 4.156 | 18.96 | 52.62 |
Availability — 244 of 244 positions complete


ensemble_agreement_scale_probability_of_total_precipitation_6_hour_surface_above_12p7
Metadata
| Field | Value |
|---|---|
| units | percent |
| long_name | Ensemble agreement scale probability of 6 hour total precipitation (surface) above 12.7 kg m-2 |
| short_name | ensemble_agreement_scale_probability_of_total_precipitation_6_hour_surface_above_12p7 |
| standard_name | n/a |
| step_type | accum |
| comment | Threshold applies to the preceding 6 hours of accumulation. Published every 3 forecast hours from lead 6 hours. Ensemble agreement scale probability of 6 hour total precipitation (surface) above 12.7 kg m-2. |
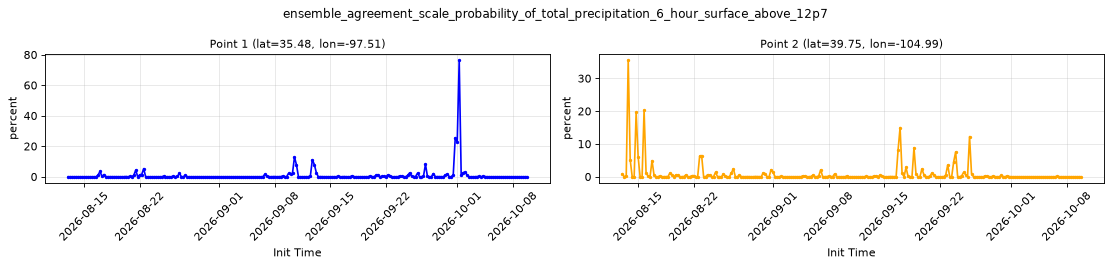
Point time series — 2026-08-13T00:00 - 2026-10-12T18:00, sampled lead=6h
| Point | min | mean | max |
|---|---|---|---|
| P1 | 0 | 3.025 | 59.12 |
| P2 | 0 | 0.372 | 7.938 |
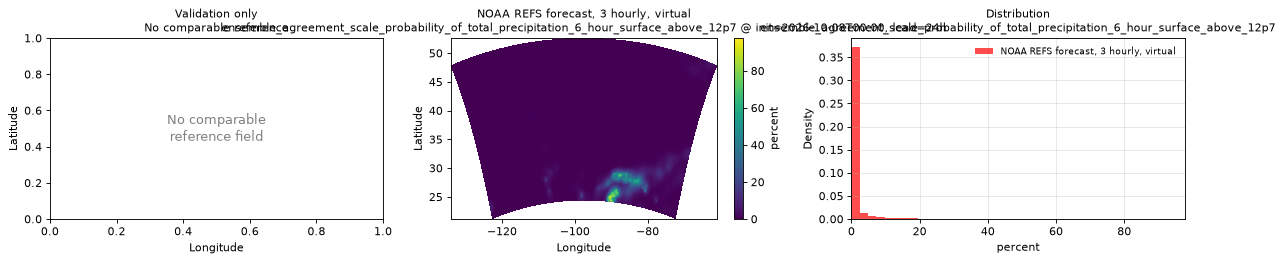
Spatial — init=2026-10-11T06:00, lead=24h (reference not available)
| Source | min | mean | max |
|---|---|---|---|
| Validation | 0 | 2.174 | 99.12 |
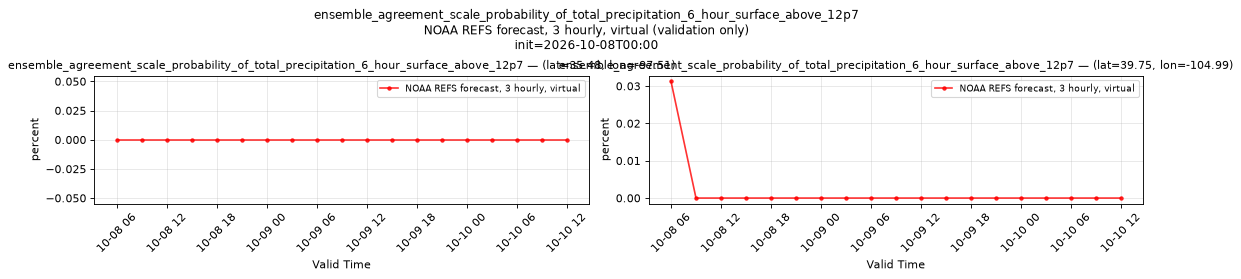
Temporal — init=2026-10-11T06:00
| Source | min | mean | max |
|---|---|---|---|
| P1 Validation | 0 | 0 | 0 |
| P2 Validation | 0 | 0.008224 | 0.09375 |
Availability — 244 of 244 positions complete
ensemble_agreement_scale_probability_of_total_precipitation_6_hour_surface_above_25p4
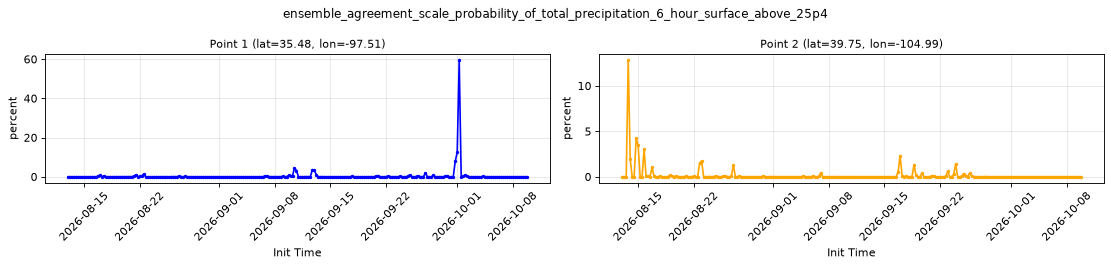
Metadata
| Field | Value |
|---|---|
| units | percent |
| long_name | Ensemble agreement scale probability of 6 hour total precipitation (surface) above 25.4 kg m-2 |
| short_name | ensemble_agreement_scale_probability_of_total_precipitation_6_hour_surface_above_25p4 |
| standard_name | n/a |
| step_type | accum |
| comment | Threshold applies to the preceding 6 hours of accumulation. Published every 3 forecast hours from lead 6 hours. Ensemble agreement scale probability of 6 hour total precipitation (surface) above 25.4 kg m-2. |
Point time series — 2026-08-13T00:00 - 2026-10-12T18:00, sampled lead=6h
| Point | min | mean | max |
|---|---|---|---|
| P1 | 0 | 1.431 | 41.72 |
| P2 | 0 | 0.0358 | 2.25 |
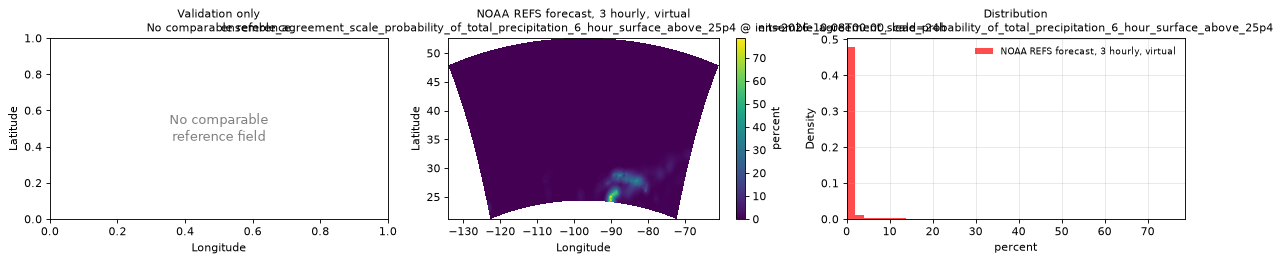
Spatial — init=2026-10-11T06:00, lead=24h (reference not available)
| Source | min | mean | max |
|---|---|---|---|
| Validation | 0 | 0.4842 | 50.69 |
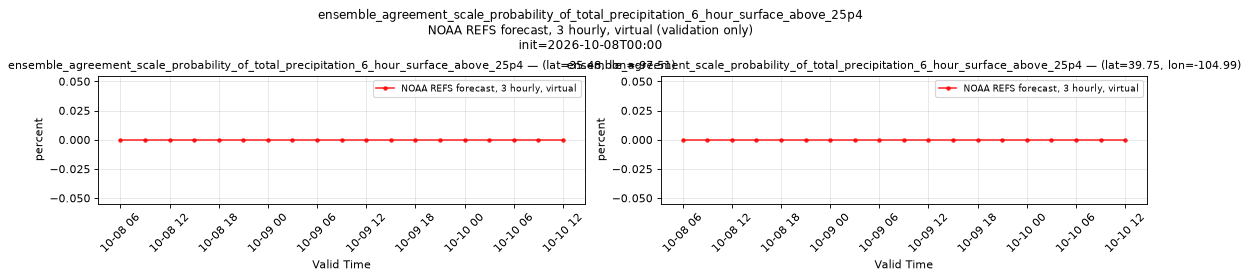
Temporal — init=2026-10-11T06:00
| Source | min | mean | max |
|---|---|---|---|
| P1 Validation | 0 | 0 | 0 |
| P2 Validation | 0 | 0 | 0 |
Availability — 244 of 244 positions complete
ensemble_agreement_scale_probability_of_total_precipitation_6_hour_surface_above_50p8
Metadata
| Field | Value |
|---|---|
| units | percent |
| long_name | Ensemble agreement scale probability of 6 hour total precipitation (surface) above 50.8 kg m-2 |
| short_name | ensemble_agreement_scale_probability_of_total_precipitation_6_hour_surface_above_50p8 |
| standard_name | n/a |
| step_type | accum |
| comment | Threshold applies to the preceding 6 hours of accumulation. Published every 3 forecast hours from lead 6 hours. Ensemble agreement scale probability of 6 hour total precipitation (surface) above 50.8 kg m-2. |
Point time series — 2026-08-13T00:00 - 2026-10-12T18:00, sampled lead=6h
| Point | min | mean | max |
|---|---|---|---|
| P1 | 0 | 0.365 | 10.81 |
| P2 | 0 | 0.001209 | 0.1406 |
Spatial — init=2026-10-11T06:00, lead=24h (reference not available)
| Source | min | mean | max |
|---|---|---|---|
| Validation | 0 | 0.03646 | 2.682 |
Temporal — init=2026-10-11T06:00
| Source | min | mean | max |
|---|---|---|---|
| P1 Validation | 0 | 0 | 0 |
| P2 Validation | 0 | 0 | 0 |
Availability — 244 of 244 positions complete
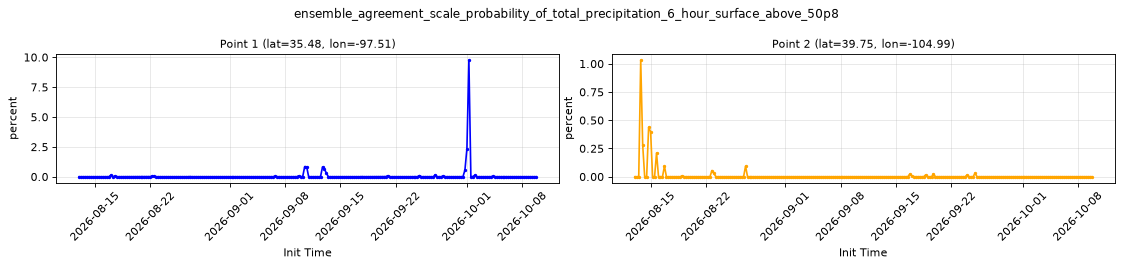
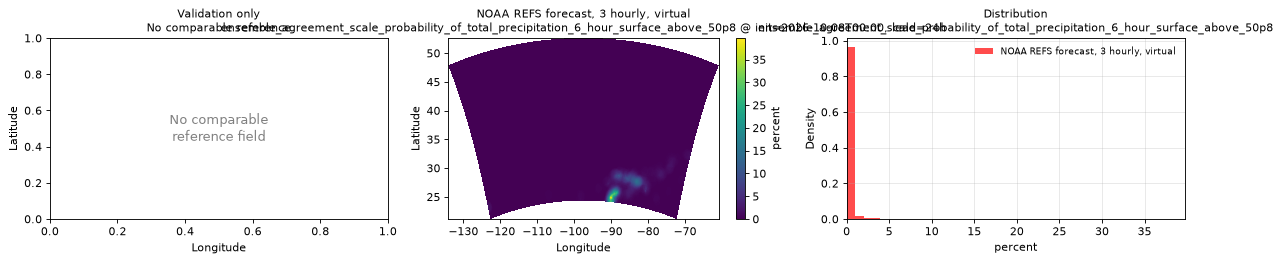

ensemble_agreement_scale_probability_of_total_precipitation_6_hour_surface_above_6p35
Metadata
| Field | Value |
|---|---|
| units | percent |
| long_name | Ensemble agreement scale probability of 6 hour total precipitation (surface) above 6.35 kg m-2 |
| short_name | ensemble_agreement_scale_probability_of_total_precipitation_6_hour_surface_above_6p35 |
| standard_name | n/a |
| step_type | accum |
| comment | Threshold applies to the preceding 6 hours of accumulation. Published every 3 forecast hours from lead 6 hours. Ensemble agreement scale probability of 6 hour total precipitation (surface) above 6.35 kg m-2. |
Point time series — 2026-08-13T00:00 - 2026-10-12T18:00, sampled lead=6h
| Point | min | mean | max |
|---|---|---|---|
| P1 | 0 | 4.981 | 78.19 |
| P2 | 0 | 2.466 | 56.28 |
Spatial — init=2026-10-11T06:00, lead=24h (reference not available)
| Source | min | mean | max |
|---|---|---|---|
| Validation | 0 | 5.562 | 100 |
Temporal — init=2026-10-11T06:00
| Source | min | mean | max |
|---|---|---|---|
| P1 Validation | 0 | 0 | 0 |
| P2 Validation | 0 | 0.3635 | 2.312 |
Availability — 244 of 244 positions complete
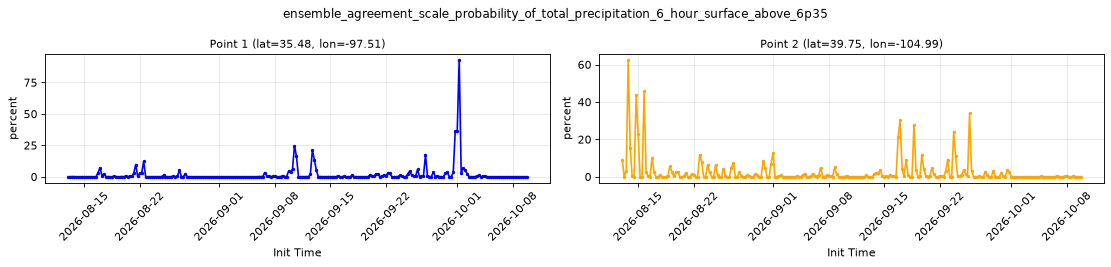
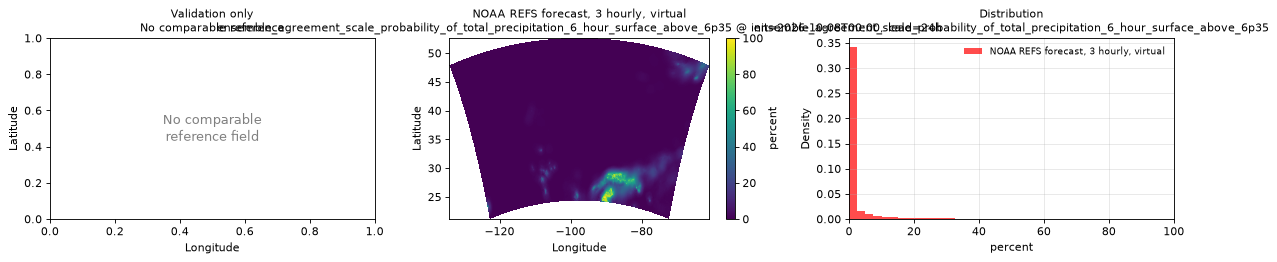
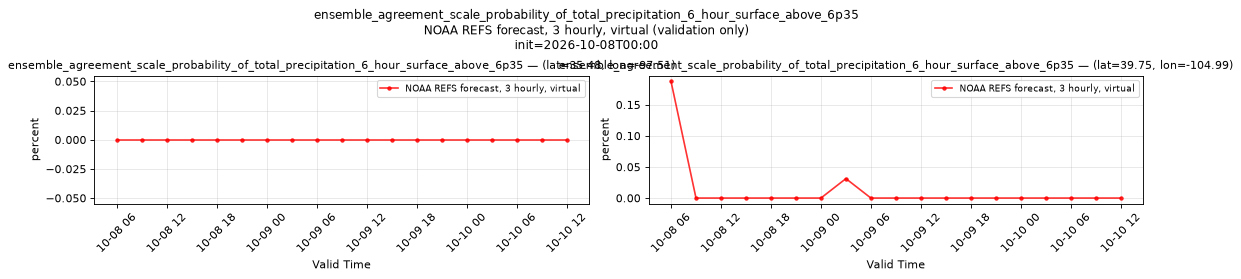
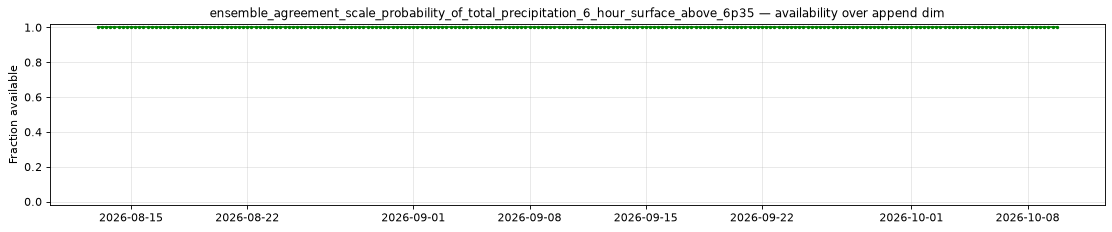
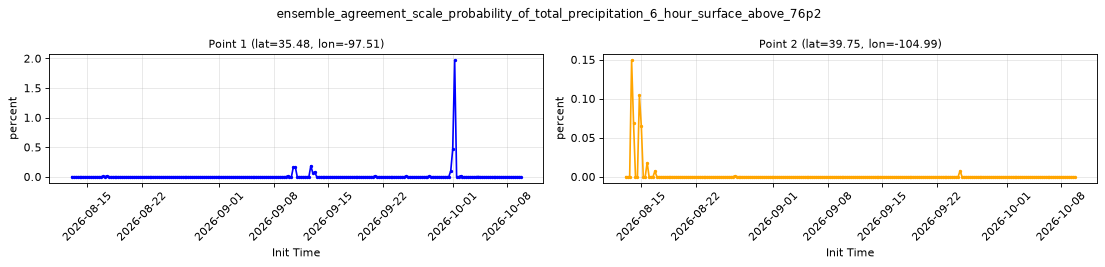
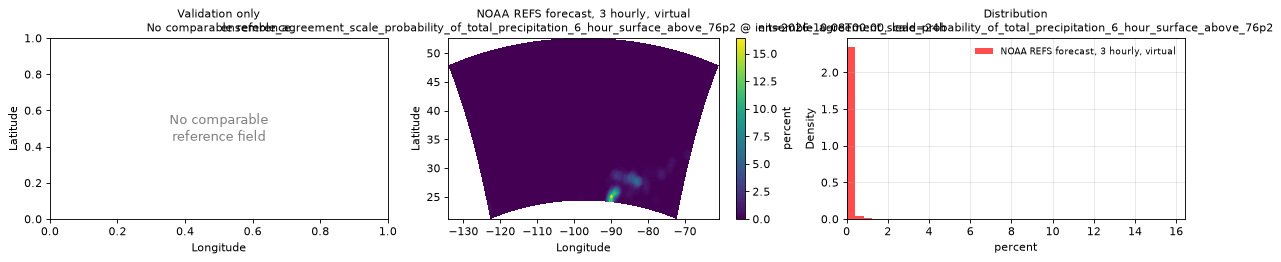
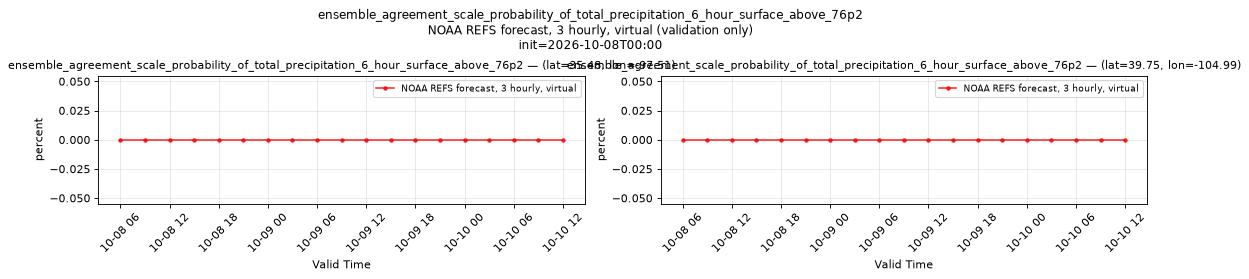
ensemble_agreement_scale_probability_of_total_precipitation_6_hour_surface_above_76p2
Metadata
| Field | Value |
|---|---|
| units | percent |
| long_name | Ensemble agreement scale probability of 6 hour total precipitation (surface) above 76.2 kg m-2 |
| short_name | ensemble_agreement_scale_probability_of_total_precipitation_6_hour_surface_above_76p2 |
| standard_name | n/a |
| step_type | accum |
| comment | Threshold applies to the preceding 6 hours of accumulation. Published every 3 forecast hours from lead 6 hours. Ensemble agreement scale probability of 6 hour total precipitation (surface) above 76.2 kg m-2. |
Point time series — 2026-08-13T00:00 - 2026-10-12T18:00, sampled lead=6h
| Point | min | mean | max |
|---|---|---|---|
| P1 | 0 | 0.09939 | 2.633 |
| P2 | 0 | 9.906e-05 | 0.01343 |
Spatial — init=2026-10-11T06:00, lead=24h (reference not available)
| Source | min | mean | max |
|---|---|---|---|
| Validation | 0 | 0.003726 | 0.5427 |
Temporal — init=2026-10-11T06:00
| Source | min | mean | max |
|---|---|---|---|
| P1 Validation | 0 | 0 | 0 |
| P2 Validation | 0 | 0 | 0 |
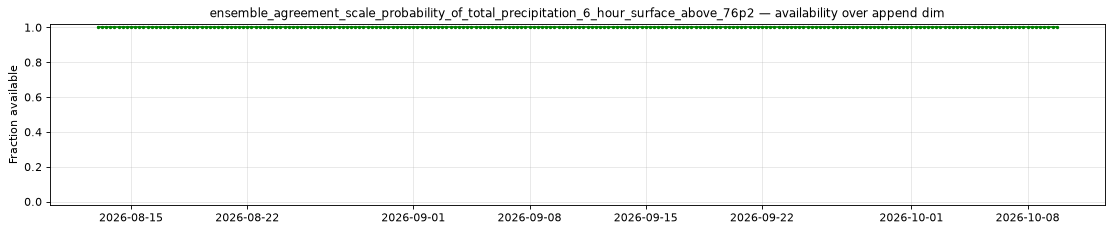
Availability — 244 of 244 positions complete
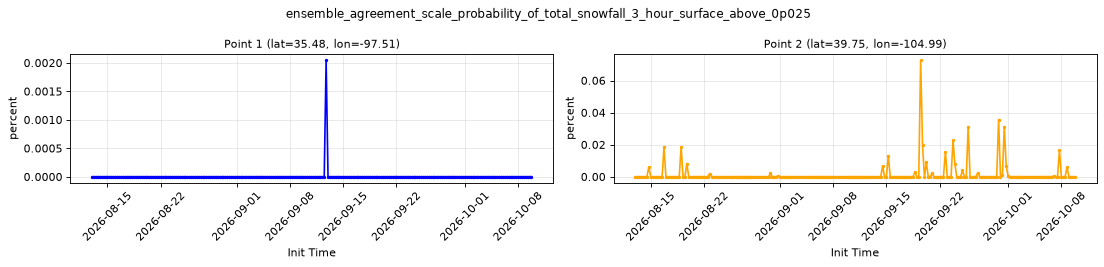
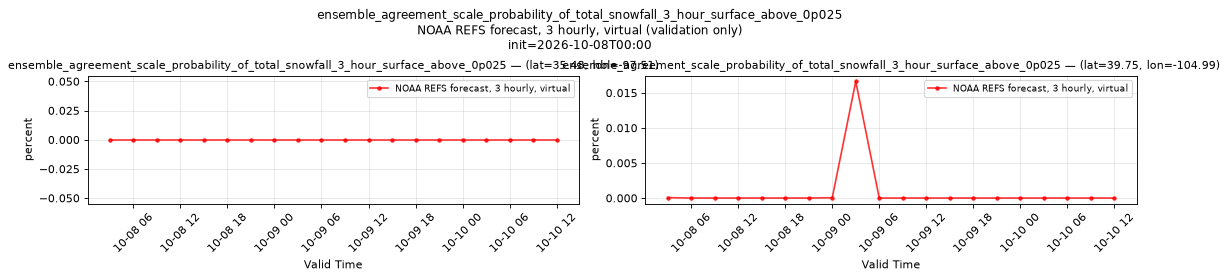
ensemble_agreement_scale_probability_of_total_snowfall_3_hour_surface_above_0p025
Metadata
| Field | Value |
|---|---|
| units | percent |
| long_name | Ensemble agreement scale probability of 3 hour total snowfall (surface) above 0.025 m |
| short_name | ensemble_agreement_scale_probability_of_total_snowfall_3_hour_surface_above_0p025 |
| standard_name | n/a |
| step_type | accum |
| comment | Threshold applies to the preceding 3 hours of accumulation. Published every 3 forecast hours from lead 3 hours. Ensemble agreement scale probability of 3 hour total snowfall (surface) above 0.025 m. |
Point time series — 2026-08-13T00:00 - 2026-10-12T18:00, sampled lead=3h
| Point | min | mean | max |
|---|---|---|---|
| P1 | 0 | 2.517e-05 | 0.004097 |
| P2 | 0 | 0.006568 | 0.3055 |
Spatial — init=2026-10-11T06:00, lead=24h (reference not available)
| Source | min | mean | max |
|---|---|---|---|
| Validation | 0 | 0.5085 | 100 |
Temporal — init=2026-10-11T06:00
| Source | min | mean | max |
|---|---|---|---|
| P1 Validation | 0 | 0 | 0 |
| P2 Validation | 0 | 0.1118 | 1.402 |
Availability — 244 of 244 positions complete


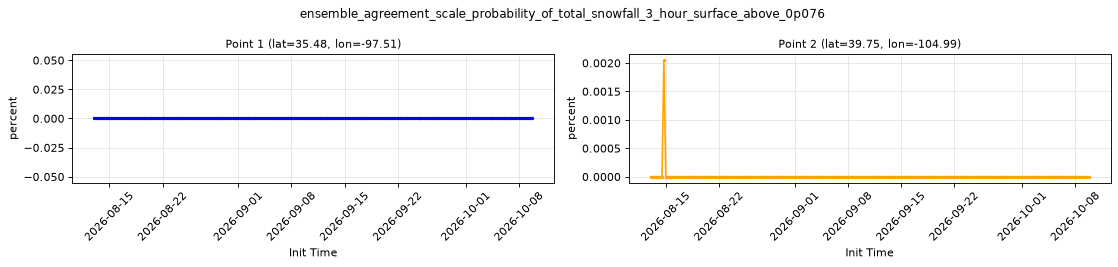
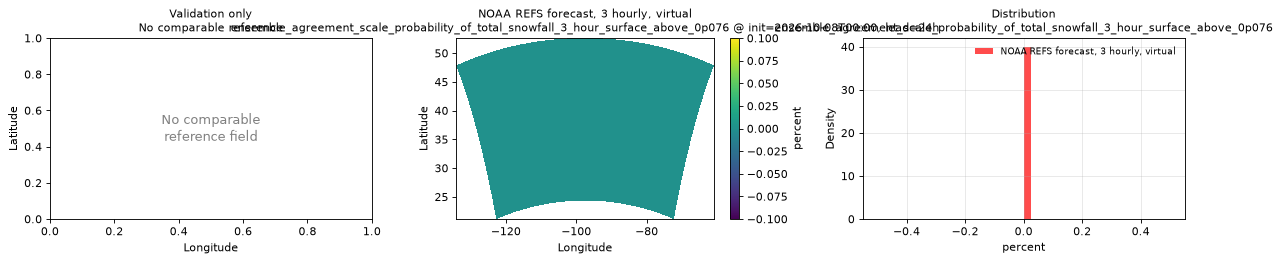
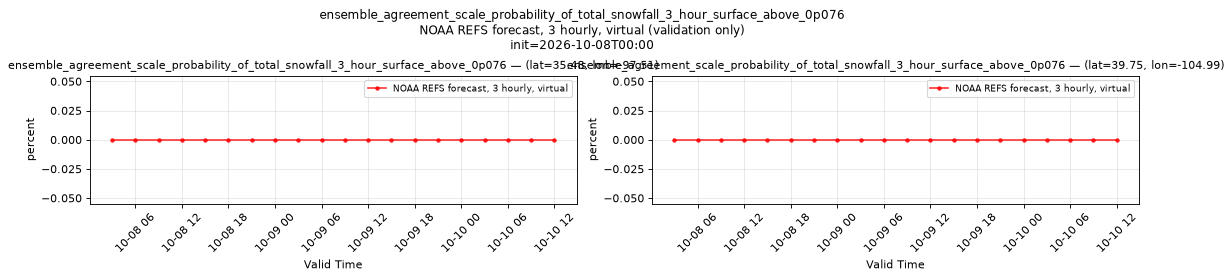
ensemble_agreement_scale_probability_of_total_snowfall_3_hour_surface_above_0p076
Metadata
| Field | Value |
|---|---|
| units | percent |
| long_name | Ensemble agreement scale probability of 3 hour total snowfall (surface) above 0.076 m |
| short_name | ensemble_agreement_scale_probability_of_total_snowfall_3_hour_surface_above_0p076 |
| standard_name | n/a |
| step_type | accum |
| comment | Threshold applies to the preceding 3 hours of accumulation. Published every 3 forecast hours from lead 3 hours. Ensemble agreement scale probability of 3 hour total snowfall (surface) above 0.076 m. |
Point time series — 2026-08-13T00:00 - 2026-10-12T18:00, sampled lead=3h
| Point | min | mean | max |
|---|---|---|---|
| P1 | 0 | 1.679e-05 | 0.004097 |
| P2 | 0 | 7.553e-05 | 0.006145 |
Spatial — init=2026-10-11T06:00, lead=24h (reference not available)
| Source | min | mean | max |
|---|---|---|---|
| Validation | 0 | 0.02339 | 15.71 |
Temporal — init=2026-10-11T06:00
| Source | min | mean | max |
|---|---|---|---|
| P1 Validation | 0 | 0 | 0 |
| P2 Validation | 0 | 0 | 0 |
Availability — 244 of 244 positions complete
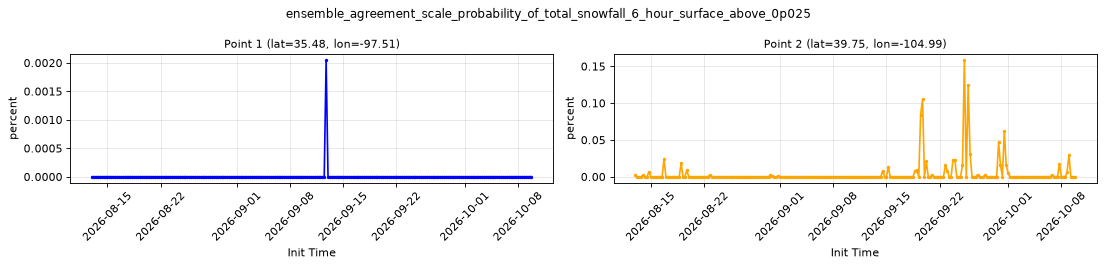
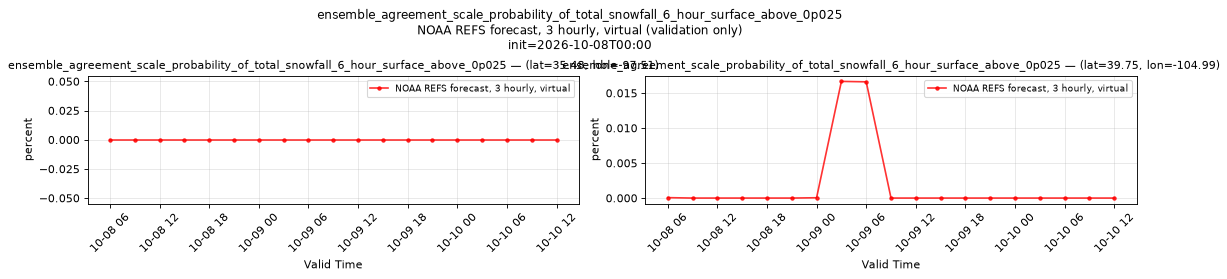
ensemble_agreement_scale_probability_of_total_snowfall_6_hour_surface_above_0p025
Metadata
| Field | Value |
|---|---|
| units | percent |
| long_name | Ensemble agreement scale probability of 6 hour total snowfall (surface) above 0.025 m |
| short_name | ensemble_agreement_scale_probability_of_total_snowfall_6_hour_surface_above_0p025 |
| standard_name | n/a |
| step_type | accum |
| comment | Threshold applies to the preceding 6 hours of accumulation. Published every 3 forecast hours from lead 6 hours. Ensemble agreement scale probability of 6 hour total snowfall (surface) above 0.025 m. |
Point time series — 2026-08-13T00:00 - 2026-10-12T18:00, sampled lead=6h
| Point | min | mean | max |
|---|---|---|---|
| P1 | 0 | 3.355e-05 | 0.004097 |
| P2 | 0 | 0.02217 | 1.281 |
Spatial — init=2026-10-11T06:00, lead=24h (reference not available)
| Source | min | mean | max |
|---|---|---|---|
| Validation | 0 | 0.9464 | 100 |
Temporal — init=2026-10-11T06:00
| Source | min | mean | max |
|---|---|---|---|
| P1 Validation | 0 | 0 | 0 |
| P2 Validation | 0 | 0.2525 | 1.891 |
Availability — 244 of 244 positions complete

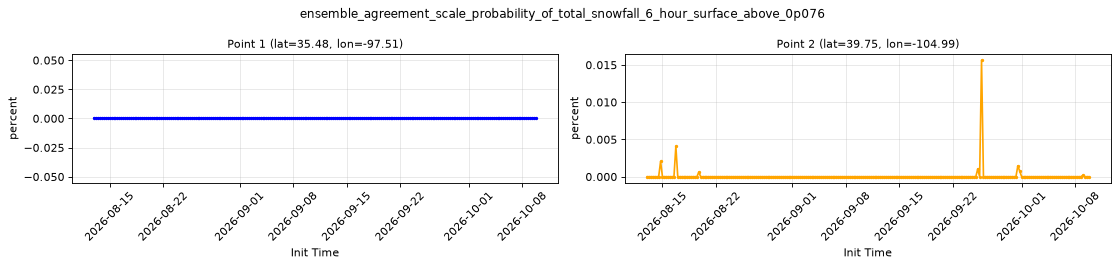
ensemble_agreement_scale_probability_of_total_snowfall_6_hour_surface_above_0p076
Metadata
| Field | Value |
|---|---|
| units | percent |
| long_name | Ensemble agreement scale probability of 6 hour total snowfall (surface) above 0.076 m |
| short_name | ensemble_agreement_scale_probability_of_total_snowfall_6_hour_surface_above_0p076 |
| standard_name | n/a |
| step_type | accum |
| comment | Threshold applies to the preceding 6 hours of accumulation. Published every 3 forecast hours from lead 6 hours. Ensemble agreement scale probability of 6 hour total snowfall (surface) above 0.076 m. |
Point time series — 2026-08-13T00:00 - 2026-10-12T18:00, sampled lead=6h
| Point | min | mean | max |
|---|---|---|---|
| P1 | 0 | 1.679e-05 | 0.004097 |
| P2 | 0 | 0.0003063 | 0.0249 |
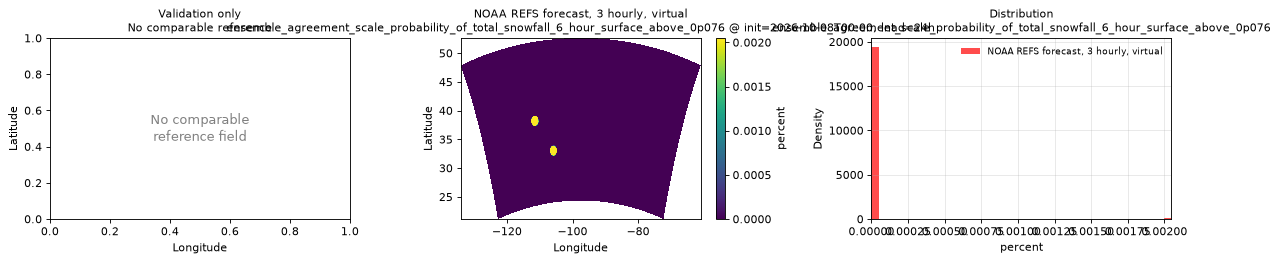
Spatial — init=2026-10-11T06:00, lead=24h (reference not available)
| Source | min | mean | max |
|---|---|---|---|
| Validation | 0 | 0.2154 | 97 |
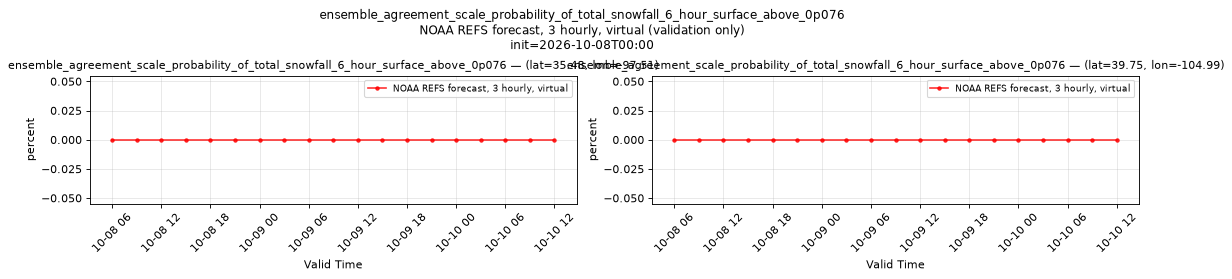
Temporal — init=2026-10-11T06:00
| Source | min | mean | max |
|---|---|---|---|
| P1 Validation | 0 | 0 | 0 |
| P2 Validation | 0 | 0.001953 | 0.02344 |
Availability — 244 of 244 positions complete
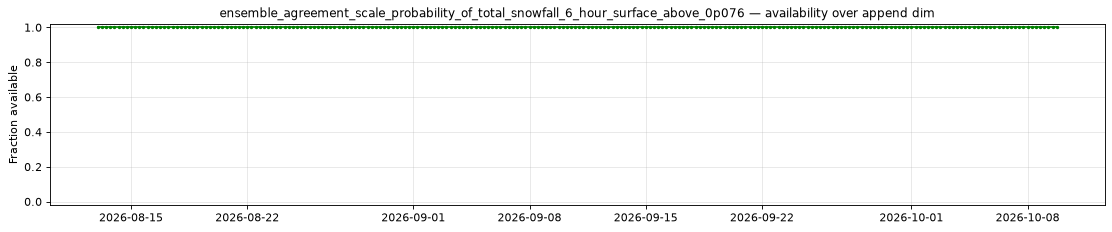
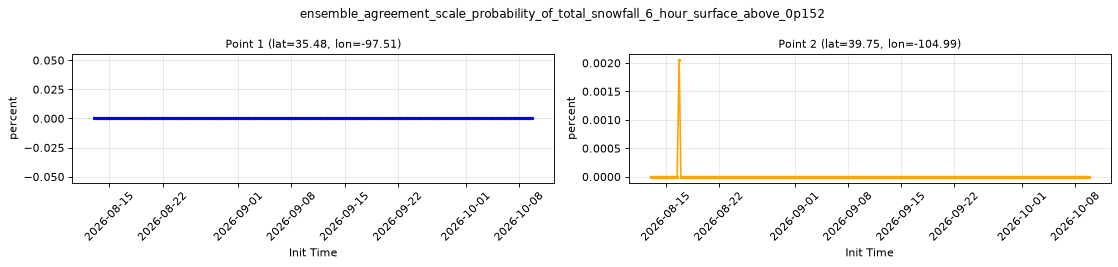
ensemble_agreement_scale_probability_of_total_snowfall_6_hour_surface_above_0p152
Metadata
| Field | Value |
|---|---|
| units | percent |
| long_name | Ensemble agreement scale probability of 6 hour total snowfall (surface) above 0.152 m |
| short_name | ensemble_agreement_scale_probability_of_total_snowfall_6_hour_surface_above_0p152 |
| standard_name | n/a |
| step_type | accum |
| comment | Threshold applies to the preceding 6 hours of accumulation. Published every 3 forecast hours from lead 6 hours. Ensemble agreement scale probability of 6 hour total snowfall (surface) above 0.152 m. |
Point time series — 2026-08-13T00:00 - 2026-10-12T18:00, sampled lead=6h
| Point | min | mean | max |
|---|---|---|---|
| P1 | 0 | 0 | 0 |
| P2 | 0 | 0 | 0 |
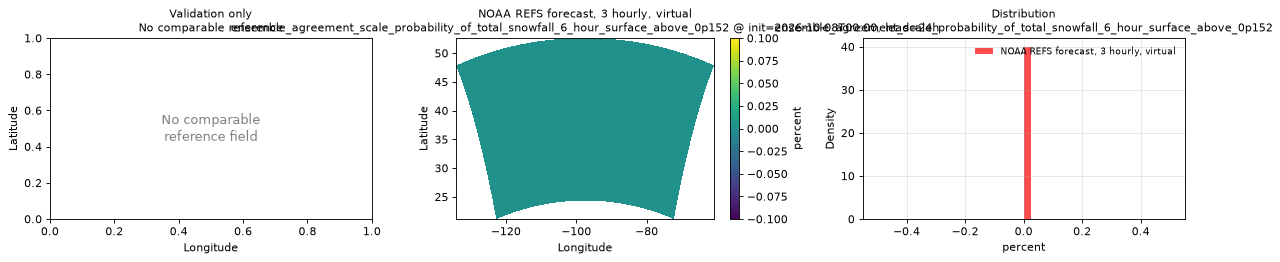
Spatial — init=2026-10-11T06:00, lead=24h (reference not available)
| Source | min | mean | max |
|---|---|---|---|
| Validation | 0 | 0.01326 | 4.934 |
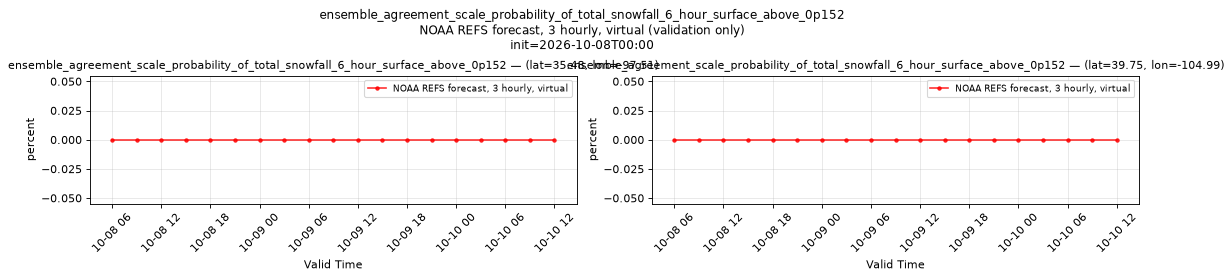
Temporal — init=2026-10-11T06:00
| Source | min | mean | max |
|---|---|---|---|
| P1 Validation | 0 | 0 | 0 |
| P2 Validation | 0 | 0 | 0 |
Availability — 244 of 244 positions complete
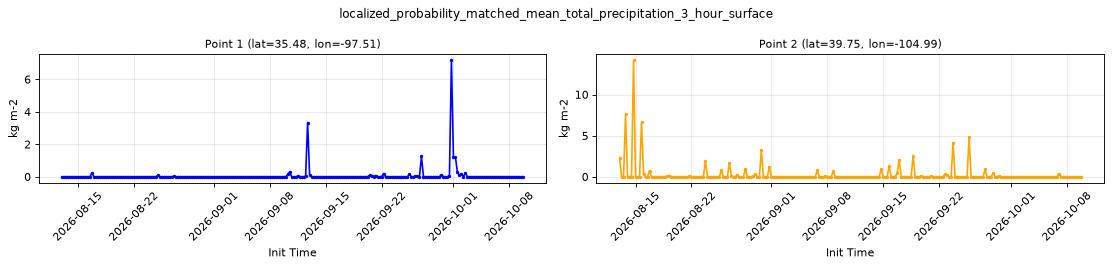
localized_probability_matched_mean_total_precipitation_3_hour_surface
Metadata
| Field | Value |
|---|---|
| units | kg m-2 |
| long_name | Localized probability-matched mean of total precipitation |
| short_name | localized_probability_matched_mean_total_precipitation_3_hour_surface |
| standard_name | precipitation_amount |
| step_type | accum |
| comment | Accumulated over the preceding 3 hours. Published every 3 forecast hours from lead 3 hours. |
Point time series — 2026-08-13T00:00 - 2026-10-12T18:00, sampled lead=3h
| Point | min | mean | max |
|---|---|---|---|
| P1 | -4e-05 | 1.133 | 56.92 |
| P2 | 0 | 0.2327 | 12.96 |
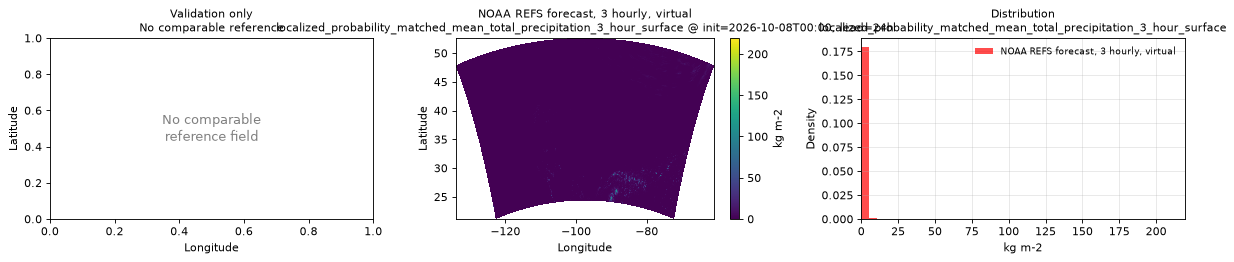
Spatial — init=2026-10-11T06:00, lead=24h (reference not available)
| Source | min | mean | max |
|---|---|---|---|
| Validation | -0.0001 | 0.5171 | 70.95 |
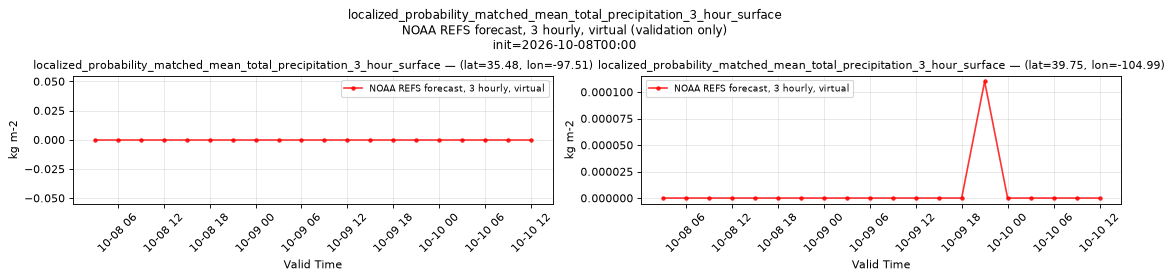
Temporal — init=2026-10-11T06:00
| Source | min | mean | max |
|---|---|---|---|
| P1 Validation | 0 | 0 | 0 |
| P2 Validation | -9e-05 | 0.009164 | 0.1328 |
Availability — 244 of 244 positions complete
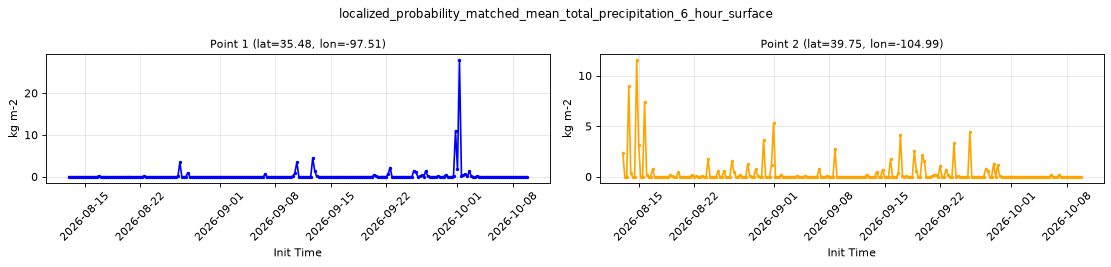
localized_probability_matched_mean_total_precipitation_6_hour_surface
Metadata
| Field | Value |
|---|---|
| units | kg m-2 |
| long_name | Localized probability-matched mean of total precipitation |
| short_name | localized_probability_matched_mean_total_precipitation_6_hour_surface |
| standard_name | precipitation_amount |
| step_type | accum |
| comment | Accumulated over the preceding 6 hours. Published every 3 forecast hours from lead 6 hours. |
Point time series — 2026-08-13T00:00 - 2026-10-12T18:00, sampled lead=6h
| Point | min | mean | max |
|---|---|---|---|
| P1 | -9e-05 | 1.499 | 53.24 |
| P2 | -8e-05 | 0.4887 | 12.63 |
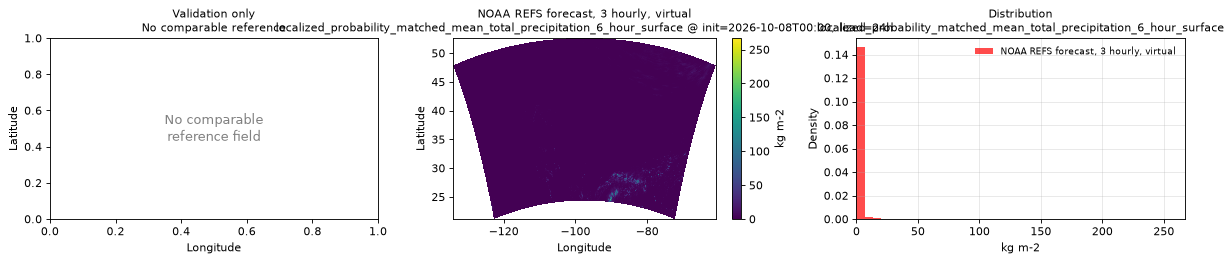
Spatial — init=2026-10-11T06:00, lead=24h (reference not available)
| Source | min | mean | max |
|---|---|---|---|
| Validation | -0.0002 | 1.026 | 78.31 |
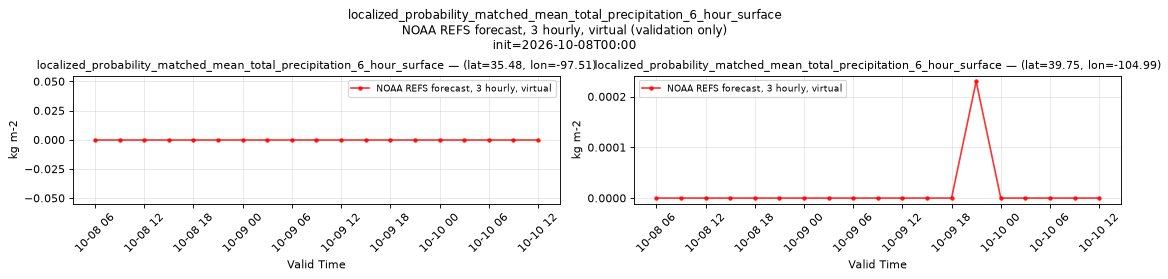
Temporal — init=2026-10-11T06:00
| Source | min | mean | max |
|---|---|---|---|
| P1 Validation | 0 | 0 | 0 |
| P2 Validation | -0.0001 | 0.02178 | 0.2127 |
Availability — 244 of 244 positions complete
mean_probability_matched_mean_average_total_precipitation_3_hour_surface
Metadata
| Field | Value |
|---|---|
| units | kg m-2 |
| long_name | Average of the ensemble mean and probability-matched mean of total precipitation |
| short_name | mean_probability_matched_mean_average_total_precipitation_3_hour_surface |
| standard_name | precipitation_amount |
| step_type | accum |
| comment | Accumulated over the preceding 3 hours. Published every 3 forecast hours from lead 3 hours. |
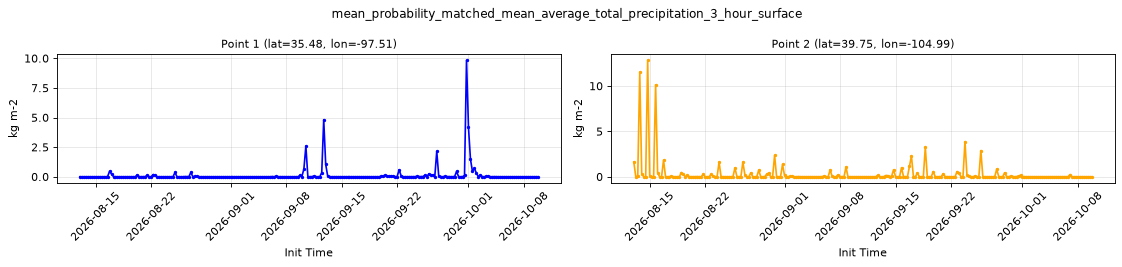
Point time series — 2026-08-13T00:00 - 2026-10-12T18:00, sampled lead=3h
| Point | min | mean | max |
|---|---|---|---|
| P1 | 0 | 1.078 | 39.64 |
| P2 | -5e-05 | 0.2195 | 10.22 |
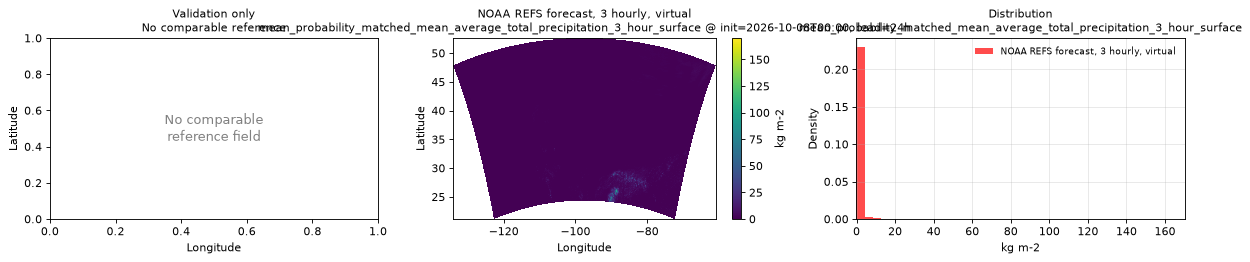
Spatial — init=2026-10-11T06:00, lead=24h (reference not available)
| Source | min | mean | max |
|---|---|---|---|
| Validation | -0.03351 | 0.5569 | 46.36 |
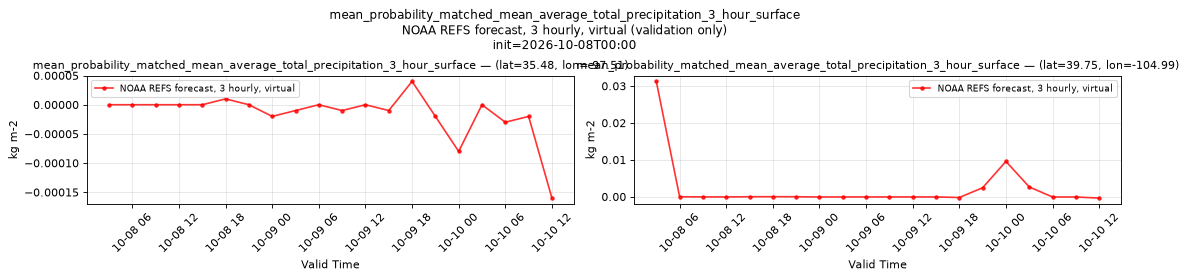
Temporal — init=2026-10-11T06:00
| Source | min | mean | max |
|---|---|---|---|
| P1 Validation | -0.0001 | -4.05e-05 | 0 |
| P2 Validation | -8e-05 | 0.04005 | 0.2397 |
Availability — 244 of 244 positions complete
neighborhood_probability_of_freezing_rain_12_hour_surface_above_0p254
Metadata
| Field | Value |
|---|---|
| units | percent |
| long_name | Neighborhood probability of 12 hour freezing rain (surface) above 0.254 kg m-2 |
| short_name | neighborhood_probability_of_freezing_rain_12_hour_surface_above_0p254 |
| standard_name | n/a |
| step_type | accum |
| comment | Threshold applies to the preceding 12 hours of accumulation. Published every 3 forecast hours from lead 12 hours. Neighborhood probability of 12 hour freezing rain (surface) above 0.254 kg m-2. |
Point time series — 2026-08-13T00:00 - 2026-10-12T18:00, sampled lead=12h
| Point | min | mean | max |
|---|---|---|---|
| P1 | 0 | 0 | 0 |
| P2 | 0 | 0.04918 | 6.5 |
Spatial — init=2026-10-11T06:00, lead=24h (reference not available)
| Source | min | mean | max |
|---|---|---|---|
| Validation | 0 | 0.6004 | 100 |
Temporal — init=2026-10-11T06:00
| Source | min | mean | max |
|---|---|---|---|
| P1 Validation | 0 | 0 | 0 |
| P2 Validation | 0 | 0.8235 | 12 |
Availability — 244 of 244 positions complete

neighborhood_probability_of_freezing_rain_12_hour_surface_above_12p7
Metadata
| Field | Value |
|---|---|
| units | percent |
| long_name | Neighborhood probability of 12 hour freezing rain (surface) above 12.7 kg m-2 |
| short_name | neighborhood_probability_of_freezing_rain_12_hour_surface_above_12p7 |
| standard_name | n/a |
| step_type | accum |
| comment | Threshold applies to the preceding 12 hours of accumulation. Published every 3 forecast hours from lead 12 hours. Neighborhood probability of 12 hour freezing rain (surface) above 12.7 kg m-2. |
Point time series — 2026-08-13T00:00 - 2026-10-12T18:00, sampled lead=12h
| Point | min | mean | max |
|---|---|---|---|
| P1 | 0 | 0 | 0 |
| P2 | 0 | 0 | 0 |
Spatial — init=2026-10-11T06:00, lead=24h (reference not available)
| Source | min | mean | max |
|---|---|---|---|
| Validation | 0 | 0.002903 | 28.5 |
Temporal — init=2026-10-11T06:00
| Source | min | mean | max |
|---|---|---|---|
| P1 Validation | 0 | 0 | 0 |
| P2 Validation | 0 | 0 | 0 |
Availability — 244 of 244 positions complete

neighborhood_probability_of_freezing_rain_12_hour_surface_above_2p54
Metadata
| Field | Value |
|---|---|
| units | percent |
| long_name | Neighborhood probability of 12 hour freezing rain (surface) above 2.54 kg m-2 |
| short_name | neighborhood_probability_of_freezing_rain_12_hour_surface_above_2p54 |
| standard_name | n/a |
| step_type | accum |
| comment | Threshold applies to the preceding 12 hours of accumulation. Published every 3 forecast hours from lead 12 hours. Neighborhood probability of 12 hour freezing rain (surface) above 2.54 kg m-2. |
Point time series — 2026-08-13T00:00 - 2026-10-12T18:00, sampled lead=12h
| Point | min | mean | max |
|---|---|---|---|
| P1 | 0 | 0 | 0 |
| P2 | 0 | 0 | 0 |
Spatial — init=2026-10-11T06:00, lead=24h (reference not available)
| Source | min | mean | max |
|---|---|---|---|
| Validation | 0 | 0.1203 | 93 |
Temporal — init=2026-10-11T06:00
| Source | min | mean | max |
|---|---|---|---|
| P1 Validation | 0 | 0 | 0 |
| P2 Validation | 0 | 0 | 0 |
Availability — 244 of 244 positions complete
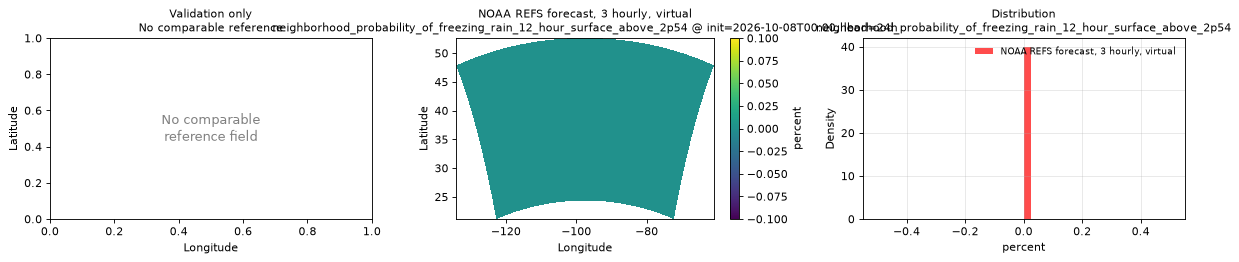


neighborhood_probability_of_freezing_rain_12_hour_surface_above_6p35
Metadata
| Field | Value |
|---|---|
| units | percent |
| long_name | Neighborhood probability of 12 hour freezing rain (surface) above 6.35 kg m-2 |
| short_name | neighborhood_probability_of_freezing_rain_12_hour_surface_above_6p35 |
| standard_name | n/a |
| step_type | accum |
| comment | Threshold applies to the preceding 12 hours of accumulation. Published every 3 forecast hours from lead 12 hours. Neighborhood probability of 12 hour freezing rain (surface) above 6.35 kg m-2. |
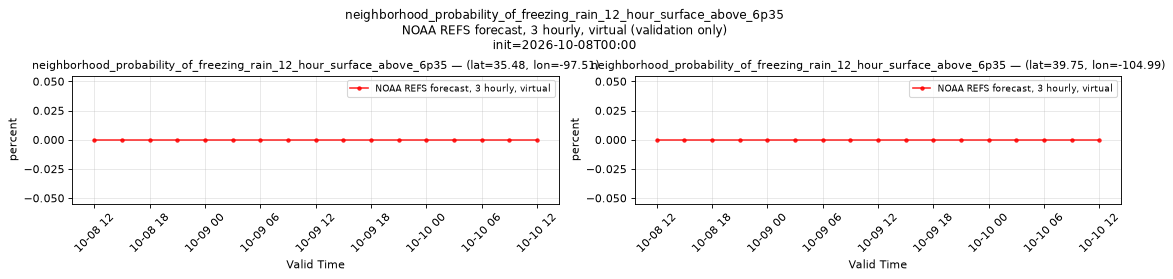
Point time series — 2026-08-13T00:00 - 2026-10-12T18:00, sampled lead=12h
| Point | min | mean | max |
|---|---|---|---|
| P1 | 0 | 0 | 0 |
| P2 | 0 | 0 | 0 |
Spatial — init=2026-10-11T06:00, lead=24h (reference not available)
| Source | min | mean | max |
|---|---|---|---|
| Validation | 0 | 0.02575 | 64.5 |
Temporal — init=2026-10-11T06:00
| Source | min | mean | max |
|---|---|---|---|
| P1 Validation | 0 | 0 | 0 |
| P2 Validation | 0 | 0 | 0 |
Availability — 244 of 244 positions complete

neighborhood_probability_of_freezing_rain_24_hour_surface_above_0p254
Metadata
| Field | Value |
|---|---|
| units | percent |
| long_name | Neighborhood probability of 24 hour freezing rain (surface) above 0.254 kg m-2 |
| short_name | neighborhood_probability_of_freezing_rain_24_hour_surface_above_0p254 |
| standard_name | n/a |
| step_type | accum |
| comment | Threshold applies to the preceding 24 hours of accumulation. Published every 3 forecast hours from lead 24 hours. Neighborhood probability of 24 hour freezing rain (surface) above 0.254 kg m-2. |
Point time series — 2026-08-13T00:00 - 2026-10-12T18:00, sampled lead=24h
| Point | min | mean | max |
|---|---|---|---|
| P1 | 0 | 0 | 0 |
| P2 | 0 | 0.416 | 31.5 |
Spatial — init=2026-10-11T06:00, lead=24h (reference not available)
| Source | min | mean | max |
|---|---|---|---|
| Validation | 0 | 0.8606 | 100 |
Temporal — init=2026-10-11T06:00
| Source | min | mean | max |
|---|---|---|---|
| P1 Validation | 0 | 0 | 0 |
| P2 Validation | 0 | 1.077 | 12 |
Availability — 244 of 244 positions complete

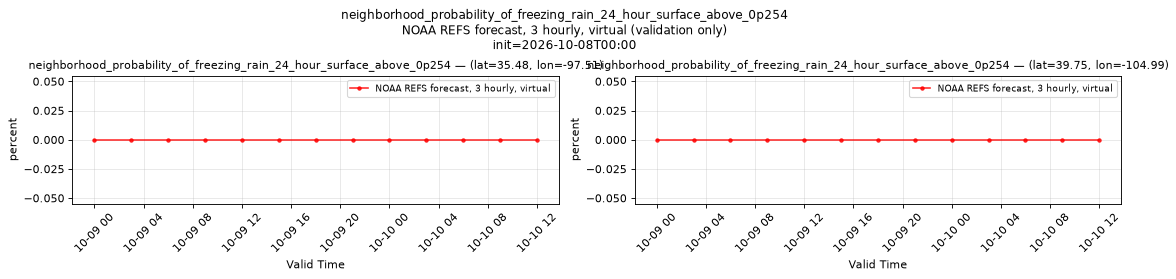
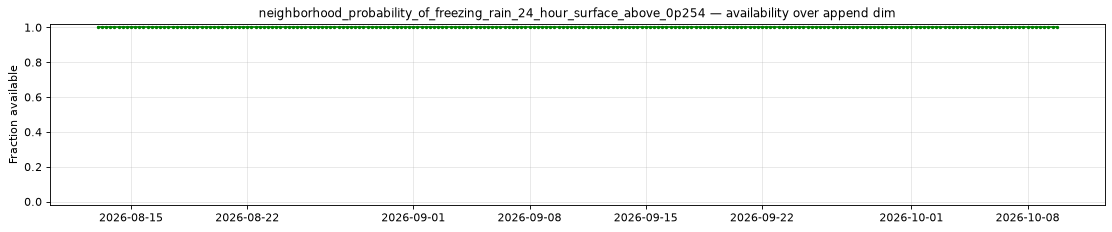
neighborhood_probability_of_freezing_rain_24_hour_surface_above_12p7
Metadata
| Field | Value |
|---|---|
| units | percent |
| long_name | Neighborhood probability of 24 hour freezing rain (surface) above 12.7 kg m-2 |
| short_name | neighborhood_probability_of_freezing_rain_24_hour_surface_above_12p7 |
| standard_name | n/a |
| step_type | accum |
| comment | Threshold applies to the preceding 24 hours of accumulation. Published every 3 forecast hours from lead 24 hours. Neighborhood probability of 24 hour freezing rain (surface) above 12.7 kg m-2. |
Point time series — 2026-08-13T00:00 - 2026-10-12T18:00, sampled lead=24h
| Point | min | mean | max |
|---|---|---|---|
| P1 | 0 | 0 | 0 |
| P2 | 0 | 0 | 0 |
Spatial — init=2026-10-11T06:00, lead=24h (reference not available)
| Source | min | mean | max |
|---|---|---|---|
| Validation | 0 | 0.01336 | 50 |
Temporal — init=2026-10-11T06:00
| Source | min | mean | max |
|---|---|---|---|
| P1 Validation | 0 | 0 | 0 |
| P2 Validation | 0 | 0 | 0 |
Availability — 244 of 244 positions complete

neighborhood_probability_of_freezing_rain_24_hour_surface_above_25p4
Metadata
| Field | Value |
|---|---|
| units | percent |
| long_name | Neighborhood probability of 24 hour freezing rain (surface) above 25.4 kg m-2 |
| short_name | neighborhood_probability_of_freezing_rain_24_hour_surface_above_25p4 |
| standard_name | n/a |
| step_type | accum |
| comment | Threshold applies to the preceding 24 hours of accumulation. Published every 3 forecast hours from lead 24 hours. Neighborhood probability of 24 hour freezing rain (surface) above 25.4 kg m-2. |
Point time series — 2026-08-13T00:00 - 2026-10-12T18:00, sampled lead=24h
| Point | min | mean | max |
|---|---|---|---|
| P1 | 0 | 0 | 0 |
| P2 | 0 | 0 | 0 |
Spatial — init=2026-10-11T06:00, lead=24h (reference not available)
| Source | min | mean | max |
|---|---|---|---|
| Validation | 0 | 0.001134 | 14.5 |
Temporal — init=2026-10-11T06:00
| Source | min | mean | max |
|---|---|---|---|
| P1 Validation | 0 | 0 | 0 |
| P2 Validation | 0 | 0 | 0 |
Availability — 244 of 244 positions complete

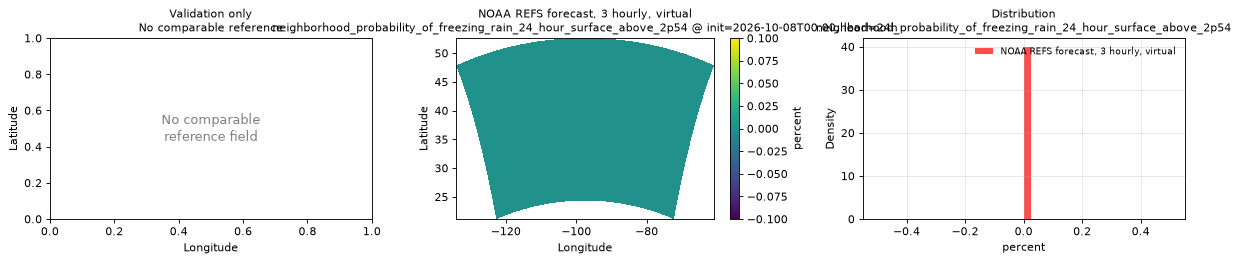
neighborhood_probability_of_freezing_rain_24_hour_surface_above_2p54
Metadata
| Field | Value |
|---|---|
| units | percent |
| long_name | Neighborhood probability of 24 hour freezing rain (surface) above 2.54 kg m-2 |
| short_name | neighborhood_probability_of_freezing_rain_24_hour_surface_above_2p54 |
| standard_name | n/a |
| step_type | accum |
| comment | Threshold applies to the preceding 24 hours of accumulation. Published every 3 forecast hours from lead 24 hours. Neighborhood probability of 24 hour freezing rain (surface) above 2.54 kg m-2. |
Point time series — 2026-08-13T00:00 - 2026-10-12T18:00, sampled lead=24h
| Point | min | mean | max |
|---|---|---|---|
| P1 | 0 | 0 | 0 |
| P2 | 0 | 0 | 0 |
Spatial — init=2026-10-11T06:00, lead=24h (reference not available)
| Source | min | mean | max |
|---|---|---|---|
| Validation | 0 | 0.1984 | 100 |
Temporal — init=2026-10-11T06:00
| Source | min | mean | max |
|---|---|---|---|
| P1 Validation | 0 | 0 | 0 |
| P2 Validation | 0 | 0 | 0 |
Availability — 244 of 244 positions complete

neighborhood_probability_of_freezing_rain_24_hour_surface_above_6p35
Metadata
| Field | Value |
|---|---|
| units | percent |
| long_name | Neighborhood probability of 24 hour freezing rain (surface) above 6.35 kg m-2 |
| short_name | neighborhood_probability_of_freezing_rain_24_hour_surface_above_6p35 |
| standard_name | n/a |
| step_type | accum |
| comment | Threshold applies to the preceding 24 hours of accumulation. Published every 3 forecast hours from lead 24 hours. Neighborhood probability of 24 hour freezing rain (surface) above 6.35 kg m-2. |
Point time series — 2026-08-13T00:00 - 2026-10-12T18:00, sampled lead=24h
| Point | min | mean | max |
|---|---|---|---|
| P1 | 0 | 0 | 0 |
| P2 | 0 | 0 | 0 |
Spatial — init=2026-10-11T06:00, lead=24h (reference not available)
| Source | min | mean | max |
|---|---|---|---|
| Validation | 0 | 0.06373 | 100 |
Temporal — init=2026-10-11T06:00
| Source | min | mean | max |
|---|---|---|---|
| P1 Validation | 0 | 0 | 0 |
| P2 Validation | 0 | 0 | 0 |
Availability — 244 of 244 positions complete


neighborhood_probability_of_freezing_rain_3_hour_surface_above_0p254
Metadata
| Field | Value |
|---|---|
| units | percent |
| long_name | Neighborhood probability of 3 hour freezing rain (surface) above 0.254 kg m-2 |
| short_name | neighborhood_probability_of_freezing_rain_3_hour_surface_above_0p254 |
| standard_name | n/a |
| step_type | accum |
| comment | Threshold applies to the preceding 3 hours of accumulation. Published every 3 forecast hours from lead 3 hours. Neighborhood probability of 3 hour freezing rain (surface) above 0.254 kg m-2. |
Point time series — 2026-08-13T00:00 - 2026-10-12T18:00, sampled lead=3h
| Point | min | mean | max |
|---|---|---|---|
| P1 | 0 | 0 | 0 |
| P2 | 0 | 0 | 0 |
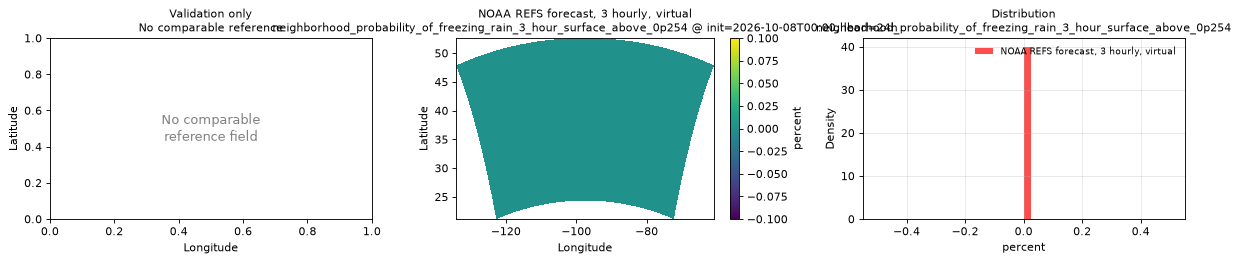
Spatial — init=2026-10-11T06:00, lead=24h (reference not available)
| Source | min | mean | max |
|---|---|---|---|
| Validation | 0 | 0.3142 | 100 |
Temporal — init=2026-10-11T06:00
| Source | min | mean | max |
|---|---|---|---|
| P1 Validation | 0 | 0 | 0 |
| P2 Validation | 0 | 0.625 | 12 |
Availability — 244 of 244 positions complete


neighborhood_probability_of_freezing_rain_3_hour_surface_above_2p54
Metadata
| Field | Value |
|---|---|
| units | percent |
| long_name | Neighborhood probability of 3 hour freezing rain (surface) above 2.54 kg m-2 |
| short_name | neighborhood_probability_of_freezing_rain_3_hour_surface_above_2p54 |
| standard_name | n/a |
| step_type | accum |
| comment | Threshold applies to the preceding 3 hours of accumulation. Published every 3 forecast hours from lead 3 hours. Neighborhood probability of 3 hour freezing rain (surface) above 2.54 kg m-2. |
Point time series — 2026-08-13T00:00 - 2026-10-12T18:00, sampled lead=3h
| Point | min | mean | max |
|---|---|---|---|
| P1 | 0 | 0 | 0 |
| P2 | 0 | 0 | 0 |
Spatial — init=2026-10-11T06:00, lead=24h (reference not available)
| Source | min | mean | max |
|---|---|---|---|
| Validation | 0 | 0.04241 | 70.5 |
Temporal — init=2026-10-11T06:00
| Source | min | mean | max |
|---|---|---|---|
| P1 Validation | 0 | 0 | 0 |
| P2 Validation | 0 | 0 | 0 |
Availability — 244 of 244 positions complete
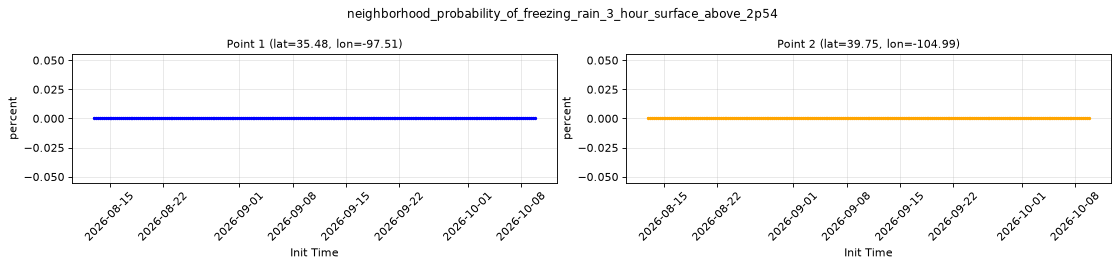
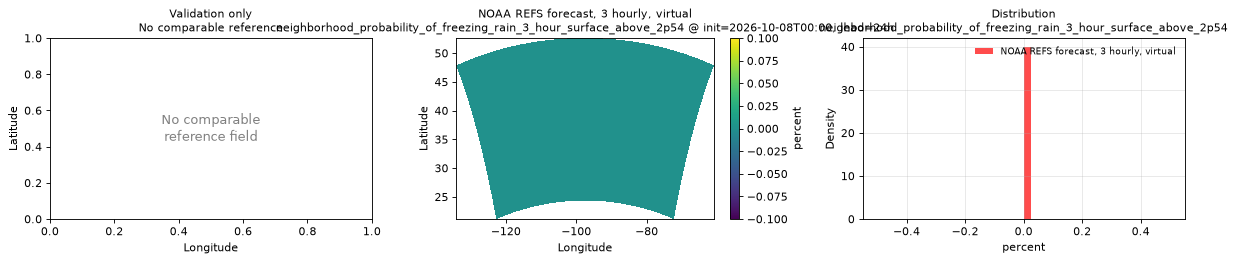
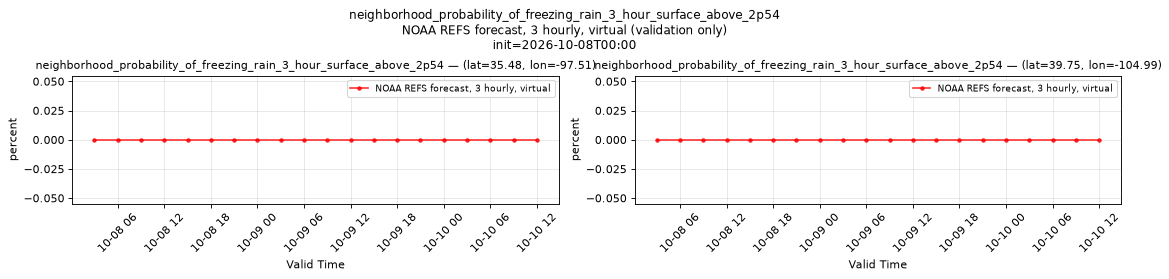
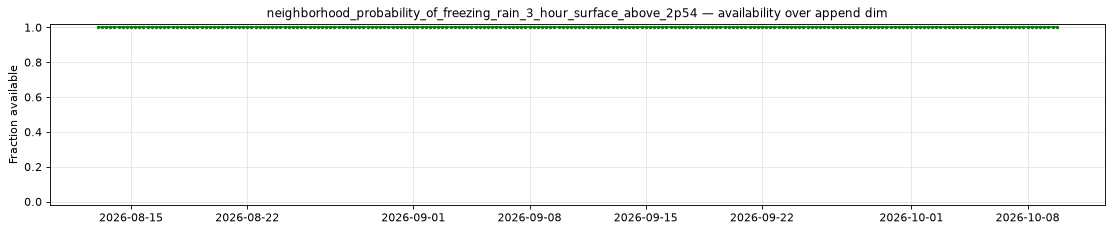
neighborhood_probability_of_freezing_rain_3_hour_surface_above_6p35
Metadata
| Field | Value |
|---|---|
| units | percent |
| long_name | Neighborhood probability of 3 hour freezing rain (surface) above 6.35 kg m-2 |
| short_name | neighborhood_probability_of_freezing_rain_3_hour_surface_above_6p35 |
| standard_name | n/a |
| step_type | accum |
| comment | Threshold applies to the preceding 3 hours of accumulation. Published every 3 forecast hours from lead 3 hours. Neighborhood probability of 3 hour freezing rain (surface) above 6.35 kg m-2. |
Point time series — 2026-08-13T00:00 - 2026-10-12T18:00, sampled lead=3h
| Point | min | mean | max |
|---|---|---|---|
| P1 | 0 | 0 | 0 |
| P2 | 0 | 0 | 0 |
Spatial — init=2026-10-11T06:00, lead=24h (reference not available)
| Source | min | mean | max |
|---|---|---|---|
| Validation | 0 | 0.005172 | 20 |
Temporal — init=2026-10-11T06:00
| Source | min | mean | max |
|---|---|---|---|
| P1 Validation | 0 | 0 | 0 |
| P2 Validation | 0 | 0 | 0 |
Availability — 244 of 244 positions complete
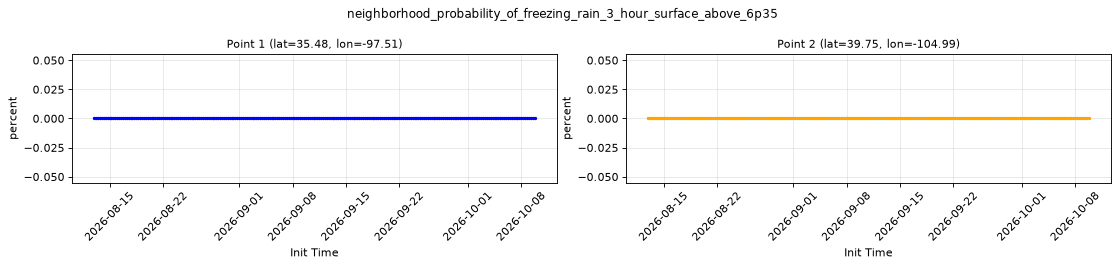
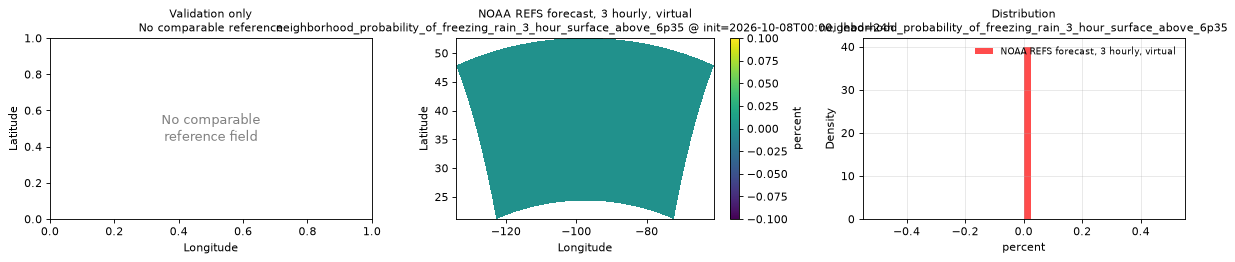
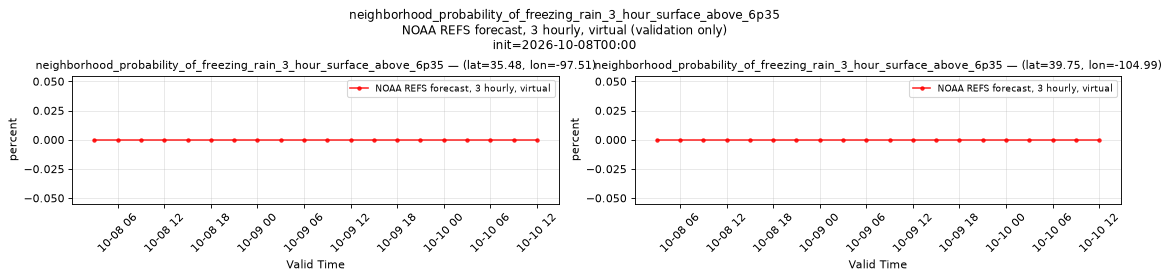
neighborhood_probability_of_freezing_rain_6_hour_surface_above_0p254
Metadata
| Field | Value |
|---|---|
| units | percent |
| long_name | Neighborhood probability of 6 hour freezing rain (surface) above 0.254 kg m-2 |
| short_name | neighborhood_probability_of_freezing_rain_6_hour_surface_above_0p254 |
| standard_name | n/a |
| step_type | accum |
| comment | Threshold applies to the preceding 6 hours of accumulation. Published every 3 forecast hours from lead 6 hours. Neighborhood probability of 6 hour freezing rain (surface) above 0.254 kg m-2. |
Point time series — 2026-08-13T00:00 - 2026-10-12T18:00, sampled lead=6h
| Point | min | mean | max |
|---|---|---|---|
| P1 | 0 | 0 | 0 |
| P2 | 0 | 0 | 0 |
Spatial — init=2026-10-11T06:00, lead=24h (reference not available)
| Source | min | mean | max |
|---|---|---|---|
| Validation | 0 | 0.424 | 100 |
Temporal — init=2026-10-11T06:00
| Source | min | mean | max |
|---|---|---|---|
| P1 Validation | 0 | 0 | 0 |
| P2 Validation | 0 | 0.6842 | 12 |
Availability — 244 of 244 positions complete
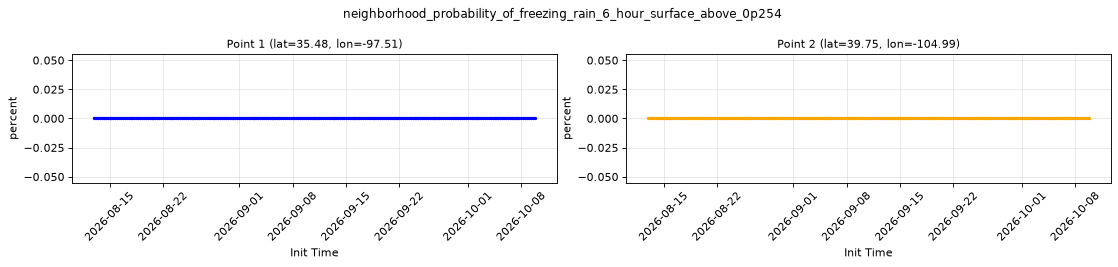

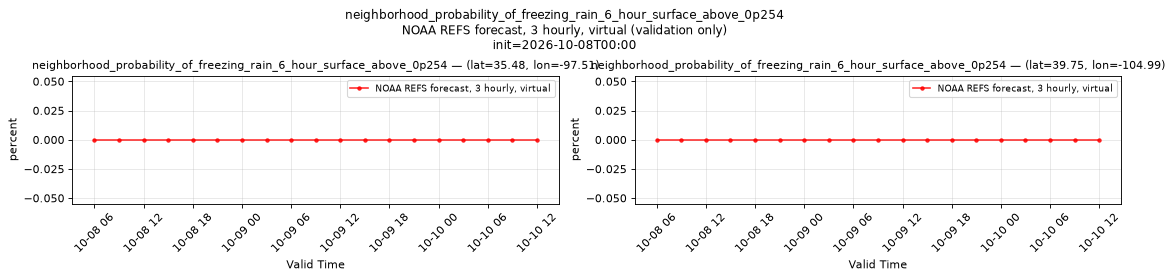
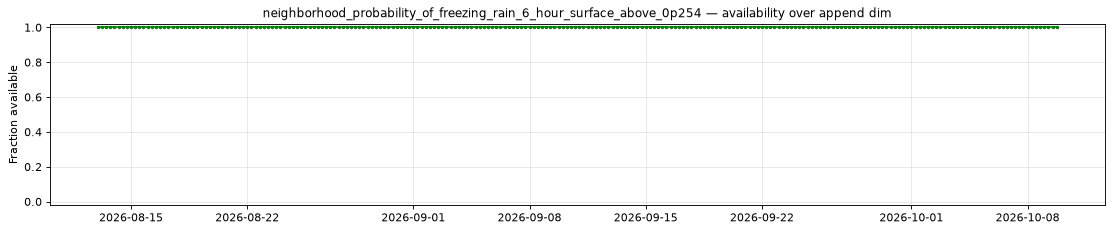
neighborhood_probability_of_freezing_rain_6_hour_surface_above_12p7
Metadata
| Field | Value |
|---|---|
| units | percent |
| long_name | Neighborhood probability of 6 hour freezing rain (surface) above 12.7 kg m-2 |
| short_name | neighborhood_probability_of_freezing_rain_6_hour_surface_above_12p7 |
| standard_name | n/a |
| step_type | accum |
| comment | Threshold applies to the preceding 6 hours of accumulation. Published every 3 forecast hours from lead 6 hours. Neighborhood probability of 6 hour freezing rain (surface) above 12.7 kg m-2. |
Point time series — 2026-08-13T00:00 - 2026-10-12T18:00, sampled lead=6h
| Point | min | mean | max |
|---|---|---|---|
| P1 | 0 | 0 | 0 |
| P2 | 0 | 0 | 0 |
Spatial — init=2026-10-11T06:00, lead=24h (reference not available)
| Source | min | mean | max |
|---|---|---|---|
| Validation | 0 | 0 | 0 |
Temporal — init=2026-10-11T06:00
| Source | min | mean | max |
|---|---|---|---|
| P1 Validation | 0 | 0 | 0 |
| P2 Validation | 0 | 0 | 0 |
Availability — 244 of 244 positions complete
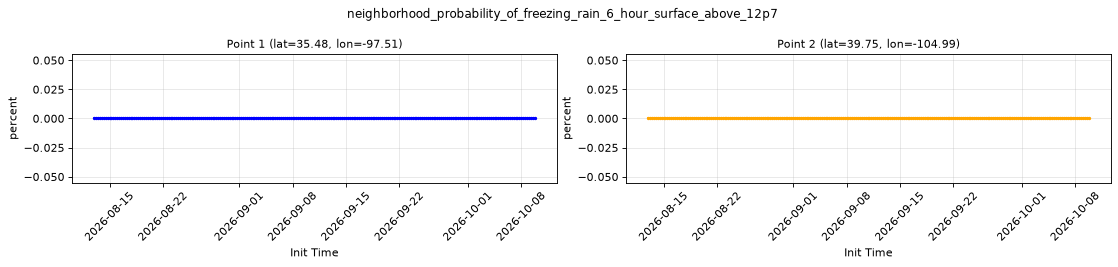
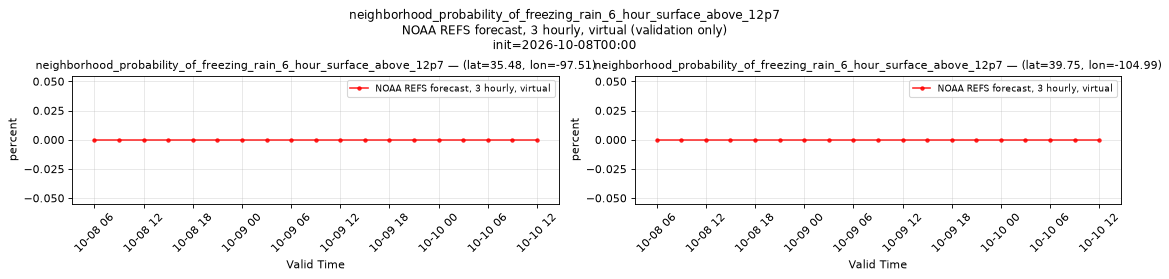

neighborhood_probability_of_freezing_rain_6_hour_surface_above_2p54
Metadata
| Field | Value |
|---|---|
| units | percent |
| long_name | Neighborhood probability of 6 hour freezing rain (surface) above 2.54 kg m-2 |
| short_name | neighborhood_probability_of_freezing_rain_6_hour_surface_above_2p54 |
| standard_name | n/a |
| step_type | accum |
| comment | Threshold applies to the preceding 6 hours of accumulation. Published every 3 forecast hours from lead 6 hours. Neighborhood probability of 6 hour freezing rain (surface) above 2.54 kg m-2. |
Point time series — 2026-08-13T00:00 - 2026-10-12T18:00, sampled lead=6h
| Point | min | mean | max |
|---|---|---|---|
| P1 | 0 | 0 | 0 |
| P2 | 0 | 0 | 0 |
Spatial — init=2026-10-11T06:00, lead=24h (reference not available)
| Source | min | mean | max |
|---|---|---|---|
| Validation | 0 | 0.06994 | 93 |
Temporal — init=2026-10-11T06:00
| Source | min | mean | max |
|---|---|---|---|
| P1 Validation | 0 | 0 | 0 |
| P2 Validation | 0 | 0 | 0 |
Availability — 244 of 244 positions complete
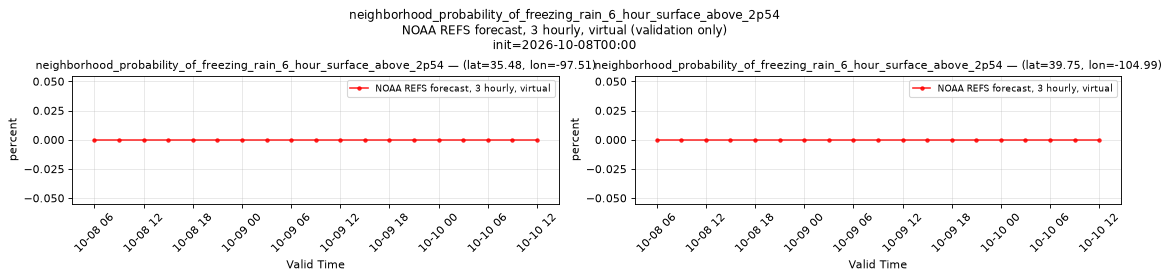
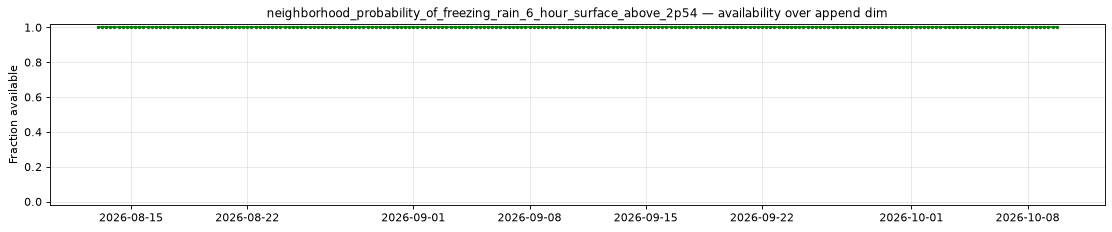
neighborhood_probability_of_freezing_rain_6_hour_surface_above_6p35
Metadata
| Field | Value |
|---|---|
| units | percent |
| long_name | Neighborhood probability of 6 hour freezing rain (surface) above 6.35 kg m-2 |
| short_name | neighborhood_probability_of_freezing_rain_6_hour_surface_above_6p35 |
| standard_name | n/a |
| step_type | accum |
| comment | Threshold applies to the preceding 6 hours of accumulation. Published every 3 forecast hours from lead 6 hours. Neighborhood probability of 6 hour freezing rain (surface) above 6.35 kg m-2. |
Point time series — 2026-08-13T00:00 - 2026-10-12T18:00, sampled lead=6h
| Point | min | mean | max |
|---|---|---|---|
| P1 | 0 | 0 | 0 |
| P2 | 0 | 0 | 0 |
Spatial — init=2026-10-11T06:00, lead=24h (reference not available)
| Source | min | mean | max |
|---|---|---|---|
| Validation | 0 | 0.01148 | 34.5 |
Temporal — init=2026-10-11T06:00
| Source | min | mean | max |
|---|---|---|---|
| P1 Validation | 0 | 0 | 0 |
| P2 Validation | 0 | 0 | 0 |
Availability — 244 of 244 positions complete
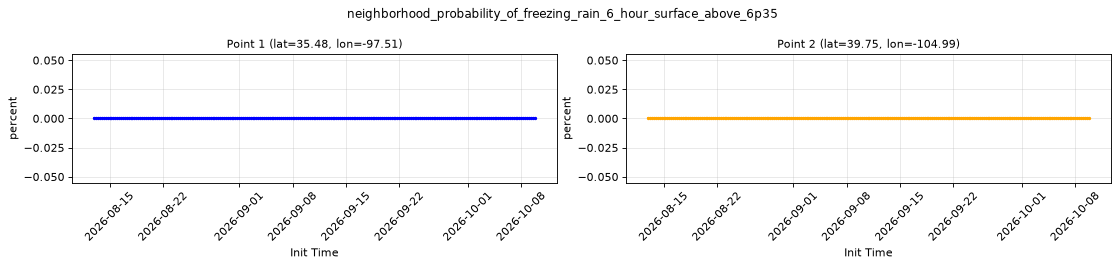
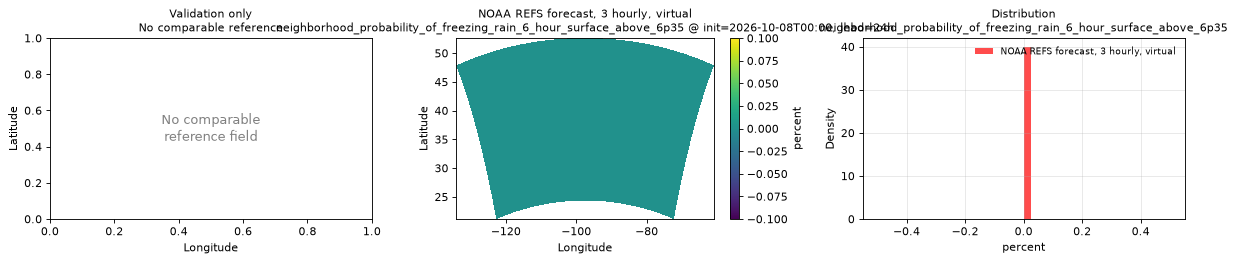

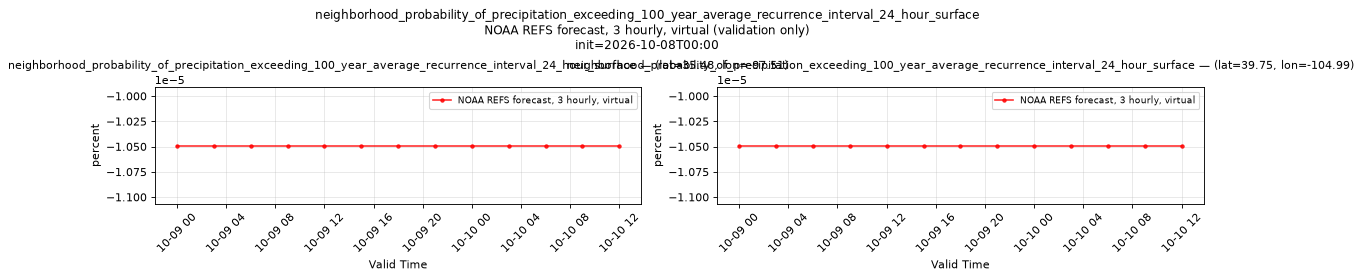
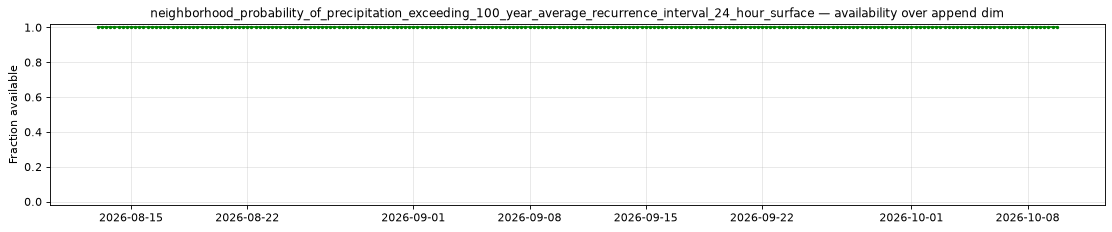
neighborhood_probability_of_precipitation_exceeding_100_year_average_recurrence_interval_24_hour_surface
Metadata
| Field | Value |
|---|---|
| units | percent |
| long_name | Neighborhood probability of 24 hour precipitation above the 100 year average recurrence interval depth |
| short_name | neighborhood_probability_of_precipitation_exceeding_100_year_average_recurrence_interval_24_hour_surface |
| standard_name | n/a |
| step_type | accum |
| comment | Threshold applies to the preceding 24 hours of accumulation. Published every 3 forecast hours from lead 24 hours. Neighborhood probability of 24 hour precipitation above the 100 year average recurrence interval depth. Probabilities compare precipitation with a spatially varying guidance or recurrence-interval depth. Negative values are unavailable thresholds blended into neighboring cells by smoothing; positive values near coverage boundaries can also be biased low. Mask values < -0.1. |
Point time series — 2026-08-13T00:00 - 2026-10-12T18:00, sampled lead=24h
| Point | min | mean | max |
|---|---|---|---|
| P1 | -1.049e-05 | -1.049e-05 | -1.049e-05 |
| P2 | -1.049e-05 | -1.049e-05 | -1.049e-05 |
Spatial — init=2026-10-11T06:00, lead=24h (reference not available)
| Source | min | mean | max |
|---|---|---|---|
| Validation | -10 | -4.868 | 95 |
Temporal — init=2026-10-11T06:00
| Source | min | mean | max |
|---|---|---|---|
| P1 Validation | -1.049e-05 | -1.049e-05 | -1.049e-05 |
| P2 Validation | -1.049e-05 | -1.049e-05 | -1.049e-05 |
Availability — 244 of 244 positions complete


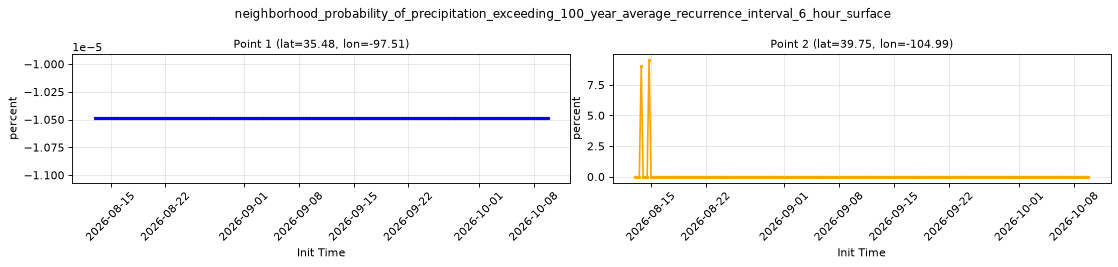
neighborhood_probability_of_precipitation_exceeding_100_year_average_recurrence_interval_6_hour_surface
Metadata
| Field | Value |
|---|---|
| units | percent |
| long_name | Neighborhood probability of 6 hour precipitation above the 100 year average recurrence interval depth |
| short_name | neighborhood_probability_of_precipitation_exceeding_100_year_average_recurrence_interval_6_hour_surface |
| standard_name | n/a |
| step_type | accum |
| comment | Threshold applies to the preceding 6 hours of accumulation. Published every 3 forecast hours from lead 6 hours. Neighborhood probability of 6 hour precipitation above the 100 year average recurrence interval depth. Probabilities compare precipitation with a spatially varying guidance or recurrence-interval depth. Negative values are unavailable thresholds blended into neighboring cells by smoothing; positive values near coverage boundaries can also be biased low. Mask values < -0.1. |
Point time series — 2026-08-13T00:00 - 2026-10-12T18:00, sampled lead=6h
| Point | min | mean | max |
|---|---|---|---|
| P1 | -1.049e-05 | -1.049e-05 | -1.049e-05 |
| P2 | -1.049e-05 | 0.04302 | 6 |
Spatial — init=2026-10-11T06:00, lead=24h (reference not available)
| Source | min | mean | max |
|---|---|---|---|
| Validation | -10 | -5.338 | 20.5 |
Temporal — init=2026-10-11T06:00
| Source | min | mean | max |
|---|---|---|---|
| P1 Validation | -1.049e-05 | -1.049e-05 | -1.049e-05 |
| P2 Validation | -1.049e-05 | -1.049e-05 | -1.049e-05 |
Availability — 244 of 244 positions complete


neighborhood_probability_of_precipitation_exceeding_10_year_average_recurrence_interval_24_hour_surface
Metadata
| Field | Value |
|---|---|
| units | percent |
| long_name | Neighborhood probability of 24 hour precipitation above the 10 year average recurrence interval depth |
| short_name | neighborhood_probability_of_precipitation_exceeding_10_year_average_recurrence_interval_24_hour_surface |
| standard_name | n/a |
| step_type | accum |
| comment | Threshold applies to the preceding 24 hours of accumulation. Published every 3 forecast hours from lead 24 hours. Neighborhood probability of 24 hour precipitation above the 10 year average recurrence interval depth. Probabilities compare precipitation with a spatially varying guidance or recurrence-interval depth. Negative values are unavailable thresholds blended into neighboring cells by smoothing; positive values near coverage boundaries can also be biased low. Mask values < -0.1. |
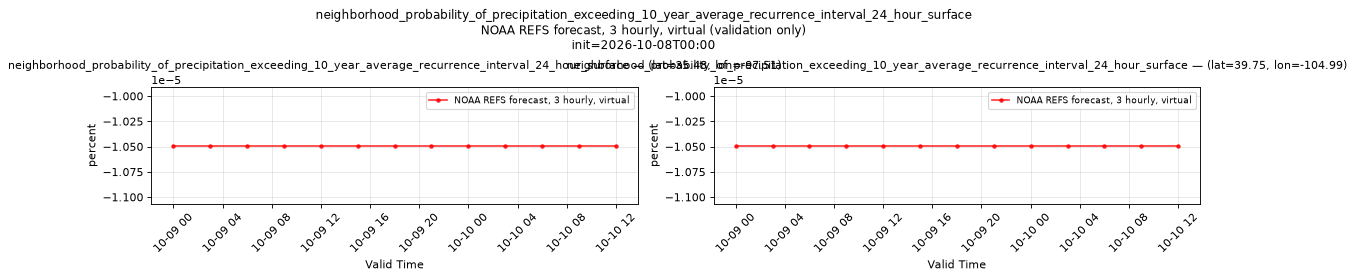
Point time series — 2026-08-13T00:00 - 2026-10-12T18:00, sampled lead=24h
| Point | min | mean | max |
|---|---|---|---|
| P1 | -1.049e-05 | 0.3524 | 27 |
| P2 | -1.049e-05 | 0.3422 | 11 |
Spatial — init=2026-10-11T06:00, lead=24h (reference not available)
| Source | min | mean | max |
|---|---|---|---|
| Validation | -10 | -3.542 | 100 |
Temporal — init=2026-10-11T06:00
| Source | min | mean | max |
|---|---|---|---|
| P1 Validation | -1.049e-05 | -1.049e-05 | -1.049e-05 |
| P2 Validation | -1.049e-05 | -1.049e-05 | -1.049e-05 |
Availability — 244 of 244 positions complete


neighborhood_probability_of_precipitation_exceeding_10_year_average_recurrence_interval_6_hour_surface
Metadata
| Field | Value |
|---|---|
| units | percent |
| long_name | Neighborhood probability of 6 hour precipitation above the 10 year average recurrence interval depth |
| short_name | neighborhood_probability_of_precipitation_exceeding_10_year_average_recurrence_interval_6_hour_surface |
| standard_name | n/a |
| step_type | accum |
| comment | Threshold applies to the preceding 6 hours of accumulation. Published every 3 forecast hours from lead 6 hours. Neighborhood probability of 6 hour precipitation above the 10 year average recurrence interval depth. Probabilities compare precipitation with a spatially varying guidance or recurrence-interval depth. Negative values are unavailable thresholds blended into neighboring cells by smoothing; positive values near coverage boundaries can also be biased low. Mask values < -0.1. |
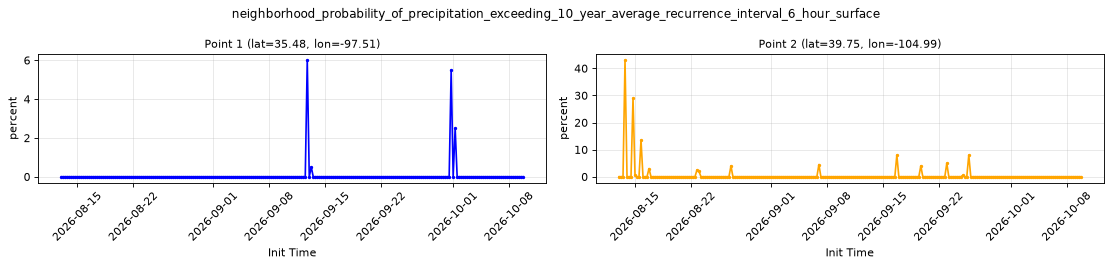
Point time series — 2026-08-13T00:00 - 2026-10-12T18:00, sampled lead=6h
| Point | min | mean | max |
|---|---|---|---|
| P1 | -1.049e-05 | 0.1947 | 13.5 |
| P2 | -1.049e-05 | 0.5205 | 42.5 |
Spatial — init=2026-10-11T06:00, lead=24h (reference not available)
| Source | min | mean | max |
|---|---|---|---|
| Validation | -10 | -5.136 | 60 |
Temporal — init=2026-10-11T06:00
| Source | min | mean | max |
|---|---|---|---|
| P1 Validation | -1.049e-05 | -1.049e-05 | -1.049e-05 |
| P2 Validation | -1.049e-05 | -1.049e-05 | -1.049e-05 |
Availability — 244 of 244 positions complete


neighborhood_probability_of_precipitation_exceeding_1_year_average_recurrence_interval_24_hour_surface
Metadata
| Field | Value |
|---|---|
| units | percent |
| long_name | Neighborhood probability of 24 hour precipitation above the 1 year average recurrence interval depth |
| short_name | neighborhood_probability_of_precipitation_exceeding_1_year_average_recurrence_interval_24_hour_surface |
| standard_name | n/a |
| step_type | accum |
| comment | Threshold applies to the preceding 24 hours of accumulation. Published every 3 forecast hours from lead 24 hours. Neighborhood probability of 24 hour precipitation above the 1 year average recurrence interval depth. Probabilities compare precipitation with a spatially varying guidance or recurrence-interval depth. Negative values are unavailable thresholds blended into neighboring cells by smoothing; positive values near coverage boundaries can also be biased low. Mask values < -0.1. |
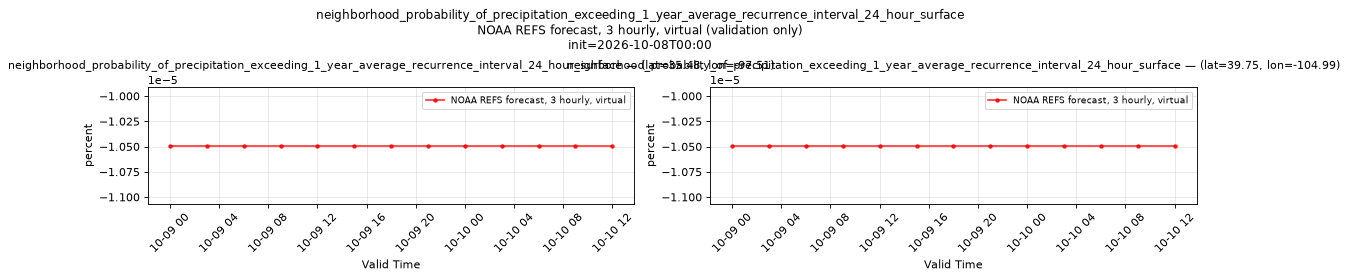
Point time series — 2026-08-13T00:00 - 2026-10-12T18:00, sampled lead=24h
| Point | min | mean | max |
|---|---|---|---|
| P1 | -1.049e-05 | 3.488 | 64 |
| P2 | -1.049e-05 | 4.086 | 82 |
Spatial — init=2026-10-11T06:00, lead=24h (reference not available)
| Source | min | mean | max |
|---|---|---|---|
| Validation | -10 | 0.3856 | 100 |
Temporal — init=2026-10-11T06:00
| Source | min | mean | max |
|---|---|---|---|
| P1 Validation | -1.049e-05 | -1.049e-05 | -1.049e-05 |
| P2 Validation | -1.049e-05 | -1.049e-05 | -1.049e-05 |
Availability — 244 of 244 positions complete


neighborhood_probability_of_precipitation_exceeding_1_year_average_recurrence_interval_6_hour_surface
Metadata
| Field | Value |
|---|---|
| units | percent |
| long_name | Neighborhood probability of 6 hour precipitation above the 1 year average recurrence interval depth |
| short_name | neighborhood_probability_of_precipitation_exceeding_1_year_average_recurrence_interval_6_hour_surface |
| standard_name | n/a |
| step_type | accum |
| comment | Threshold applies to the preceding 6 hours of accumulation. Published every 3 forecast hours from lead 6 hours. Neighborhood probability of 6 hour precipitation above the 1 year average recurrence interval depth. Probabilities compare precipitation with a spatially varying guidance or recurrence-interval depth. Negative values are unavailable thresholds blended into neighboring cells by smoothing; positive values near coverage boundaries can also be biased low. Mask values < -0.1. |
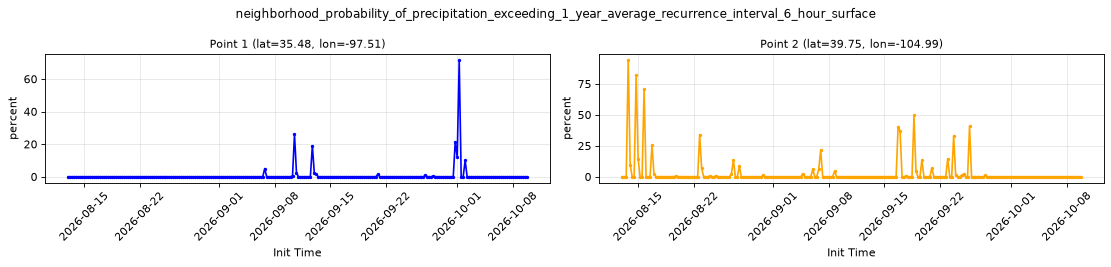
Point time series — 2026-08-13T00:00 - 2026-10-12T18:00, sampled lead=6h
| Point | min | mean | max |
|---|---|---|---|
| P1 | -1.049e-05 | 2.418 | 50 |
| P2 | -1.049e-05 | 2.369 | 81 |
Spatial — init=2026-10-11T06:00, lead=24h (reference not available)
| Source | min | mean | max |
|---|---|---|---|
| Validation | -10 | -3.958 | 98.5 |
Temporal — init=2026-10-11T06:00
| Source | min | mean | max |
|---|---|---|---|
| P1 Validation | -1.049e-05 | -1.049e-05 | -1.049e-05 |
| P2 Validation | -1.049e-05 | -1.049e-05 | -1.049e-05 |
Availability — 244 of 244 positions complete


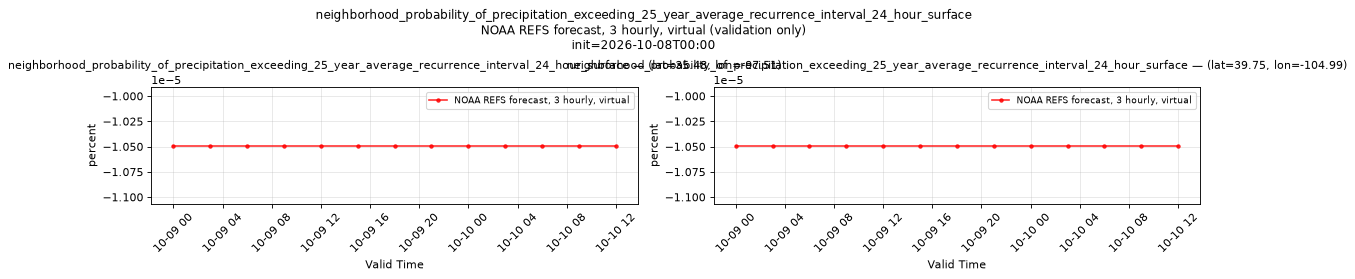
neighborhood_probability_of_precipitation_exceeding_25_year_average_recurrence_interval_24_hour_surface
Metadata
| Field | Value |
|---|---|
| units | percent |
| long_name | Neighborhood probability of 24 hour precipitation above the 25 year average recurrence interval depth |
| short_name | neighborhood_probability_of_precipitation_exceeding_25_year_average_recurrence_interval_24_hour_surface |
| standard_name | n/a |
| step_type | accum |
| comment | Threshold applies to the preceding 24 hours of accumulation. Published every 3 forecast hours from lead 24 hours. Neighborhood probability of 24 hour precipitation above the 25 year average recurrence interval depth. Probabilities compare precipitation with a spatially varying guidance or recurrence-interval depth. Negative values are unavailable thresholds blended into neighboring cells by smoothing; positive values near coverage boundaries can also be biased low. Mask values < -0.1. |
Point time series — 2026-08-13T00:00 - 2026-10-12T18:00, sampled lead=24h
| Point | min | mean | max |
|---|---|---|---|
| P1 | -1.049e-05 | 0.08196 | 7.5 |
| P2 | -1.049e-05 | 0.06146 | 4 |
Spatial — init=2026-10-11T06:00, lead=24h (reference not available)
| Source | min | mean | max |
|---|---|---|---|
| Validation | -10 | -4.276 | 100 |
Temporal — init=2026-10-11T06:00
| Source | min | mean | max |
|---|---|---|---|
| P1 Validation | -1.049e-05 | -1.049e-05 | -1.049e-05 |
| P2 Validation | -1.049e-05 | -1.049e-05 | -1.049e-05 |
Availability — 244 of 244 positions complete


neighborhood_probability_of_precipitation_exceeding_25_year_average_recurrence_interval_6_hour_surface
Metadata
| Field | Value |
|---|---|
| units | percent |
| long_name | Neighborhood probability of 6 hour precipitation above the 25 year average recurrence interval depth |
| short_name | neighborhood_probability_of_precipitation_exceeding_25_year_average_recurrence_interval_6_hour_surface |
| standard_name | n/a |
| step_type | accum |
| comment | Threshold applies to the preceding 6 hours of accumulation. Published every 3 forecast hours from lead 6 hours. Neighborhood probability of 6 hour precipitation above the 25 year average recurrence interval depth. Probabilities compare precipitation with a spatially varying guidance or recurrence-interval depth. Negative values are unavailable thresholds blended into neighboring cells by smoothing; positive values near coverage boundaries can also be biased low. Mask values < -0.1. |
Point time series — 2026-08-13T00:00 - 2026-10-12T18:00, sampled lead=6h
| Point | min | mean | max |
|---|---|---|---|
| P1 | -1.049e-05 | 0.06966 | 7 |
| P2 | -1.049e-05 | 0.2254 | 24 |
Spatial — init=2026-10-11T06:00, lead=24h (reference not available)
| Source | min | mean | max |
|---|---|---|---|
| Validation | -10 | -5.268 | 38.5 |
Temporal — init=2026-10-11T06:00
| Source | min | mean | max |
|---|---|---|---|
| P1 Validation | -1.049e-05 | -1.049e-05 | -1.049e-05 |
| P2 Validation | -1.049e-05 | -1.049e-05 | -1.049e-05 |
Availability — 244 of 244 positions complete



neighborhood_probability_of_precipitation_exceeding_2_year_average_recurrence_interval_24_hour_surface
Metadata
| Field | Value |
|---|---|
| units | percent |
| long_name | Neighborhood probability of 24 hour precipitation above the 2 year average recurrence interval depth |
| short_name | neighborhood_probability_of_precipitation_exceeding_2_year_average_recurrence_interval_24_hour_surface |
| standard_name | n/a |
| step_type | accum |
| comment | Threshold applies to the preceding 24 hours of accumulation. Published every 3 forecast hours from lead 24 hours. Neighborhood probability of 24 hour precipitation above the 2 year average recurrence interval depth. Probabilities compare precipitation with a spatially varying guidance or recurrence-interval depth. Negative values are unavailable thresholds blended into neighboring cells by smoothing; positive values near coverage boundaries can also be biased low. Mask values < -0.1. |
Point time series — 2026-08-13T00:00 - 2026-10-12T18:00, sampled lead=24h
| Point | min | mean | max |
|---|---|---|---|
| P1 | -1.049e-05 | 1.965 | 56.5 |
| P2 | -1.049e-05 | 2.398 | 64 |
Spatial — init=2026-10-11T06:00, lead=24h (reference not available)
| Source | min | mean | max |
|---|---|---|---|
| Validation | -10 | -1.222 | 100 |
Temporal — init=2026-10-11T06:00
| Source | min | mean | max |
|---|---|---|---|
| P1 Validation | -1.049e-05 | -1.049e-05 | -1.049e-05 |
| P2 Validation | -1.049e-05 | -1.049e-05 | -1.049e-05 |
Availability — 244 of 244 positions complete

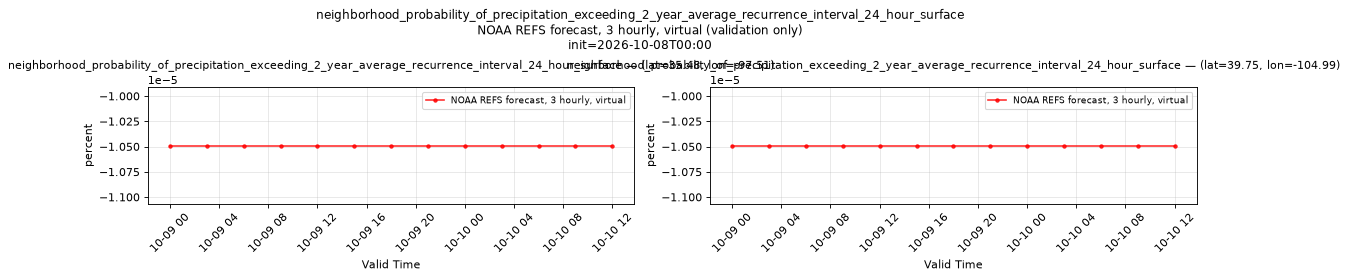
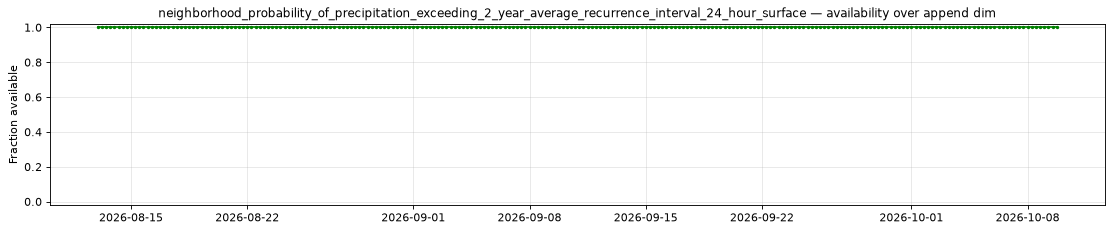
neighborhood_probability_of_precipitation_exceeding_2_year_average_recurrence_interval_6_hour_surface
Metadata
| Field | Value |
|---|---|
| units | percent |
| long_name | Neighborhood probability of 6 hour precipitation above the 2 year average recurrence interval depth |
| short_name | neighborhood_probability_of_precipitation_exceeding_2_year_average_recurrence_interval_6_hour_surface |
| standard_name | n/a |
| step_type | accum |
| comment | Threshold applies to the preceding 6 hours of accumulation. Published every 3 forecast hours from lead 6 hours. Neighborhood probability of 6 hour precipitation above the 2 year average recurrence interval depth. Probabilities compare precipitation with a spatially varying guidance or recurrence-interval depth. Negative values are unavailable thresholds blended into neighboring cells by smoothing; positive values near coverage boundaries can also be biased low. Mask values < -0.1. |
Point time series — 2026-08-13T00:00 - 2026-10-12T18:00, sampled lead=6h
| Point | min | mean | max |
|---|---|---|---|
| P1 | -1.049e-05 | 1.488 | 41 |
| P2 | -1.049e-05 | 1.654 | 73.5 |
Spatial — init=2026-10-11T06:00, lead=24h (reference not available)
| Source | min | mean | max |
|---|---|---|---|
| Validation | -10 | -4.545 | 92.5 |
Temporal — init=2026-10-11T06:00
| Source | min | mean | max |
|---|---|---|---|
| P1 Validation | -1.049e-05 | -1.049e-05 | -1.049e-05 |
| P2 Validation | -1.049e-05 | -1.049e-05 | -1.049e-05 |
Availability — 244 of 244 positions complete
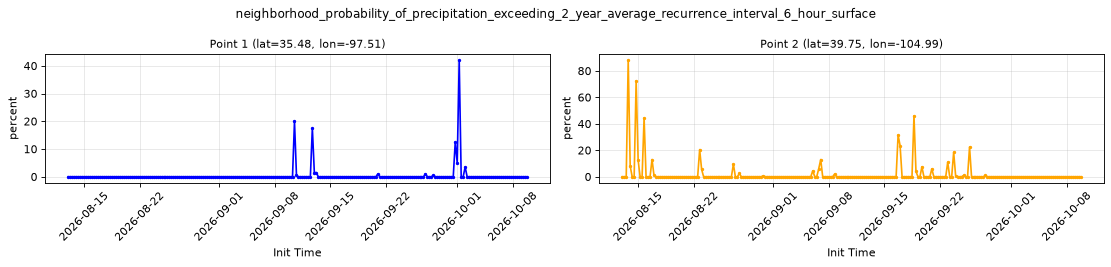

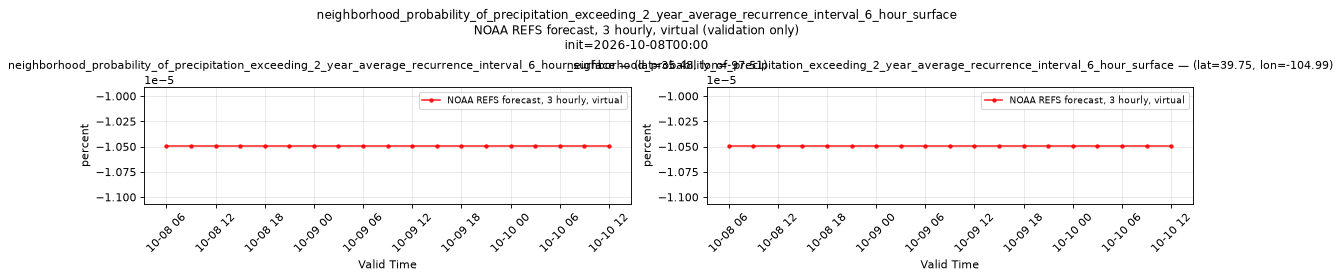
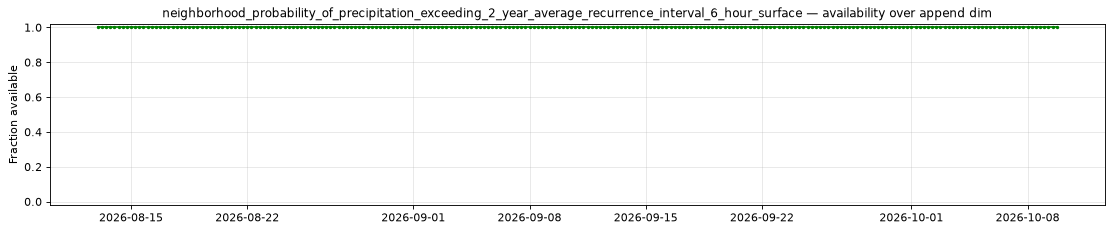
neighborhood_probability_of_precipitation_exceeding_3_hour_flash_flood_guidance_3_hour_surface
Metadata
| Field | Value |
|---|---|
| units | percent |
| long_name | Neighborhood probability of 3 hour precipitation above the 3 hour flash flood guidance depth |
| short_name | neighborhood_probability_of_precipitation_exceeding_3_hour_flash_flood_guidance_3_hour_surface |
| standard_name | n/a |
| step_type | accum |
| comment | Threshold applies to the preceding 3 hours of accumulation. Published every 3 forecast hours from lead 3 hours. Neighborhood probability of 3 hour precipitation above the 3 hour flash flood guidance depth. Probabilities compare precipitation with a spatially varying guidance or recurrence-interval depth. Negative values are unavailable thresholds blended into neighboring cells by smoothing; positive values near coverage boundaries can also be biased low. Mask values < -0.1. |
Point time series — 2026-08-13T00:00 - 2026-10-12T18:00, sampled lead=3h
| Point | min | mean | max |
|---|---|---|---|
| P1 | -10 | -1.111 | 31 |
| P2 | -4 | 0.08606 | 7 |
Spatial — init=2026-10-11T06:00, lead=24h (reference not available)
| Source | min | mean | max |
|---|---|---|---|
| Validation | -10 | -5.393 | 20 |
Temporal — init=2026-10-11T06:00
| Source | min | mean | max |
|---|---|---|---|
| P1 Validation | -2 | -2 | -2 |
| P2 Validation | -1.049e-05 | -1.049e-05 | -1.049e-05 |
Availability — 244 of 244 positions complete
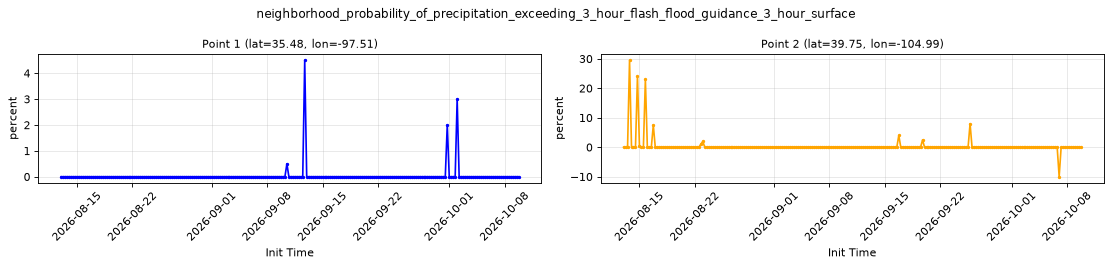
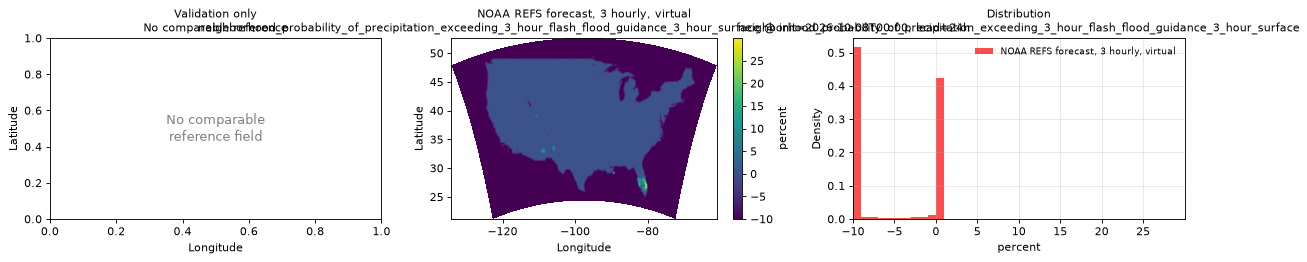
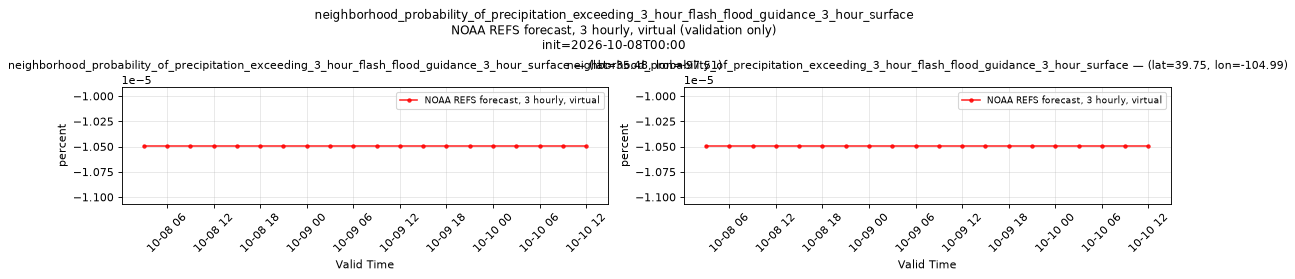
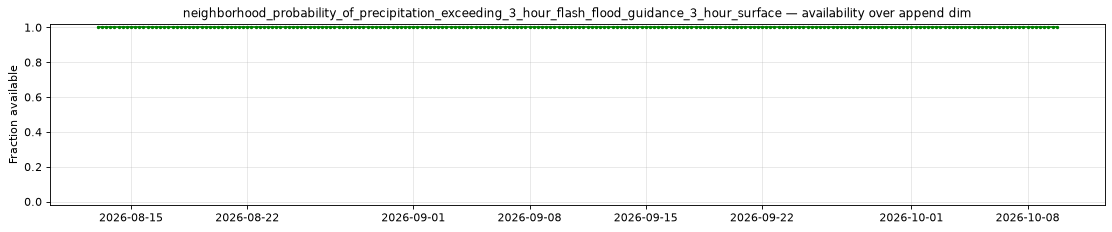
neighborhood_probability_of_precipitation_exceeding_50_year_average_recurrence_interval_24_hour_surface
Metadata
| Field | Value |
|---|---|
| units | percent |
| long_name | Neighborhood probability of 24 hour precipitation above the 50 year average recurrence interval depth |
| short_name | neighborhood_probability_of_precipitation_exceeding_50_year_average_recurrence_interval_24_hour_surface |
| standard_name | n/a |
| step_type | accum |
| comment | Threshold applies to the preceding 24 hours of accumulation. Published every 3 forecast hours from lead 24 hours. Neighborhood probability of 24 hour precipitation above the 50 year average recurrence interval depth. Probabilities compare precipitation with a spatially varying guidance or recurrence-interval depth. Negative values are unavailable thresholds blended into neighboring cells by smoothing; positive values near coverage boundaries can also be biased low. Mask values < -0.1. |
Point time series — 2026-08-13T00:00 - 2026-10-12T18:00, sampled lead=24h
| Point | min | mean | max |
|---|---|---|---|
| P1 | -1.049e-05 | 0.004088 | 1 |
| P2 | -1.049e-05 | 0.01024 | 1 |
Spatial — init=2026-10-11T06:00, lead=24h (reference not available)
| Source | min | mean | max |
|---|---|---|---|
| Validation | -10 | -4.631 | 99.5 |
Temporal — init=2026-10-11T06:00
| Source | min | mean | max |
|---|---|---|---|
| P1 Validation | -1.049e-05 | -1.049e-05 | -1.049e-05 |
| P2 Validation | -1.049e-05 | -1.049e-05 | -1.049e-05 |
Availability — 244 of 244 positions complete


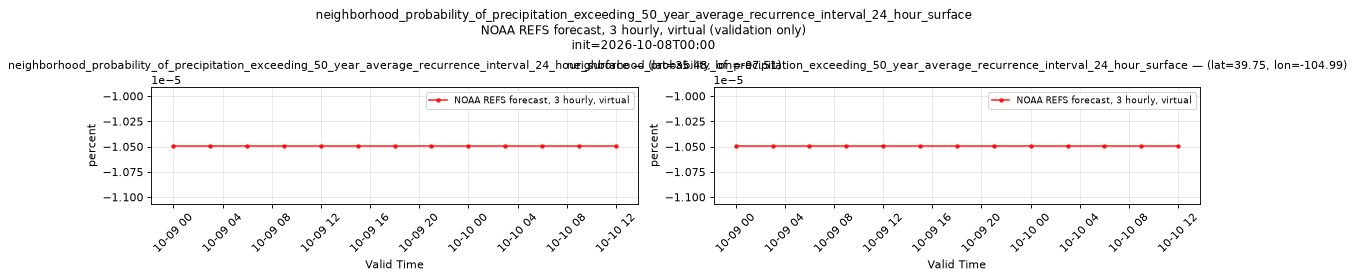
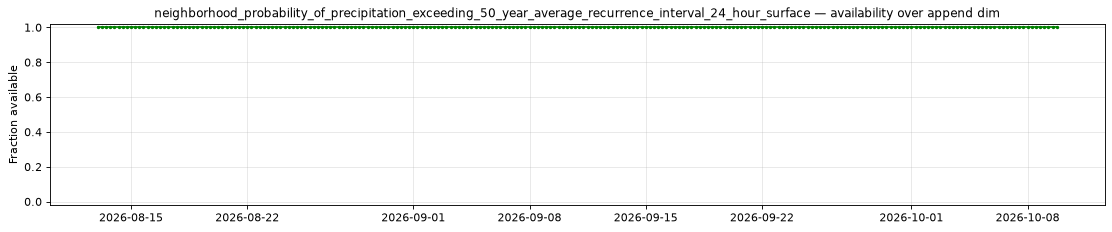
neighborhood_probability_of_precipitation_exceeding_50_year_average_recurrence_interval_6_hour_surface
Metadata
| Field | Value |
|---|---|
| units | percent |
| long_name | Neighborhood probability of 6 hour precipitation above the 50 year average recurrence interval depth |
| short_name | neighborhood_probability_of_precipitation_exceeding_50_year_average_recurrence_interval_6_hour_surface |
| standard_name | n/a |
| step_type | accum |
| comment | Threshold applies to the preceding 6 hours of accumulation. Published every 3 forecast hours from lead 6 hours. Neighborhood probability of 6 hour precipitation above the 50 year average recurrence interval depth. Probabilities compare precipitation with a spatially varying guidance or recurrence-interval depth. Negative values are unavailable thresholds blended into neighboring cells by smoothing; positive values near coverage boundaries can also be biased low. Mask values < -0.1. |
Point time series — 2026-08-13T00:00 - 2026-10-12T18:00, sampled lead=6h
| Point | min | mean | max |
|---|---|---|---|
| P1 | -1.049e-05 | -1.049e-05 | -1.049e-05 |
| P2 | -1.049e-05 | 0.127 | 13.5 |
Spatial — init=2026-10-11T06:00, lead=24h (reference not available)
| Source | min | mean | max |
|---|---|---|---|
| Validation | -10 | -5.314 | 26.5 |
Temporal — init=2026-10-11T06:00
| Source | min | mean | max |
|---|---|---|---|
| P1 Validation | -1.049e-05 | -1.049e-05 | -1.049e-05 |
| P2 Validation | -1.049e-05 | -1.049e-05 | -1.049e-05 |
Availability — 244 of 244 positions complete
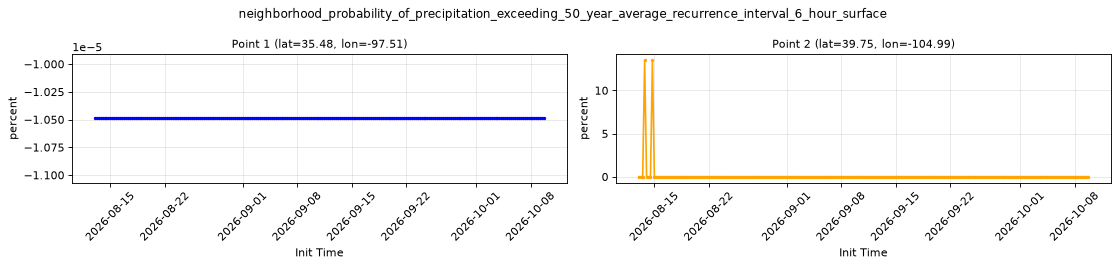


neighborhood_probability_of_precipitation_exceeding_5_year_average_recurrence_interval_24_hour_surface
Metadata
| Field | Value |
|---|---|
| units | percent |
| long_name | Neighborhood probability of 24 hour precipitation above the 5 year average recurrence interval depth |
| short_name | neighborhood_probability_of_precipitation_exceeding_5_year_average_recurrence_interval_24_hour_surface |
| standard_name | n/a |
| step_type | accum |
| comment | Threshold applies to the preceding 24 hours of accumulation. Published every 3 forecast hours from lead 24 hours. Neighborhood probability of 24 hour precipitation above the 5 year average recurrence interval depth. Probabilities compare precipitation with a spatially varying guidance or recurrence-interval depth. Negative values are unavailable thresholds blended into neighboring cells by smoothing; positive values near coverage boundaries can also be biased low. Mask values < -0.1. |
Point time series — 2026-08-13T00:00 - 2026-10-12T18:00, sampled lead=24h
| Point | min | mean | max |
|---|---|---|---|
| P1 | -1.049e-05 | 0.8033 | 40.5 |
| P2 | -1.049e-05 | 0.8914 | 29.5 |
Spatial — init=2026-10-11T06:00, lead=24h (reference not available)
| Source | min | mean | max |
|---|---|---|---|
| Validation | -10 | -2.728 | 100 |
Temporal — init=2026-10-11T06:00
| Source | min | mean | max |
|---|---|---|---|
| P1 Validation | -1.049e-05 | -1.049e-05 | -1.049e-05 |
| P2 Validation | -1.049e-05 | -1.049e-05 | -1.049e-05 |
Availability — 244 of 244 positions complete


neighborhood_probability_of_precipitation_exceeding_5_year_average_recurrence_interval_6_hour_surface
Metadata
| Field | Value |
|---|---|
| units | percent |
| long_name | Neighborhood probability of 6 hour precipitation above the 5 year average recurrence interval depth |
| short_name | neighborhood_probability_of_precipitation_exceeding_5_year_average_recurrence_interval_6_hour_surface |
| standard_name | n/a |
| step_type | accum |
| comment | Threshold applies to the preceding 6 hours of accumulation. Published every 3 forecast hours from lead 6 hours. Neighborhood probability of 6 hour precipitation above the 5 year average recurrence interval depth. Probabilities compare precipitation with a spatially varying guidance or recurrence-interval depth. Negative values are unavailable thresholds blended into neighboring cells by smoothing; positive values near coverage boundaries can also be biased low. Mask values < -0.1. |
Point time series — 2026-08-13T00:00 - 2026-10-12T18:00, sampled lead=6h
| Point | min | mean | max |
|---|---|---|---|
| P1 | -1.049e-05 | 0.6229 | 30.5 |
| P2 | -1.049e-05 | 0.8504 | 56 |
Spatial — init=2026-10-11T06:00, lead=24h (reference not available)
| Source | min | mean | max |
|---|---|---|---|
| Validation | -10 | -4.96 | 73 |
Temporal — init=2026-10-11T06:00
| Source | min | mean | max |
|---|---|---|---|
| P1 Validation | -1.049e-05 | -1.049e-05 | -1.049e-05 |
| P2 Validation | -1.049e-05 | -1.049e-05 | -1.049e-05 |
Availability — 244 of 244 positions complete
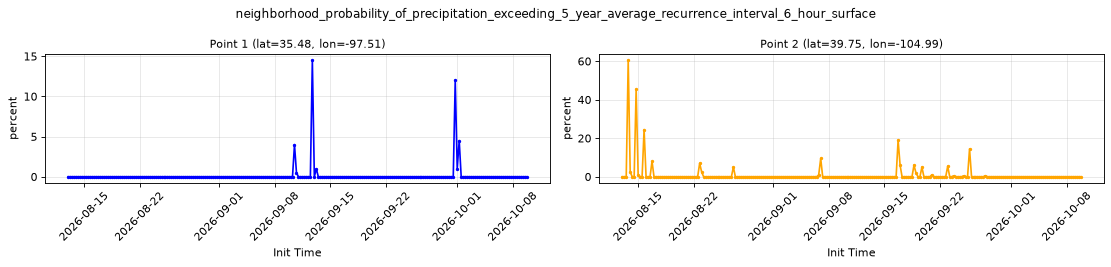

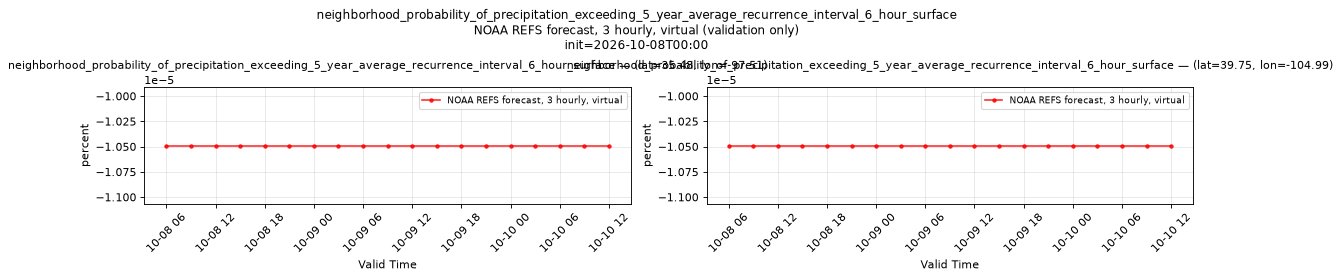
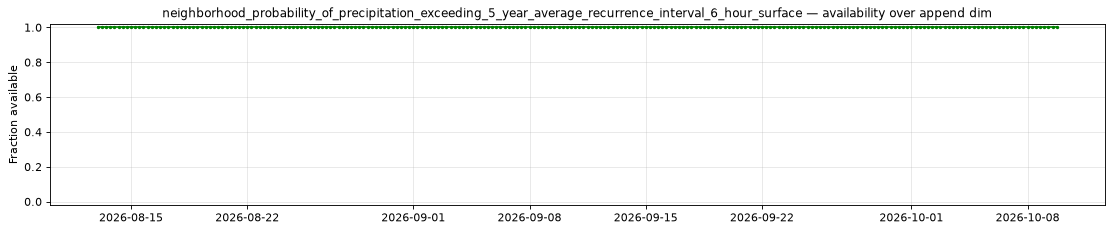
neighborhood_probability_of_precipitation_exceeding_6_hour_flash_flood_guidance_6_hour_surface
Metadata
| Field | Value |
|---|---|
| units | percent |
| long_name | Neighborhood probability of 6 hour precipitation above the 6 hour flash flood guidance depth |
| short_name | neighborhood_probability_of_precipitation_exceeding_6_hour_flash_flood_guidance_6_hour_surface |
| standard_name | n/a |
| step_type | accum |
| comment | Threshold applies to the preceding 6 hours of accumulation. Published every 3 forecast hours from lead 6 hours. Neighborhood probability of 6 hour precipitation above the 6 hour flash flood guidance depth. Probabilities compare precipitation with a spatially varying guidance or recurrence-interval depth. Negative values are unavailable thresholds blended into neighboring cells by smoothing; positive values near coverage boundaries can also be biased low. Mask values < -0.1. |
Point time series — 2026-08-13T00:00 - 2026-10-12T18:00, sampled lead=6h
| Point | min | mean | max |
|---|---|---|---|
| P1 | -10 | -1.346 | 29 |
| P2 | -4 | 0.1106 | 7 |
Spatial — init=2026-10-11T06:00, lead=24h (reference not available)
| Source | min | mean | max |
|---|---|---|---|
| Validation | -10 | -5.348 | 27.5 |
Temporal — init=2026-10-11T06:00
| Source | min | mean | max |
|---|---|---|---|
| P1 Validation | -2 | -2 | -2 |
| P2 Validation | -1.049e-05 | -1.049e-05 | -1.049e-05 |
Availability — 244 of 244 positions complete
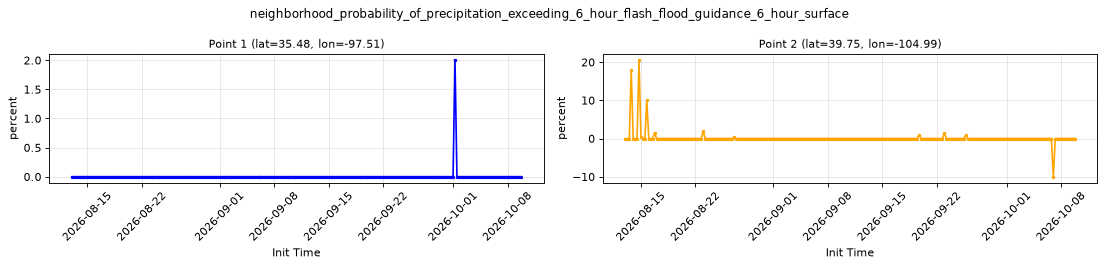
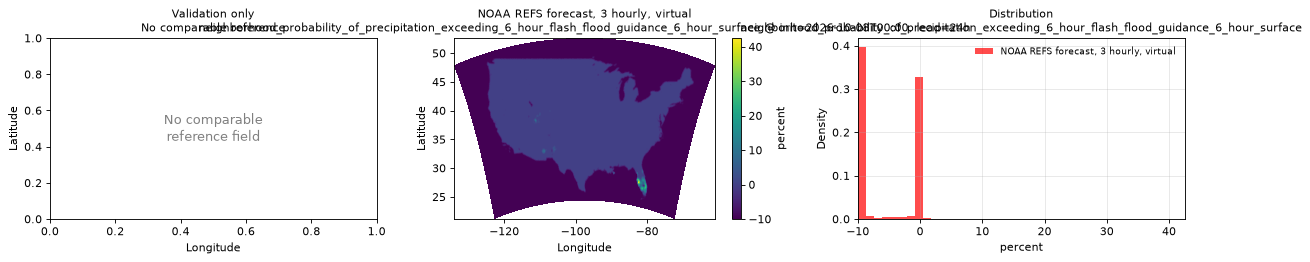
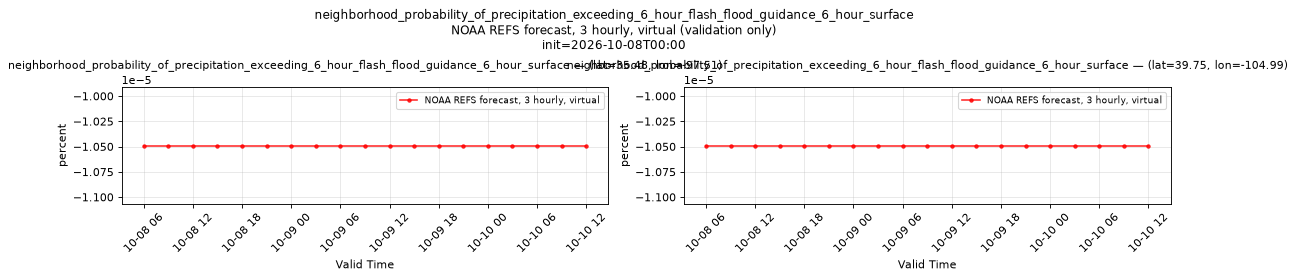
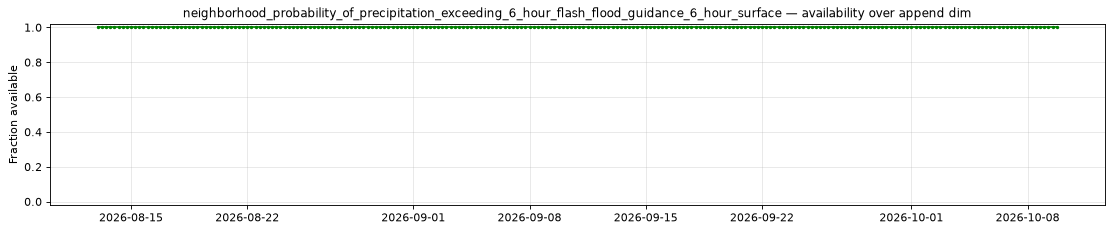
neighborhood_probability_of_total_precipitation_12_hour_surface_above_127
Metadata
| Field | Value |
|---|---|
| units | percent |
| long_name | Neighborhood probability of 12 hour total precipitation (surface) above 127 kg m-2 |
| short_name | neighborhood_probability_of_total_precipitation_12_hour_surface_above_127 |
| standard_name | n/a |
| step_type | accum |
| comment | Threshold applies to the preceding 12 hours of accumulation. Published every 3 forecast hours from lead 12 hours. Neighborhood probability of 12 hour total precipitation (surface) above 127 kg m-2. |
Point time series — 2026-08-13T00:00 - 2026-10-12T18:00, sampled lead=12h
| Point | min | mean | max |
|---|---|---|---|
| P1 | 0 | 1.314 | 31 |
| P2 | 0 | 0 | 0 |
Spatial — init=2026-10-11T06:00, lead=24h (reference not available)
| Source | min | mean | max |
|---|---|---|---|
| Validation | 0 | 0.1148 | 37 |
Temporal — init=2026-10-11T06:00
| Source | min | mean | max |
|---|---|---|---|
| P1 Validation | 0 | 0 | 0 |
| P2 Validation | 0 | 0 | 0 |
Availability — 244 of 244 positions complete

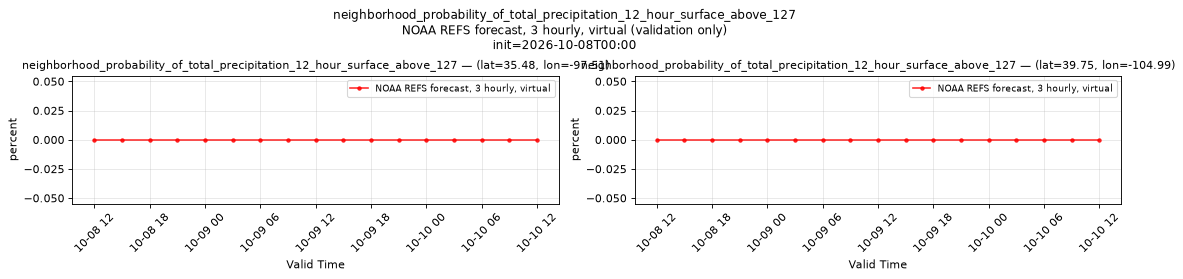
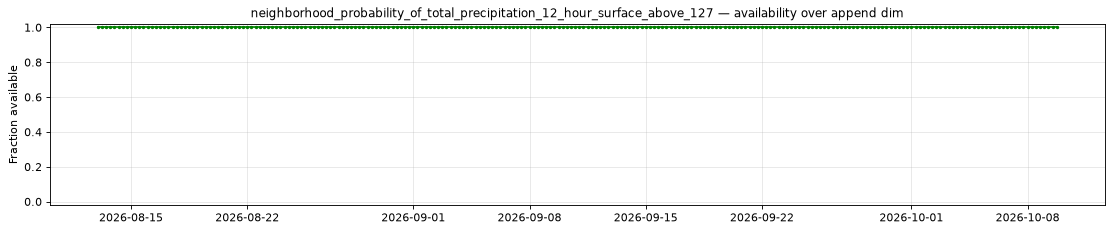
neighborhood_probability_of_total_precipitation_12_hour_surface_above_12p7
Metadata
| Field | Value |
|---|---|
| units | percent |
| long_name | Neighborhood probability of 12 hour total precipitation (surface) above 12.7 kg m-2 |
| short_name | neighborhood_probability_of_total_precipitation_12_hour_surface_above_12p7 |
| standard_name | n/a |
| step_type | accum |
| comment | Threshold applies to the preceding 12 hours of accumulation. Published every 3 forecast hours from lead 12 hours. Neighborhood probability of 12 hour total precipitation (surface) above 12.7 kg m-2. |
Point time series — 2026-08-13T00:00 - 2026-10-12T18:00, sampled lead=12h
| Point | min | mean | max |
|---|---|---|---|
| P1 | 0 | 32.66 | 100 |
| P2 | 0 | 14.84 | 100 |
Spatial — init=2026-10-11T06:00, lead=24h (reference not available)
| Source | min | mean | max |
|---|---|---|---|
| Validation | 0 | 17.9 | 100 |
Temporal — init=2026-10-11T06:00
| Source | min | mean | max |
|---|---|---|---|
| P1 Validation | 0 | 0 | 0 |
| P2 Validation | 0 | 1.706 | 11 |
Availability — 244 of 244 positions complete
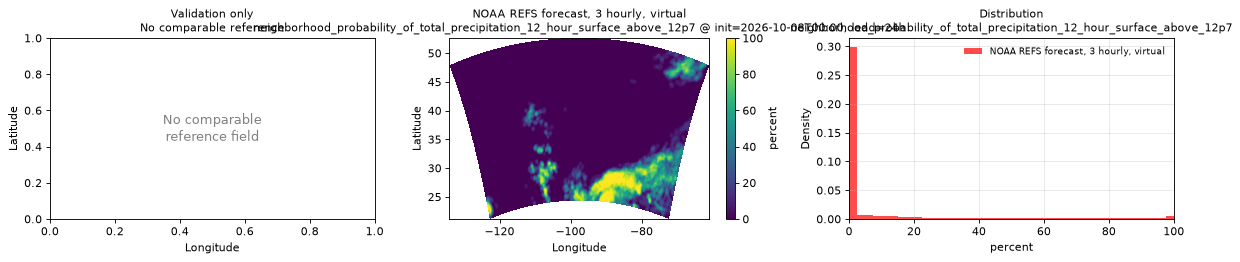
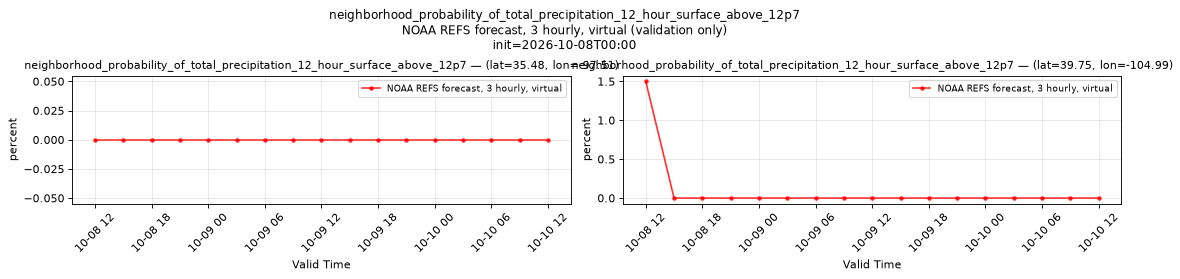
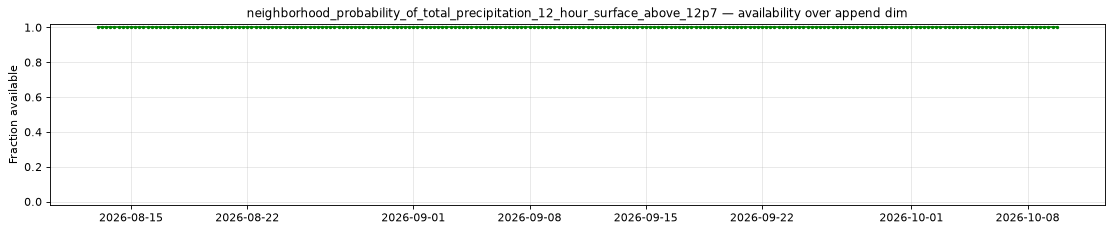
neighborhood_probability_of_total_precipitation_12_hour_surface_above_203p2
Metadata
| Field | Value |
|---|---|
| units | percent |
| long_name | Neighborhood probability of 12 hour total precipitation (surface) above 203.2 kg m-2 |
| short_name | neighborhood_probability_of_total_precipitation_12_hour_surface_above_203p2 |
| standard_name | n/a |
| step_type | accum |
| comment | Threshold applies to the preceding 12 hours of accumulation. Published every 3 forecast hours from lead 12 hours. Neighborhood probability of 12 hour total precipitation (surface) above 203.2 kg m-2. |
Point time series — 2026-08-13T00:00 - 2026-10-12T18:00, sampled lead=12h
| Point | min | mean | max |
|---|---|---|---|
| P1 | 0 | 0.1066 | 8.5 |
| P2 | 0 | 0 | 0 |
Spatial — init=2026-10-11T06:00, lead=24h (reference not available)
| Source | min | mean | max |
|---|---|---|---|
| Validation | 0 | 0.01201 | 14.5 |
Temporal — init=2026-10-11T06:00
| Source | min | mean | max |
|---|---|---|---|
| P1 Validation | 0 | 0 | 0 |
| P2 Validation | 0 | 0 | 0 |
Availability — 244 of 244 positions complete

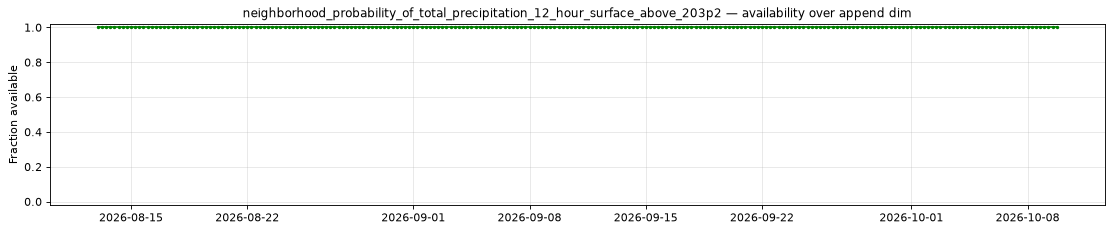
neighborhood_probability_of_total_precipitation_12_hour_surface_above_25p4
Metadata
| Field | Value |
|---|---|
| units | percent |
| long_name | Neighborhood probability of 12 hour total precipitation (surface) above 25.4 kg m-2 |
| short_name | neighborhood_probability_of_total_precipitation_12_hour_surface_above_25p4 |
| standard_name | n/a |
| step_type | accum |
| comment | Threshold applies to the preceding 12 hours of accumulation. Published every 3 forecast hours from lead 12 hours. Neighborhood probability of 12 hour total precipitation (surface) above 25.4 kg m-2. |
Point time series — 2026-08-13T00:00 - 2026-10-12T18:00, sampled lead=12h
| Point | min | mean | max |
|---|---|---|---|
| P1 | 0 | 25.96 | 100 |
| P2 | 0 | 3.152 | 92.5 |
Spatial — init=2026-10-11T06:00, lead=24h (reference not available)
| Source | min | mean | max |
|---|---|---|---|
| Validation | 0 | 9.186 | 100 |
Temporal — init=2026-10-11T06:00
| Source | min | mean | max |
|---|---|---|---|
| P1 Validation | 0 | 0 | 0 |
| P2 Validation | 0 | 0 | 0 |
Availability — 244 of 244 positions complete
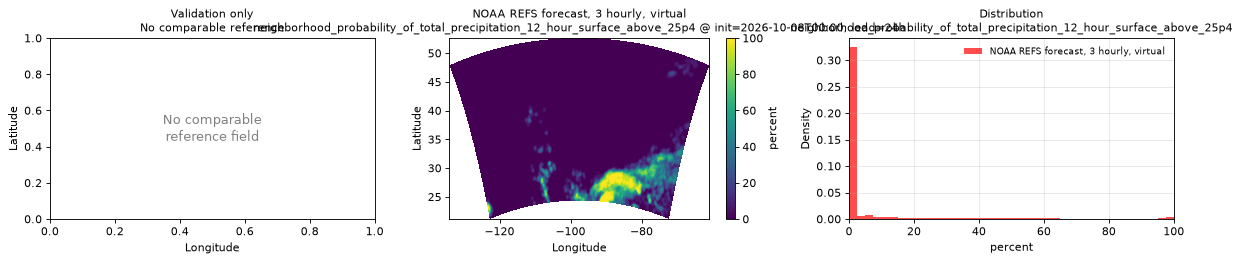
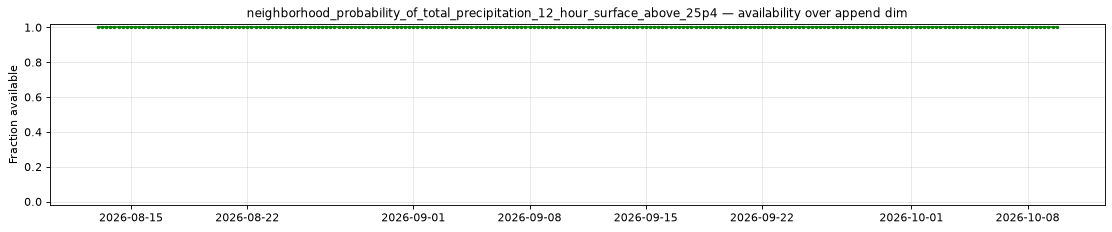
neighborhood_probability_of_total_precipitation_12_hour_surface_above_50p8
Metadata
| Field | Value |
|---|---|
| units | percent |
| long_name | Neighborhood probability of 12 hour total precipitation (surface) above 50.8 kg m-2 |
| short_name | neighborhood_probability_of_total_precipitation_12_hour_surface_above_50p8 |
| standard_name | n/a |
| step_type | accum |
| comment | Threshold applies to the preceding 12 hours of accumulation. Published every 3 forecast hours from lead 12 hours. Neighborhood probability of 12 hour total precipitation (surface) above 50.8 kg m-2. |
Point time series — 2026-08-13T00:00 - 2026-10-12T18:00, sampled lead=12h
| Point | min | mean | max |
|---|---|---|---|
| P1 | 0 | 15.35 | 100 |
| P2 | 0 | 0.293 | 22 |
Spatial — init=2026-10-11T06:00, lead=24h (reference not available)
| Source | min | mean | max |
|---|---|---|---|
| Validation | 0 | 2.747 | 100 |
Temporal — init=2026-10-11T06:00
| Source | min | mean | max |
|---|---|---|---|
| P1 Validation | 0 | 0 | 0 |
| P2 Validation | 0 | 0 | 0 |
Availability — 244 of 244 positions complete
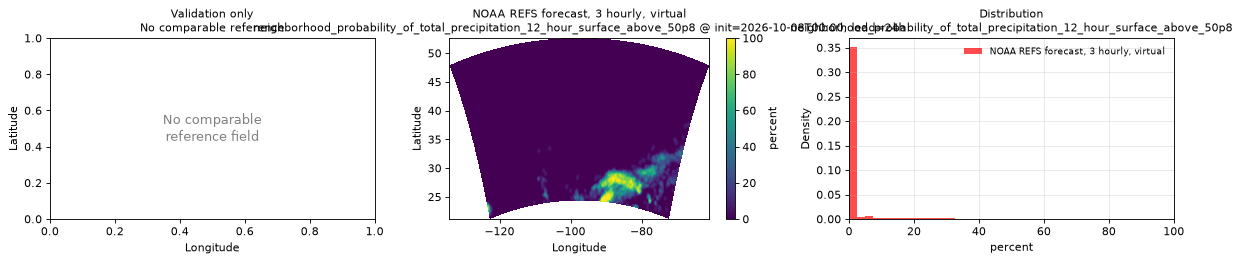
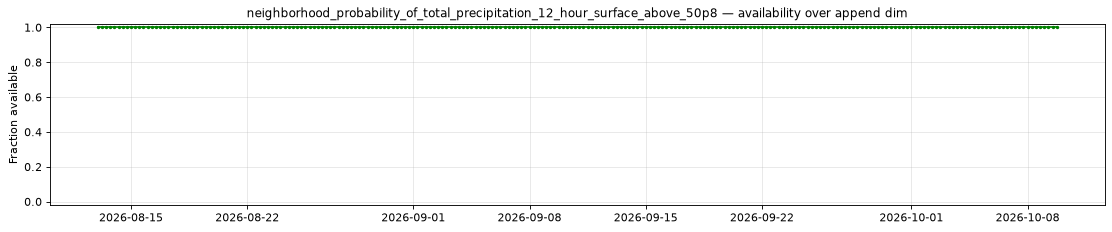
neighborhood_probability_of_total_precipitation_12_hour_surface_above_76p2
Metadata
| Field | Value |
|---|---|
| units | percent |
| long_name | Neighborhood probability of 12 hour total precipitation (surface) above 76.2 kg m-2 |
| short_name | neighborhood_probability_of_total_precipitation_12_hour_surface_above_76p2 |
| standard_name | n/a |
| step_type | accum |
| comment | Threshold applies to the preceding 12 hours of accumulation. Published every 3 forecast hours from lead 12 hours. Neighborhood probability of 12 hour total precipitation (surface) above 76.2 kg m-2. |
Point time series — 2026-08-13T00:00 - 2026-10-12T18:00, sampled lead=12h
| Point | min | mean | max |
|---|---|---|---|
| P1 | 0 | 7.316 | 89.5 |
| P2 | 0 | 0.002049 | 0.5 |
Spatial — init=2026-10-11T06:00, lead=24h (reference not available)
| Source | min | mean | max |
|---|---|---|---|
| Validation | 0 | 0.984 | 83 |
Temporal — init=2026-10-11T06:00
| Source | min | mean | max |
|---|---|---|---|
| P1 Validation | 0 | 0 | 0 |
| P2 Validation | 0 | 0 | 0 |
Availability — 244 of 244 positions complete
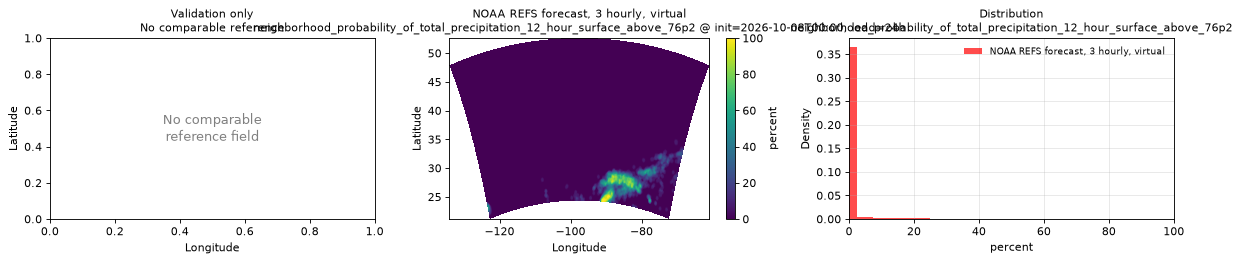

neighborhood_probability_of_total_precipitation_24_hour_surface_above_127
Metadata
| Field | Value |
|---|---|
| units | percent |
| long_name | Neighborhood probability of 24 hour total precipitation (surface) above 127 kg m-2 |
| short_name | neighborhood_probability_of_total_precipitation_24_hour_surface_above_127 |
| standard_name | n/a |
| step_type | accum |
| comment | Threshold applies to the preceding 24 hours of accumulation. Published every 3 forecast hours from lead 24 hours. Neighborhood probability of 24 hour total precipitation (surface) above 127 kg m-2. |
Point time series — 2026-08-13T00:00 - 2026-10-12T18:00, sampled lead=24h
| Point | min | mean | max |
|---|---|---|---|
| P1 | 0 | 3.383 | 63 |
| P2 | 0 | 0 | 0 |
Spatial — init=2026-10-11T06:00, lead=24h (reference not available)
| Source | min | mean | max |
|---|---|---|---|
| Validation | 0 | 0.7632 | 100 |
Temporal — init=2026-10-11T06:00
| Source | min | mean | max |
|---|---|---|---|
| P1 Validation | 0 | 0 | 0 |
| P2 Validation | 0 | 0 | 0 |
Availability — 244 of 244 positions complete

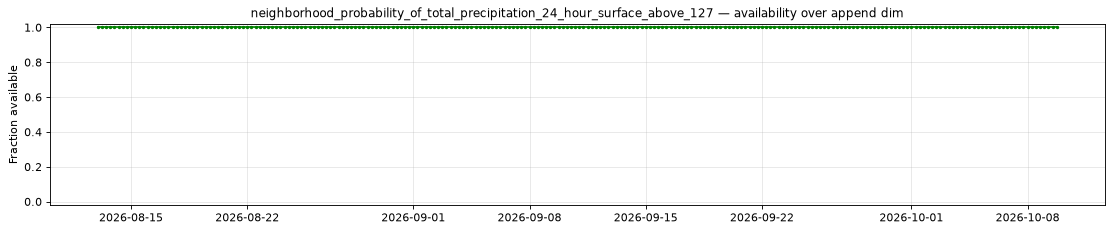
neighborhood_probability_of_total_precipitation_24_hour_surface_above_12p7
Metadata
| Field | Value |
|---|---|
| units | percent |
| long_name | Neighborhood probability of 24 hour total precipitation (surface) above 12.7 kg m-2 |
| short_name | neighborhood_probability_of_total_precipitation_24_hour_surface_above_12p7 |
| standard_name | n/a |
| step_type | accum |
| comment | Threshold applies to the preceding 24 hours of accumulation. Published every 3 forecast hours from lead 24 hours. Neighborhood probability of 24 hour total precipitation (surface) above 12.7 kg m-2. |
Point time series — 2026-08-13T00:00 - 2026-10-12T18:00, sampled lead=24h
| Point | min | mean | max |
|---|---|---|---|
| P1 | 0 | 50.11 | 100 |
| P2 | 0 | 29.63 | 100 |
Spatial — init=2026-10-11T06:00, lead=24h (reference not available)
| Source | min | mean | max |
|---|---|---|---|
| Validation | 0 | 27.35 | 100 |
Temporal — init=2026-10-11T06:00
| Source | min | mean | max |
|---|---|---|---|
| P1 Validation | 0 | 0 | 0 |
| P2 Validation | 1 | 5.154 | 20 |
Availability — 244 of 244 positions complete

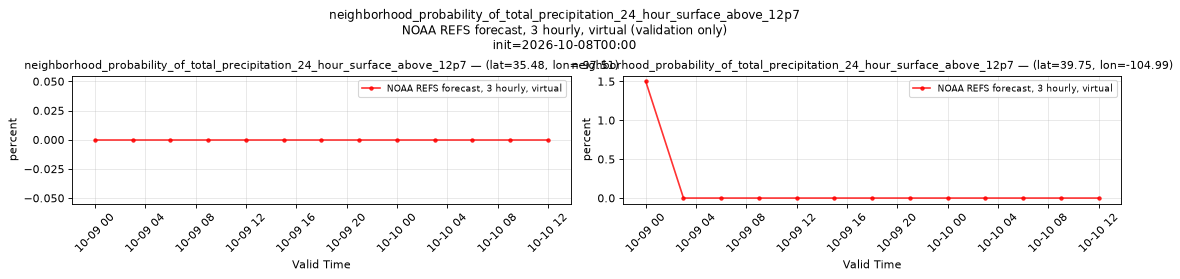
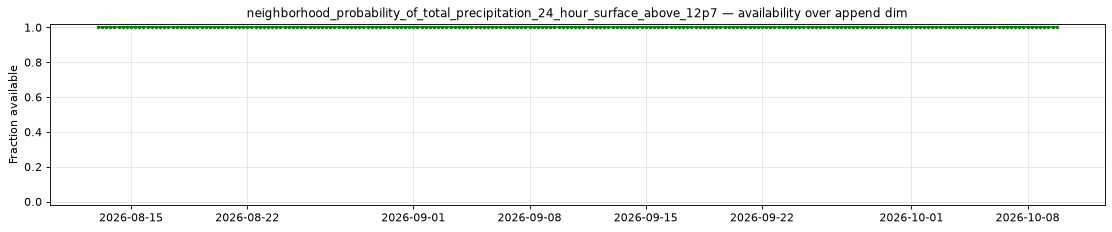
neighborhood_probability_of_total_precipitation_24_hour_surface_above_203p2
Metadata
| Field | Value |
|---|---|
| units | percent |
| long_name | Neighborhood probability of 24 hour total precipitation (surface) above 203.2 kg m-2 |
| short_name | neighborhood_probability_of_total_precipitation_24_hour_surface_above_203p2 |
| standard_name | n/a |
| step_type | accum |
| comment | Threshold applies to the preceding 24 hours of accumulation. Published every 3 forecast hours from lead 24 hours. Neighborhood probability of 24 hour total precipitation (surface) above 203.2 kg m-2. |
Point time series — 2026-08-13T00:00 - 2026-10-12T18:00, sampled lead=24h
| Point | min | mean | max |
|---|---|---|---|
| P1 | 0 | 0.5861 | 35.5 |
| P2 | 0 | 0 | 0 |
Spatial — init=2026-10-11T06:00, lead=24h (reference not available)
| Source | min | mean | max |
|---|---|---|---|
| Validation | 0 | 0.2455 | 92.5 |
Temporal — init=2026-10-11T06:00
| Source | min | mean | max |
|---|---|---|---|
| P1 Validation | 0 | 0 | 0 |
| P2 Validation | 0 | 0 | 0 |
Availability — 244 of 244 positions complete

neighborhood_probability_of_total_precipitation_24_hour_surface_above_25p4
Metadata
| Field | Value |
|---|---|
| units | percent |
| long_name | Neighborhood probability of 24 hour total precipitation (surface) above 25.4 kg m-2 |
| short_name | neighborhood_probability_of_total_precipitation_24_hour_surface_above_25p4 |
| standard_name | n/a |
| step_type | accum |
| comment | Threshold applies to the preceding 24 hours of accumulation. Published every 3 forecast hours from lead 24 hours. Neighborhood probability of 24 hour total precipitation (surface) above 25.4 kg m-2. |
Point time series — 2026-08-13T00:00 - 2026-10-12T18:00, sampled lead=24h
| Point | min | mean | max |
|---|---|---|---|
| P1 | 0 | 42.19 | 100 |
| P2 | 0 | 8.109 | 93.5 |
Spatial — init=2026-10-11T06:00, lead=24h (reference not available)
| Source | min | mean | max |
|---|---|---|---|
| Validation | 0 | 17.67 | 100 |
Temporal — init=2026-10-11T06:00
| Source | min | mean | max |
|---|---|---|---|
| P1 Validation | 0 | 0 | 0 |
| P2 Validation | 0 | 0 | 0 |
Availability — 244 of 244 positions complete

neighborhood_probability_of_total_precipitation_24_hour_surface_above_50p8
Metadata
| Field | Value |
|---|---|
| units | percent |
| long_name | Neighborhood probability of 24 hour total precipitation (surface) above 50.8 kg m-2 |
| short_name | neighborhood_probability_of_total_precipitation_24_hour_surface_above_50p8 |
| standard_name | n/a |
| step_type | accum |
| comment | Threshold applies to the preceding 24 hours of accumulation. Published every 3 forecast hours from lead 24 hours. Neighborhood probability of 24 hour total precipitation (surface) above 50.8 kg m-2. |
Point time series — 2026-08-13T00:00 - 2026-10-12T18:00, sampled lead=24h
| Point | min | mean | max |
|---|---|---|---|
| P1 | 0 | 27.35 | 100 |
| P2 | 0 | 0.4959 | 22 |
Spatial — init=2026-10-11T06:00, lead=24h (reference not available)
| Source | min | mean | max |
|---|---|---|---|
| Validation | 0 | 7.737 | 100 |
Temporal — init=2026-10-11T06:00
| Source | min | mean | max |
|---|---|---|---|
| P1 Validation | 0 | 0 | 0 |
| P2 Validation | 0 | 0 | 0 |
Availability — 244 of 244 positions complete
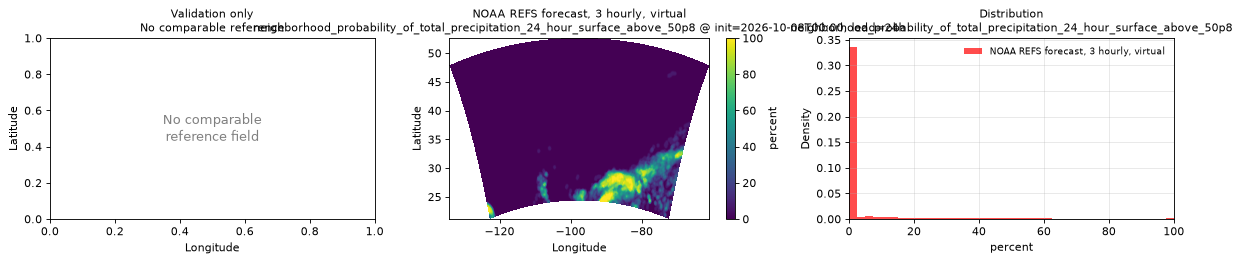
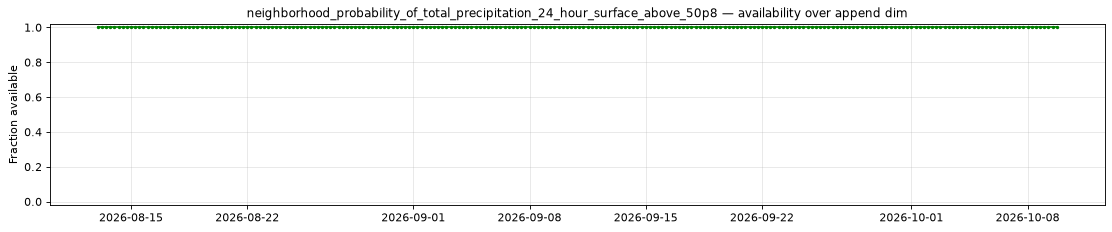
neighborhood_probability_of_total_precipitation_24_hour_surface_above_76p2
Metadata
| Field | Value |
|---|---|
| units | percent |
| long_name | Neighborhood probability of 24 hour total precipitation (surface) above 76.2 kg m-2 |
| short_name | neighborhood_probability_of_total_precipitation_24_hour_surface_above_76p2 |
| standard_name | n/a |
| step_type | accum |
| comment | Threshold applies to the preceding 24 hours of accumulation. Published every 3 forecast hours from lead 24 hours. Neighborhood probability of 24 hour total precipitation (surface) above 76.2 kg m-2. |
Point time series — 2026-08-13T00:00 - 2026-10-12T18:00, sampled lead=24h
| Point | min | mean | max |
|---|---|---|---|
| P1 | 0 | 14.61 | 95.5 |
| P2 | 0 | 0.004098 | 0.5 |
Spatial — init=2026-10-11T06:00, lead=24h (reference not available)
| Source | min | mean | max |
|---|---|---|---|
| Validation | 0 | 3.304 | 100 |
Temporal — init=2026-10-11T06:00
| Source | min | mean | max |
|---|---|---|---|
| P1 Validation | 0 | 0 | 0 |
| P2 Validation | 0 | 0 | 0 |
Availability — 244 of 244 positions complete
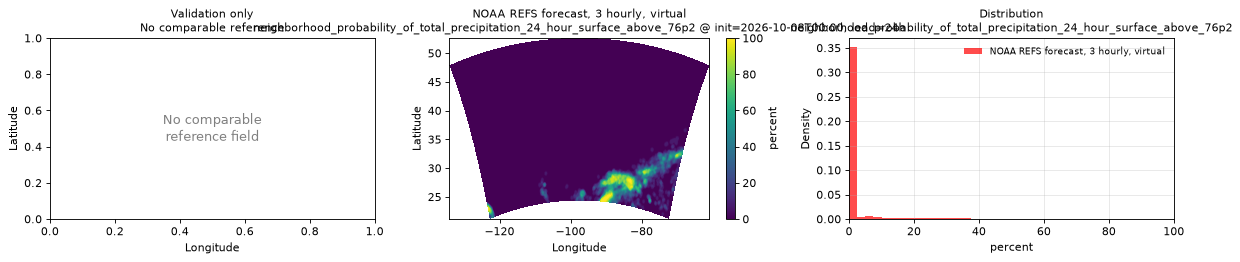

neighborhood_probability_of_total_precipitation_3_hour_surface_above_127
Metadata
| Field | Value |
|---|---|
| units | percent |
| long_name | Neighborhood probability of 3 hour total precipitation (surface) above 127 kg m-2 |
| short_name | neighborhood_probability_of_total_precipitation_3_hour_surface_above_127 |
| standard_name | n/a |
| step_type | accum |
| comment | Threshold applies to the preceding 3 hours of accumulation. Published every 3 forecast hours from lead 3 hours. Neighborhood probability of 3 hour total precipitation (surface) above 127 kg m-2. |
Point time series — 2026-08-13T00:00 - 2026-10-12T18:00, sampled lead=3h
| Point | min | mean | max |
|---|---|---|---|
| P1 | 0 | 0.4016 | 23 |
| P2 | 0 | 0 | 0 |
Spatial — init=2026-10-11T06:00, lead=24h (reference not available)
| Source | min | mean | max |
|---|---|---|---|
| Validation | 0 | 0.006671 | 7 |
Temporal — init=2026-10-11T06:00
| Source | min | mean | max |
|---|---|---|---|
| P1 Validation | 0 | 0 | 0 |
| P2 Validation | 0 | 0 | 0 |
Availability — 244 of 244 positions complete
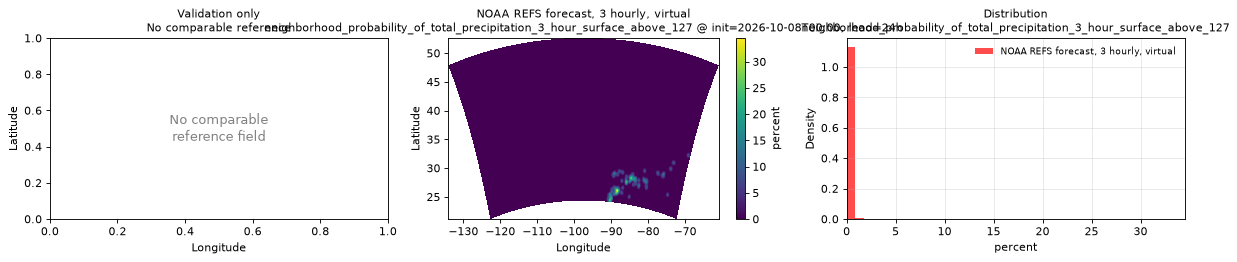
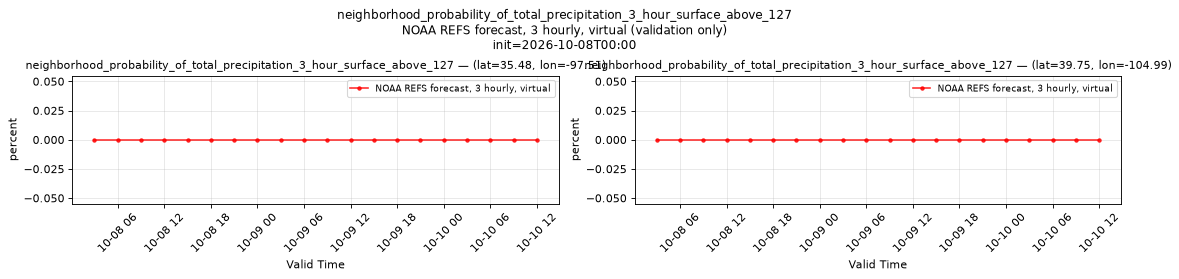

neighborhood_probability_of_total_precipitation_3_hour_surface_above_12p7
Metadata
| Field | Value |
|---|---|
| units | percent |
| long_name | Neighborhood probability of 3 hour total precipitation (surface) above 12.7 kg m-2 |
| short_name | neighborhood_probability_of_total_precipitation_3_hour_surface_above_12p7 |
| standard_name | n/a |
| step_type | accum |
| comment | Threshold applies to the preceding 3 hours of accumulation. Published every 3 forecast hours from lead 3 hours. Neighborhood probability of 3 hour total precipitation (surface) above 12.7 kg m-2. |
Point time series — 2026-08-13T00:00 - 2026-10-12T18:00, sampled lead=3h
| Point | min | mean | max |
|---|---|---|---|
| P1 | 0 | 16.25 | 97 |
| P2 | 0 | 3.6 | 88.5 |
Spatial — init=2026-10-11T06:00, lead=24h (reference not available)
| Source | min | mean | max |
|---|---|---|---|
| Validation | 0 | 4.674 | 100 |
Temporal — init=2026-10-11T06:00
| Source | min | mean | max |
|---|---|---|---|
| P1 Validation | 0 | 0 | 0 |
| P2 Validation | 0 | 0 | 0 |
Availability — 244 of 244 positions complete
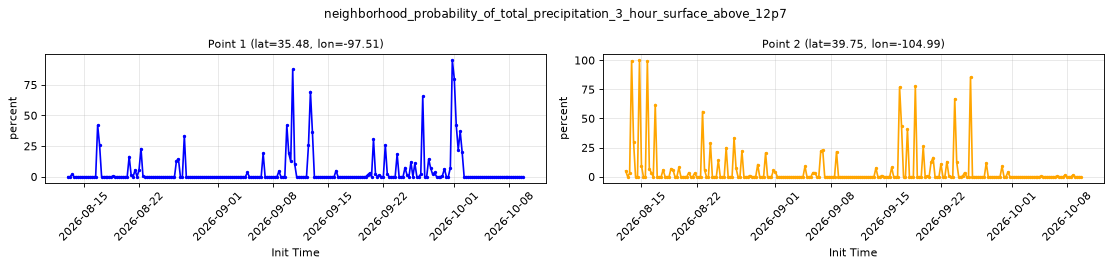


neighborhood_probability_of_total_precipitation_3_hour_surface_above_25p4
Metadata
| Field | Value |
|---|---|
| units | percent |
| long_name | Neighborhood probability of 3 hour total precipitation (surface) above 25.4 kg m-2 |
| short_name | neighborhood_probability_of_total_precipitation_3_hour_surface_above_25p4 |
| standard_name | n/a |
| step_type | accum |
| comment | Threshold applies to the preceding 3 hours of accumulation. Published every 3 forecast hours from lead 3 hours. Neighborhood probability of 3 hour total precipitation (surface) above 25.4 kg m-2. |
Point time series — 2026-08-13T00:00 - 2026-10-12T18:00, sampled lead=3h
| Point | min | mean | max |
|---|---|---|---|
| P1 | 0 | 12.2 | 93.5 |
| P2 | 0 | 0.627 | 47 |
Spatial — init=2026-10-11T06:00, lead=24h (reference not available)
| Source | min | mean | max |
|---|---|---|---|
| Validation | 0 | 1.655 | 99.5 |
Temporal — init=2026-10-11T06:00
| Source | min | mean | max |
|---|---|---|---|
| P1 Validation | 0 | 0 | 0 |
| P2 Validation | 0 | 0 | 0 |
Availability — 244 of 244 positions complete
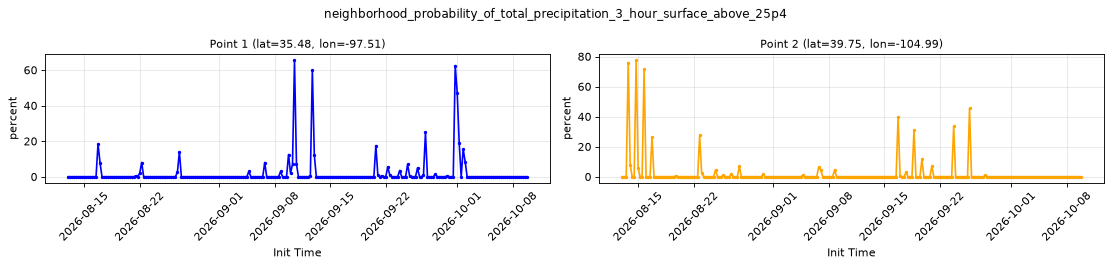


neighborhood_probability_of_total_precipitation_3_hour_surface_above_50p8
Metadata
| Field | Value |
|---|---|
| units | percent |
| long_name | Neighborhood probability of 3 hour total precipitation (surface) above 50.8 kg m-2 |
| short_name | neighborhood_probability_of_total_precipitation_3_hour_surface_above_50p8 |
| standard_name | n/a |
| step_type | accum |
| comment | Threshold applies to the preceding 3 hours of accumulation. Published every 3 forecast hours from lead 3 hours. Neighborhood probability of 3 hour total precipitation (surface) above 50.8 kg m-2. |
Point time series — 2026-08-13T00:00 - 2026-10-12T18:00, sampled lead=3h
| Point | min | mean | max |
|---|---|---|---|
| P1 | 0 | 6.33 | 88 |
| P2 | 0 | 0.01639 | 4 |
Spatial — init=2026-10-11T06:00, lead=24h (reference not available)
| Source | min | mean | max |
|---|---|---|---|
| Validation | 0 | 0.316 | 39 |
Temporal — init=2026-10-11T06:00
| Source | min | mean | max |
|---|---|---|---|
| P1 Validation | 0 | 0 | 0 |
| P2 Validation | 0 | 0 | 0 |
Availability — 244 of 244 positions complete
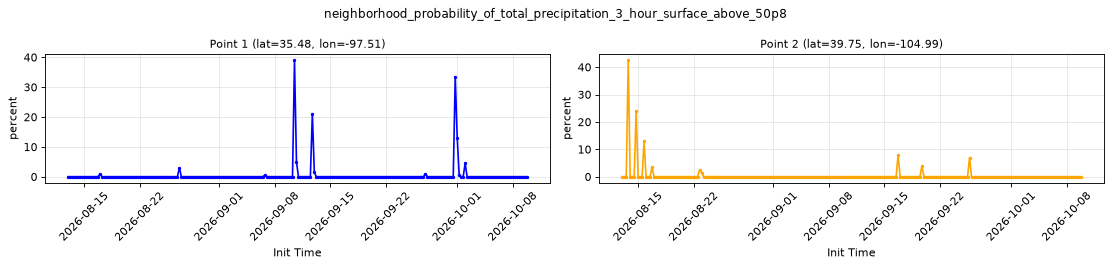

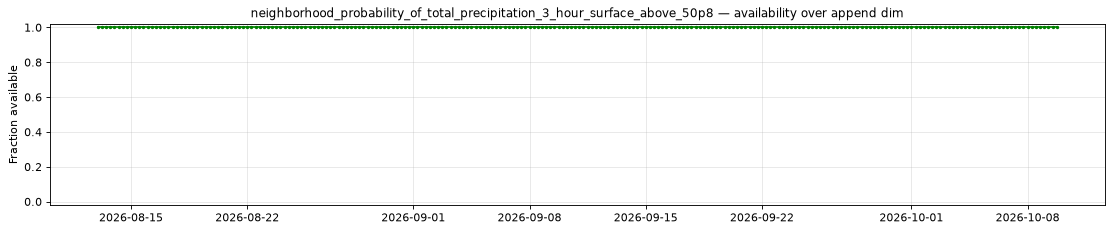
neighborhood_probability_of_total_precipitation_3_hour_surface_above_76p2
Metadata
| Field | Value |
|---|---|
| units | percent |
| long_name | Neighborhood probability of 3 hour total precipitation (surface) above 76.2 kg m-2 |
| short_name | neighborhood_probability_of_total_precipitation_3_hour_surface_above_76p2 |
| standard_name | n/a |
| step_type | accum |
| comment | Threshold applies to the preceding 3 hours of accumulation. Published every 3 forecast hours from lead 3 hours. Neighborhood probability of 3 hour total precipitation (surface) above 76.2 kg m-2. |
Point time series — 2026-08-13T00:00 - 2026-10-12T18:00, sampled lead=3h
| Point | min | mean | max |
|---|---|---|---|
| P1 | 0 | 2.428 | 49 |
| P2 | 0 | 0 | 0 |
Spatial — init=2026-10-11T06:00, lead=24h (reference not available)
| Source | min | mean | max |
|---|---|---|---|
| Validation | 0 | 0.05825 | 14.5 |
Temporal — init=2026-10-11T06:00
| Source | min | mean | max |
|---|---|---|---|
| P1 Validation | 0 | 0 | 0 |
| P2 Validation | 0 | 0 | 0 |
Availability — 244 of 244 positions complete
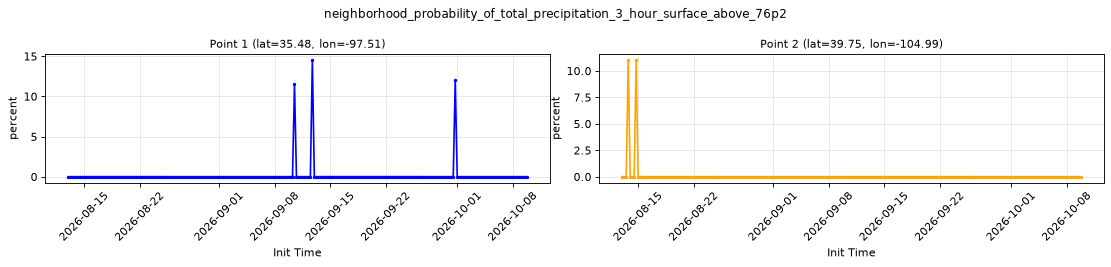
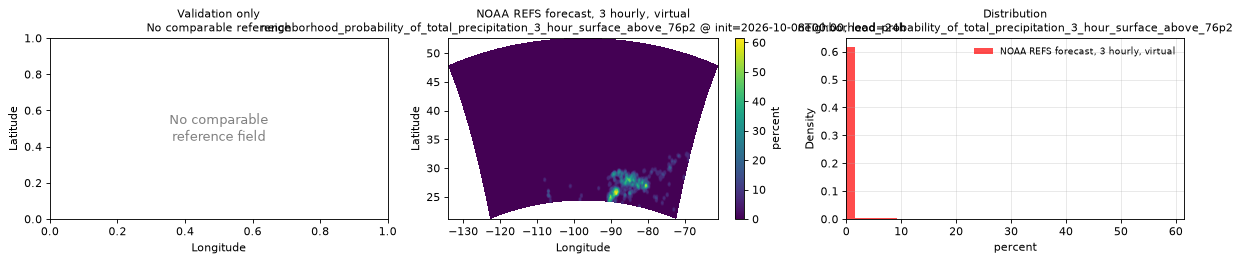
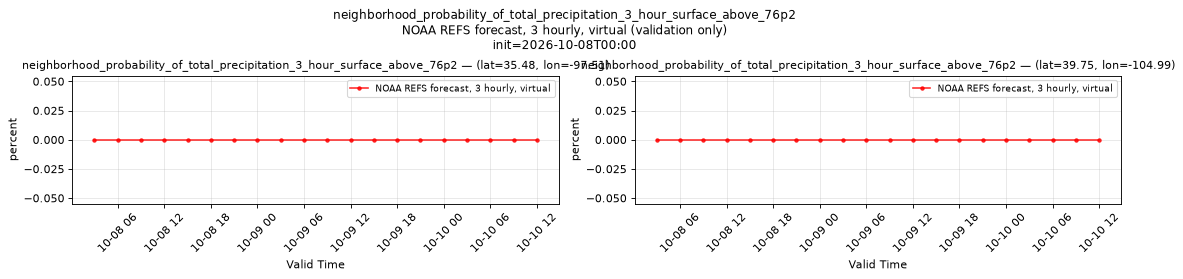
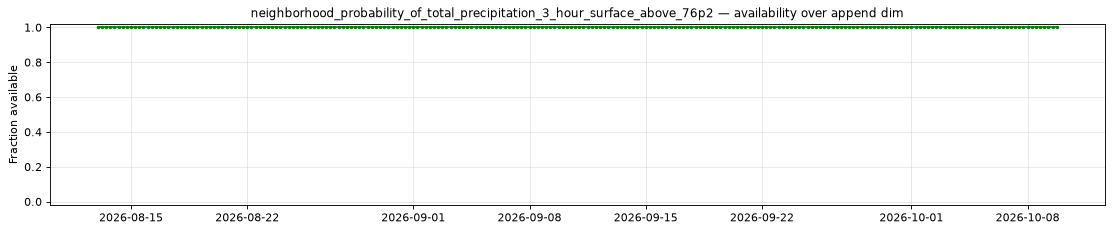
neighborhood_probability_of_total_precipitation_6_hour_surface_above_127
Metadata
| Field | Value |
|---|---|
| units | percent |
| long_name | Neighborhood probability of 6 hour total precipitation (surface) above 127 kg m-2 |
| short_name | neighborhood_probability_of_total_precipitation_6_hour_surface_above_127 |
| standard_name | n/a |
| step_type | accum |
| comment | Threshold applies to the preceding 6 hours of accumulation. Published every 3 forecast hours from lead 6 hours. Neighborhood probability of 6 hour total precipitation (surface) above 127 kg m-2. |
Point time series — 2026-08-13T00:00 - 2026-10-12T18:00, sampled lead=6h
| Point | min | mean | max |
|---|---|---|---|
| P1 | 0 | 0.6578 | 31 |
| P2 | 0 | 0 | 0 |
Spatial — init=2026-10-11T06:00, lead=24h (reference not available)
| Source | min | mean | max |
|---|---|---|---|
| Validation | 0 | 0.0201 | 14 |
Temporal — init=2026-10-11T06:00
| Source | min | mean | max |
|---|---|---|---|
| P1 Validation | 0 | 0 | 0 |
| P2 Validation | 0 | 0 | 0 |
Availability — 244 of 244 positions complete
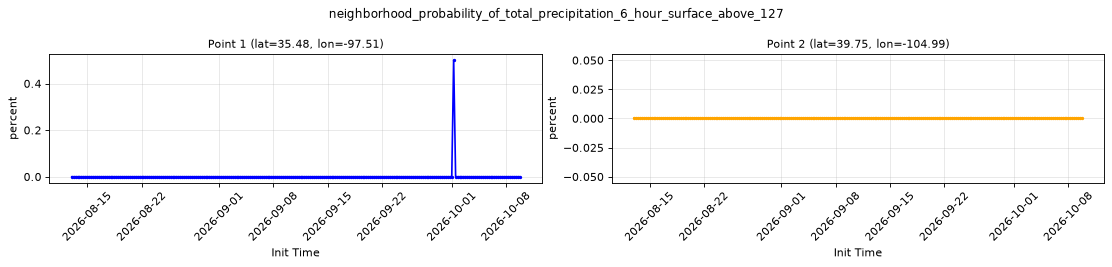
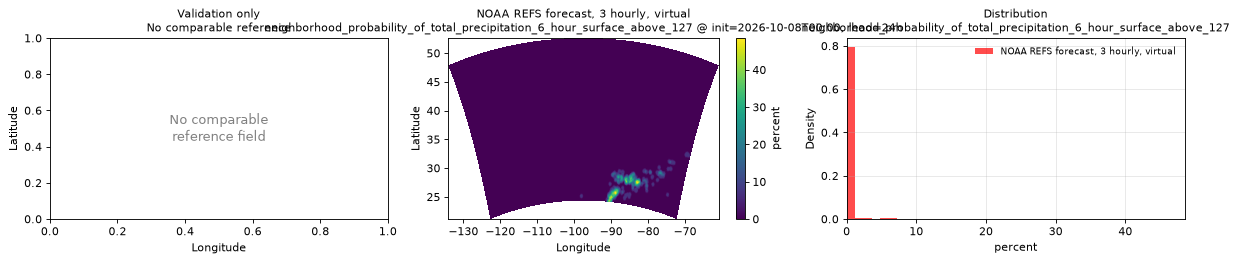
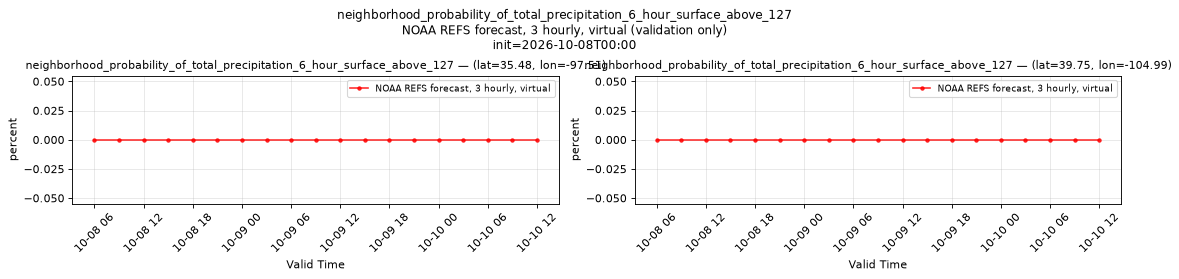

neighborhood_probability_of_total_precipitation_6_hour_surface_above_12p7
Metadata
| Field | Value |
|---|---|
| units | percent |
| long_name | Neighborhood probability of 6 hour total precipitation (surface) above 12.7 kg m-2 |
| short_name | neighborhood_probability_of_total_precipitation_6_hour_surface_above_12p7 |
| standard_name | n/a |
| step_type | accum |
| comment | Threshold applies to the preceding 6 hours of accumulation. Published every 3 forecast hours from lead 6 hours. Neighborhood probability of 6 hour total precipitation (surface) above 12.7 kg m-2. |
Point time series — 2026-08-13T00:00 - 2026-10-12T18:00, sampled lead=6h
| Point | min | mean | max |
|---|---|---|---|
| P1 | 0 | 21.6 | 100 |
| P2 | 0 | 7.566 | 100 |
Spatial — init=2026-10-11T06:00, lead=24h (reference not available)
| Source | min | mean | max |
|---|---|---|---|
| Validation | 0 | 9.465 | 100 |
Temporal — init=2026-10-11T06:00
| Source | min | mean | max |
|---|---|---|---|
| P1 Validation | 0 | 0 | 0 |
| P2 Validation | 0 | 0.1579 | 3 |
Availability — 244 of 244 positions complete
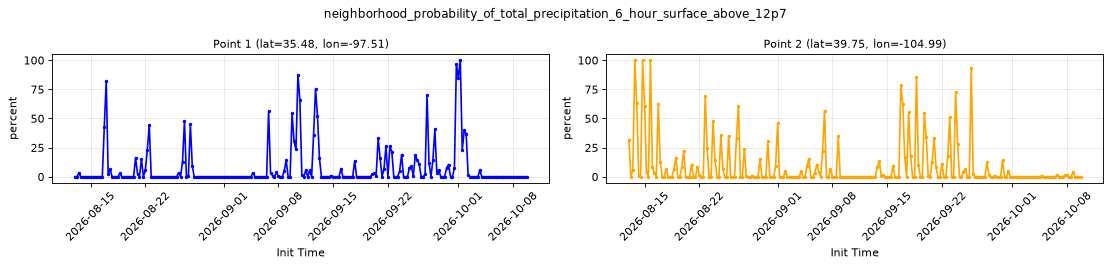

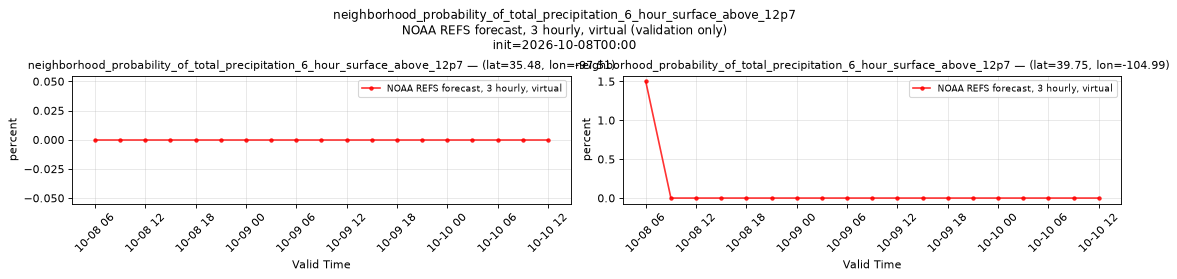
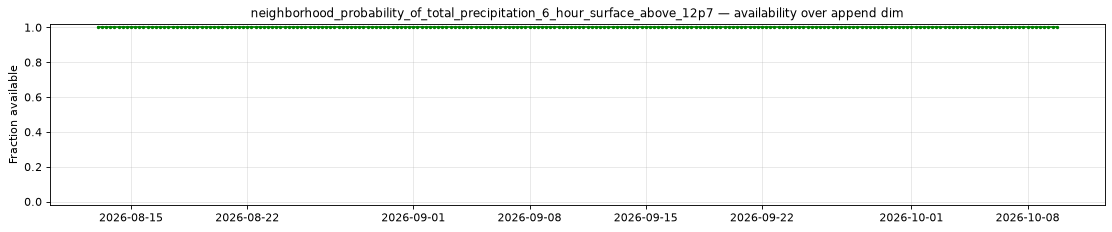
neighborhood_probability_of_total_precipitation_6_hour_surface_above_25p4
Metadata
| Field | Value |
|---|---|
| units | percent |
| long_name | Neighborhood probability of 6 hour total precipitation (surface) above 25.4 kg m-2 |
| short_name | neighborhood_probability_of_total_precipitation_6_hour_surface_above_25p4 |
| standard_name | n/a |
| step_type | accum |
| comment | Threshold applies to the preceding 6 hours of accumulation. Published every 3 forecast hours from lead 6 hours. Neighborhood probability of 6 hour total precipitation (surface) above 25.4 kg m-2. |
Point time series — 2026-08-13T00:00 - 2026-10-12T18:00, sampled lead=6h
| Point | min | mean | max |
|---|---|---|---|
| P1 | 0 | 16.7 | 100 |
| P2 | 0 | 1.314 | 63.5 |
Spatial — init=2026-10-11T06:00, lead=24h (reference not available)
| Source | min | mean | max |
|---|---|---|---|
| Validation | 0 | 3.808 | 100 |
Temporal — init=2026-10-11T06:00
| Source | min | mean | max |
|---|---|---|---|
| P1 Validation | 0 | 0 | 0 |
| P2 Validation | 0 | 0 | 0 |
Availability — 244 of 244 positions complete
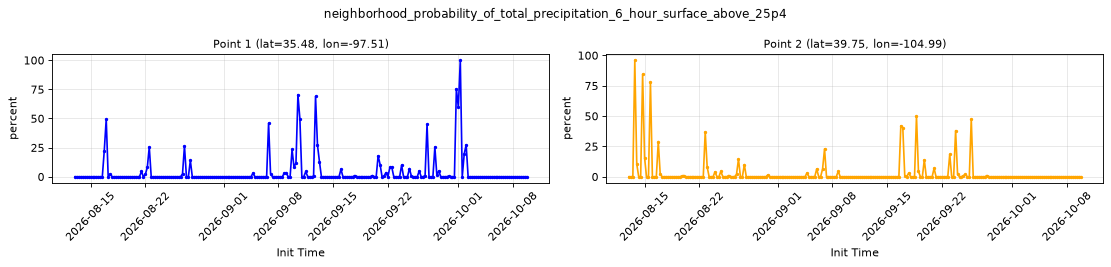

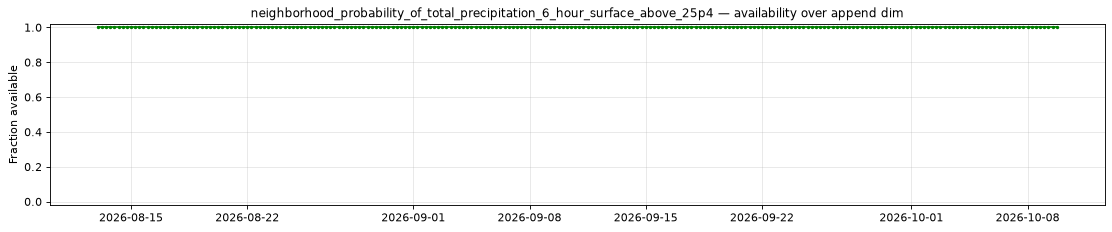
neighborhood_probability_of_total_precipitation_6_hour_surface_above_50p8
Metadata
| Field | Value |
|---|---|
| units | percent |
| long_name | Neighborhood probability of 6 hour total precipitation (surface) above 50.8 kg m-2 |
| short_name | neighborhood_probability_of_total_precipitation_6_hour_surface_above_50p8 |
| standard_name | n/a |
| step_type | accum |
| comment | Threshold applies to the preceding 6 hours of accumulation. Published every 3 forecast hours from lead 6 hours. Neighborhood probability of 6 hour total precipitation (surface) above 50.8 kg m-2. |
Point time series — 2026-08-13T00:00 - 2026-10-12T18:00, sampled lead=6h
| Point | min | mean | max |
|---|---|---|---|
| P1 | 0 | 9.4 | 88.5 |
| P2 | 0 | 0.06148 | 9.5 |
Spatial — init=2026-10-11T06:00, lead=24h (reference not available)
| Source | min | mean | max |
|---|---|---|---|
| Validation | 0 | 0.8761 | 79.5 |
Temporal — init=2026-10-11T06:00
| Source | min | mean | max |
|---|---|---|---|
| P1 Validation | 0 | 0 | 0 |
| P2 Validation | 0 | 0 | 0 |
Availability — 244 of 244 positions complete
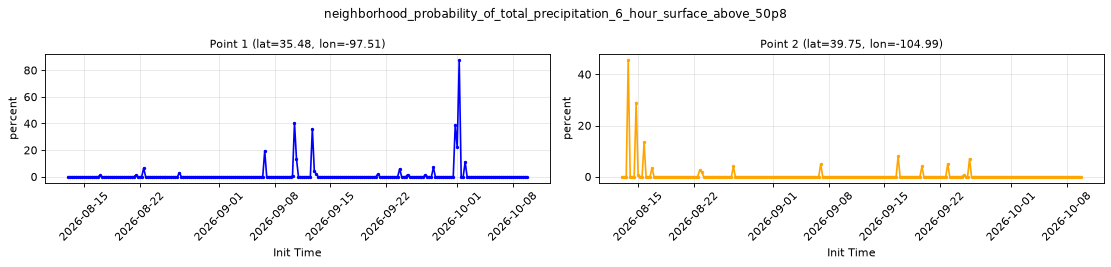
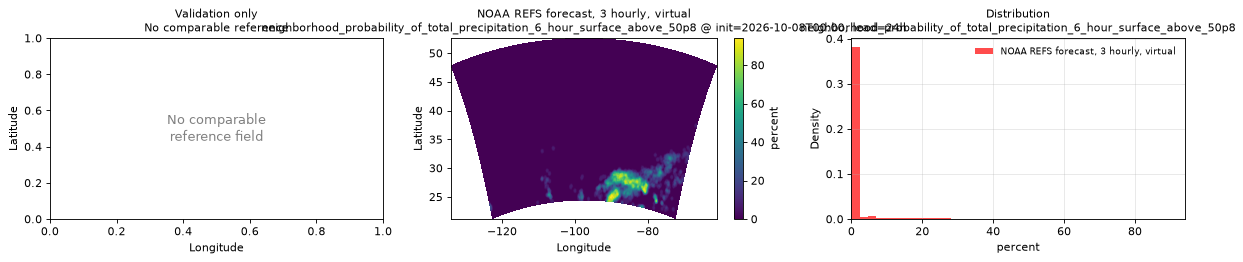
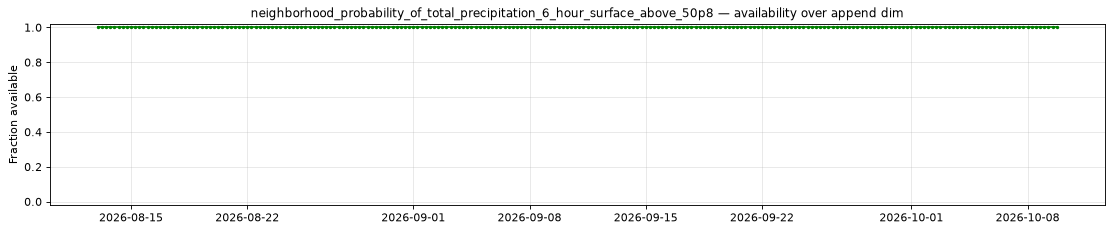
neighborhood_probability_of_total_precipitation_6_hour_surface_above_76p2
Metadata
| Field | Value |
|---|---|
| units | percent |
| long_name | Neighborhood probability of 6 hour total precipitation (surface) above 76.2 kg m-2 |
| short_name | neighborhood_probability_of_total_precipitation_6_hour_surface_above_76p2 |
| standard_name | n/a |
| step_type | accum |
| comment | Threshold applies to the preceding 6 hours of accumulation. Published every 3 forecast hours from lead 6 hours. Neighborhood probability of 6 hour total precipitation (surface) above 76.2 kg m-2. |
Point time series — 2026-08-13T00:00 - 2026-10-12T18:00, sampled lead=6h
| Point | min | mean | max |
|---|---|---|---|
| P1 | 0 | 4.01 | 69 |
| P2 | 0 | 0 | 0 |
Spatial — init=2026-10-11T06:00, lead=24h (reference not available)
| Source | min | mean | max |
|---|---|---|---|
| Validation | 0 | 0.1919 | 44.5 |
Temporal — init=2026-10-11T06:00
| Source | min | mean | max |
|---|---|---|---|
| P1 Validation | 0 | 0 | 0 |
| P2 Validation | 0 | 0 | 0 |
Availability — 244 of 244 positions complete
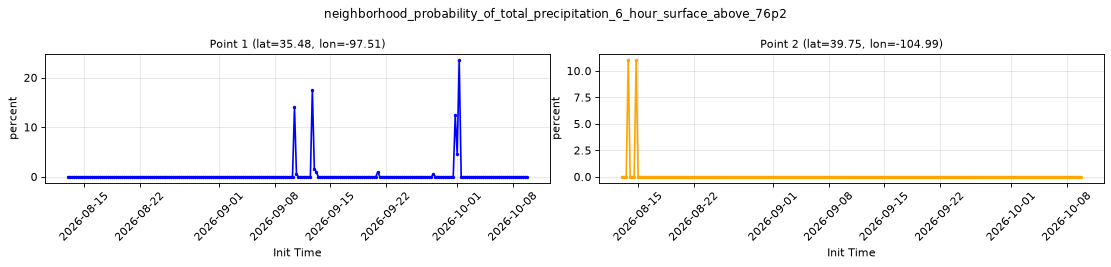
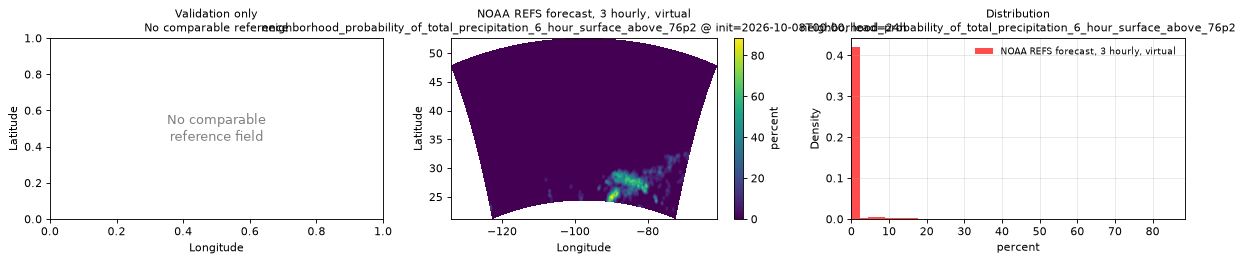
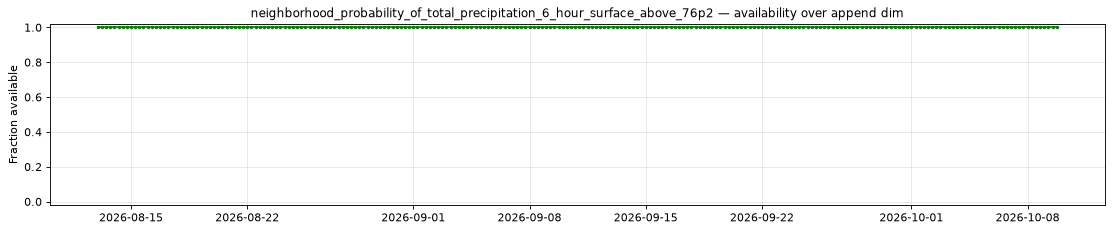
neighborhood_probability_of_total_snowfall_12_hour_surface_above_0p025
Metadata
| Field | Value |
|---|---|
| units | percent |
| long_name | Neighborhood probability of 12 hour total snowfall (surface) above 0.025 m |
| short_name | neighborhood_probability_of_total_snowfall_12_hour_surface_above_0p025 |
| standard_name | n/a |
| step_type | accum |
| comment | Threshold applies to the preceding 12 hours of accumulation. Published every 3 forecast hours from lead 12 hours. Neighborhood probability of 12 hour total snowfall (surface) above 0.025 m. |
Point time series — 2026-08-13T00:00 - 2026-10-12T18:00, sampled lead=12h
| Point | min | mean | max |
|---|---|---|---|
| P1 | 0 | 0 | 0 |
| P2 | 0 | 2.08 | 48.5 |
Spatial — init=2026-10-11T06:00, lead=24h (reference not available)
| Source | min | mean | max |
|---|---|---|---|
| Validation | 0 | 2.553 | 100 |
Temporal — init=2026-10-11T06:00
| Source | min | mean | max |
|---|---|---|---|
| P1 Validation | 0 | 0 | 0 |
| P2 Validation | 0 | 3.882 | 33 |
Availability — 244 of 244 positions complete


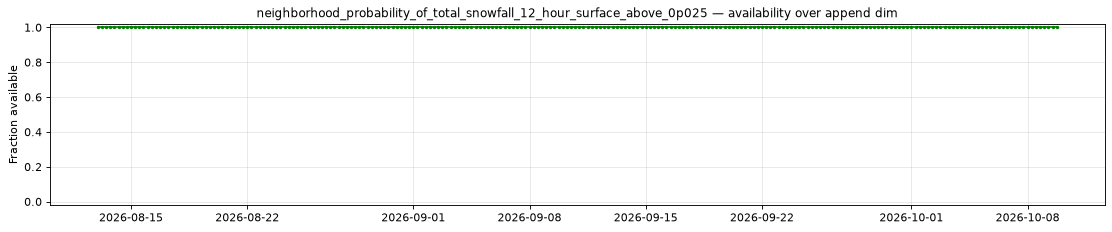
neighborhood_probability_of_total_snowfall_12_hour_surface_above_0p076
Metadata
| Field | Value |
|---|---|
| units | percent |
| long_name | Neighborhood probability of 12 hour total snowfall (surface) above 0.076 m |
| short_name | neighborhood_probability_of_total_snowfall_12_hour_surface_above_0p076 |
| standard_name | n/a |
| step_type | accum |
| comment | Threshold applies to the preceding 12 hours of accumulation. Published every 3 forecast hours from lead 12 hours. Neighborhood probability of 12 hour total snowfall (surface) above 0.076 m. |
Point time series — 2026-08-13T00:00 - 2026-10-12T18:00, sampled lead=12h
| Point | min | mean | max |
|---|---|---|---|
| P1 | 0 | 0 | 0 |
| P2 | 0 | 0.08607 | 13 |
Spatial — init=2026-10-11T06:00, lead=24h (reference not available)
| Source | min | mean | max |
|---|---|---|---|
| Validation | 0 | 1.153 | 100 |
Temporal — init=2026-10-11T06:00
| Source | min | mean | max |
|---|---|---|---|
| P1 Validation | 0 | 0 | 0 |
| P2 Validation | 0 | 0.08824 | 1.5 |
Availability — 244 of 244 positions complete
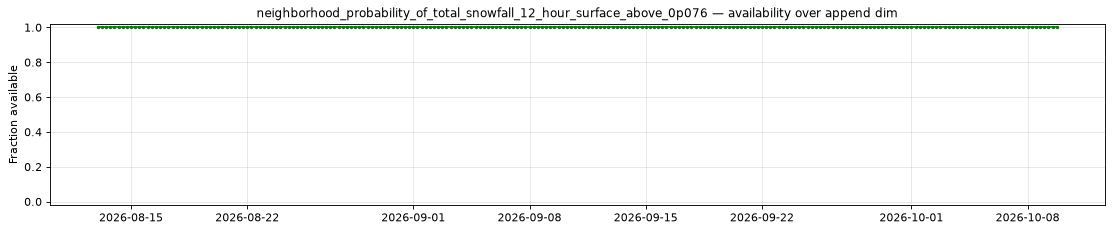
neighborhood_probability_of_total_snowfall_12_hour_surface_above_0p152
Metadata
| Field | Value |
|---|---|
| units | percent |
| long_name | Neighborhood probability of 12 hour total snowfall (surface) above 0.152 m |
| short_name | neighborhood_probability_of_total_snowfall_12_hour_surface_above_0p152 |
| standard_name | n/a |
| step_type | accum |
| comment | Threshold applies to the preceding 12 hours of accumulation. Published every 3 forecast hours from lead 12 hours. Neighborhood probability of 12 hour total snowfall (surface) above 0.152 m. |
Point time series — 2026-08-13T00:00 - 2026-10-12T18:00, sampled lead=12h
| Point | min | mean | max |
|---|---|---|---|
| P1 | 0 | 0 | 0 |
| P2 | 0 | 0 | 0 |
Spatial — init=2026-10-11T06:00, lead=24h (reference not available)
| Source | min | mean | max |
|---|---|---|---|
| Validation | 0 | 0.4467 | 100 |
Temporal — init=2026-10-11T06:00
| Source | min | mean | max |
|---|---|---|---|
| P1 Validation | 0 | 0 | 0 |
| P2 Validation | 0 | 0 | 0 |
Availability — 244 of 244 positions complete


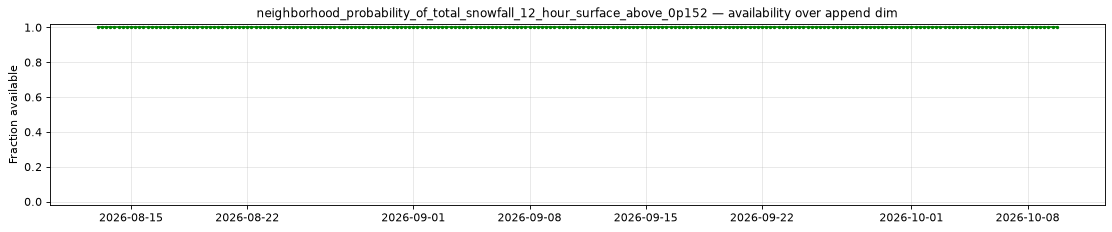
neighborhood_probability_of_total_snowfall_12_hour_surface_above_0p304
Metadata
| Field | Value |
|---|---|
| units | percent |
| long_name | Neighborhood probability of 12 hour total snowfall (surface) above 0.304 m |
| short_name | neighborhood_probability_of_total_snowfall_12_hour_surface_above_0p304 |
| standard_name | n/a |
| step_type | accum |
| comment | Threshold applies to the preceding 12 hours of accumulation. Published every 3 forecast hours from lead 12 hours. Neighborhood probability of 12 hour total snowfall (surface) above 0.304 m. |
Point time series — 2026-08-13T00:00 - 2026-10-12T18:00, sampled lead=12h
| Point | min | mean | max |
|---|---|---|---|
| P1 | 0 | 0 | 0 |
| P2 | 0 | 0 | 0 |
Spatial — init=2026-10-11T06:00, lead=24h (reference not available)
| Source | min | mean | max |
|---|---|---|---|
| Validation | 0 | 0.04809 | 50 |
Temporal — init=2026-10-11T06:00
| Source | min | mean | max |
|---|---|---|---|
| P1 Validation | 0 | 0 | 0 |
| P2 Validation | 0 | 0 | 0 |
Availability — 244 of 244 positions complete
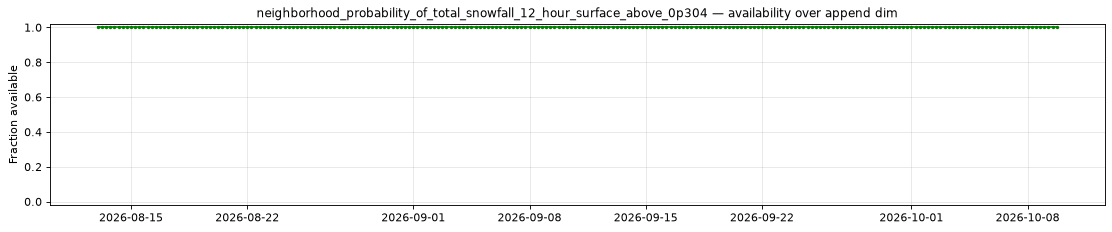
neighborhood_probability_of_total_snowfall_12_hour_surface_above_0p457
Metadata
| Field | Value |
|---|---|
| units | percent |
| long_name | Neighborhood probability of 12 hour total snowfall (surface) above 0.457 m |
| short_name | neighborhood_probability_of_total_snowfall_12_hour_surface_above_0p457 |
| standard_name | n/a |
| step_type | accum |
| comment | Threshold applies to the preceding 12 hours of accumulation. Published every 3 forecast hours from lead 12 hours. Neighborhood probability of 12 hour total snowfall (surface) above 0.457 m. |
Point time series — 2026-08-13T00:00 - 2026-10-12T18:00, sampled lead=12h
| Point | min | mean | max |
|---|---|---|---|
| P1 | 0 | 0 | 0 |
| P2 | 0 | 0 | 0 |
Spatial — init=2026-10-11T06:00, lead=24h (reference not available)
| Source | min | mean | max |
|---|---|---|---|
| Validation | 0 | 0 | 0 |
Temporal — init=2026-10-11T06:00
| Source | min | mean | max |
|---|---|---|---|
| P1 Validation | 0 | 0 | 0 |
| P2 Validation | 0 | 0 | 0 |
Availability — 244 of 244 positions complete
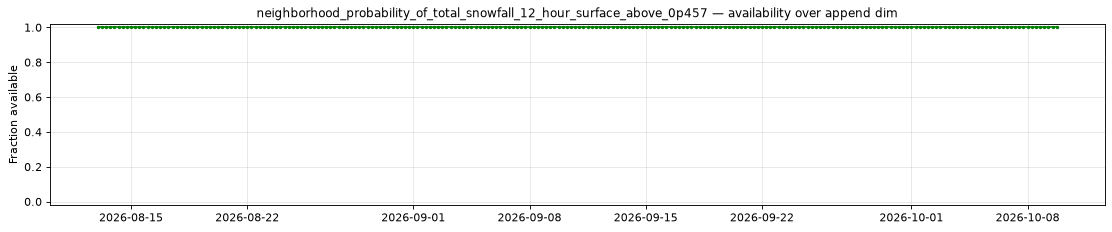
neighborhood_probability_of_total_snowfall_24_hour_surface_above_0p025
Metadata
| Field | Value |
|---|---|
| units | percent |
| long_name | Neighborhood probability of 24 hour total snowfall (surface) above 0.025 m |
| short_name | neighborhood_probability_of_total_snowfall_24_hour_surface_above_0p025 |
| standard_name | n/a |
| step_type | accum |
| comment | Threshold applies to the preceding 24 hours of accumulation. Published every 3 forecast hours from lead 24 hours. Neighborhood probability of 24 hour total snowfall (surface) above 0.025 m. |
Point time series — 2026-08-13T00:00 - 2026-10-12T18:00, sampled lead=24h
| Point | min | mean | max |
|---|---|---|---|
| P1 | 0 | 0.01434 | 2.5 |
| P2 | 0 | 5.168 | 71.5 |
Spatial — init=2026-10-11T06:00, lead=24h (reference not available)
| Source | min | mean | max |
|---|---|---|---|
| Validation | 0 | 3.196 | 100 |
Temporal — init=2026-10-11T06:00
| Source | min | mean | max |
|---|---|---|---|
| P1 Validation | 0 | 0 | 0 |
| P2 Validation | 0 | 5.077 | 33 |
Availability — 244 of 244 positions complete


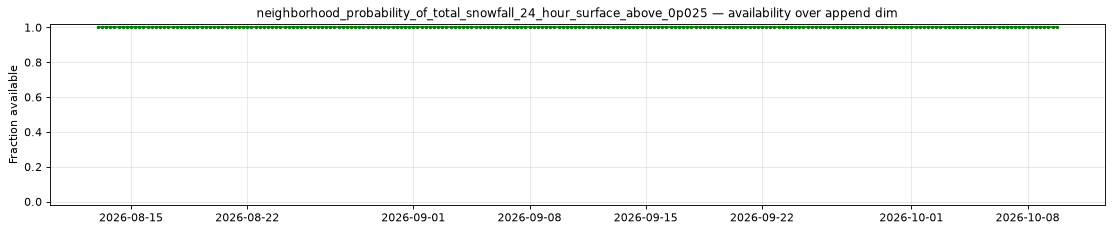
neighborhood_probability_of_total_snowfall_24_hour_surface_above_0p076
Metadata
| Field | Value |
|---|---|
| units | percent |
| long_name | Neighborhood probability of 24 hour total snowfall (surface) above 0.076 m |
| short_name | neighborhood_probability_of_total_snowfall_24_hour_surface_above_0p076 |
| standard_name | n/a |
| step_type | accum |
| comment | Threshold applies to the preceding 24 hours of accumulation. Published every 3 forecast hours from lead 24 hours. Neighborhood probability of 24 hour total snowfall (surface) above 0.076 m. |
Point time series — 2026-08-13T00:00 - 2026-10-12T18:00, sampled lead=24h
| Point | min | mean | max |
|---|---|---|---|
| P1 | 0 | 0 | 0 |
| P2 | 0 | 0.5676 | 35.5 |
Spatial — init=2026-10-11T06:00, lead=24h (reference not available)
| Source | min | mean | max |
|---|---|---|---|
| Validation | 0 | 1.964 | 100 |
Temporal — init=2026-10-11T06:00
| Source | min | mean | max |
|---|---|---|---|
| P1 Validation | 0 | 0 | 0 |
| P2 Validation | 0 | 0.1154 | 1.5 |
Availability — 244 of 244 positions complete
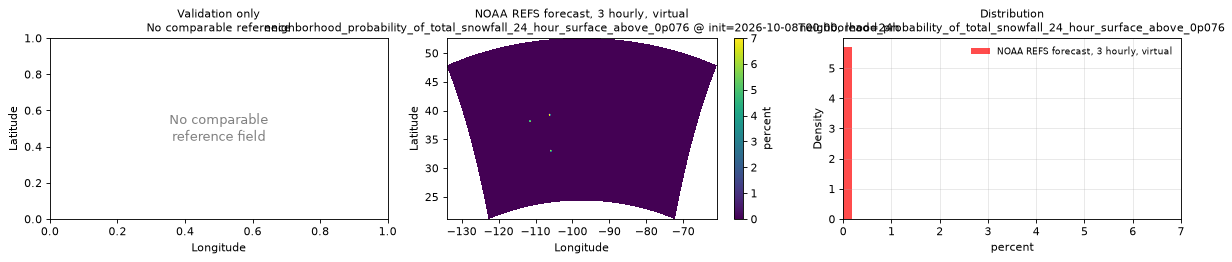
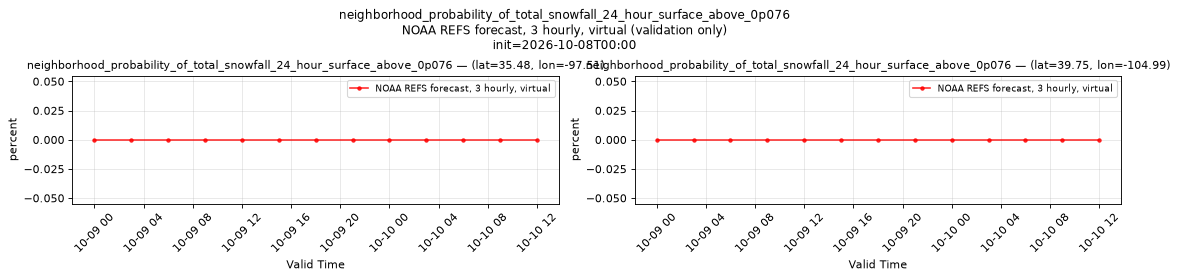
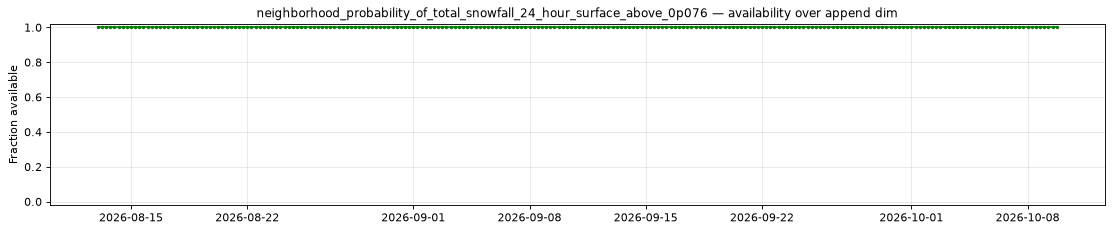
neighborhood_probability_of_total_snowfall_24_hour_surface_above_0p152
Metadata
| Field | Value |
|---|---|
| units | percent |
| long_name | Neighborhood probability of 24 hour total snowfall (surface) above 0.152 m |
| short_name | neighborhood_probability_of_total_snowfall_24_hour_surface_above_0p152 |
| standard_name | n/a |
| step_type | accum |
| comment | Threshold applies to the preceding 24 hours of accumulation. Published every 3 forecast hours from lead 24 hours. Neighborhood probability of 24 hour total snowfall (surface) above 0.152 m. |
Point time series — 2026-08-13T00:00 - 2026-10-12T18:00, sampled lead=24h
| Point | min | mean | max |
|---|---|---|---|
| P1 | 0 | 0 | 0 |
| P2 | 0 | 0.1107 | 13.5 |
Spatial — init=2026-10-11T06:00, lead=24h (reference not available)
| Source | min | mean | max |
|---|---|---|---|
| Validation | 0 | 1.132 | 100 |
Temporal — init=2026-10-11T06:00
| Source | min | mean | max |
|---|---|---|---|
| P1 Validation | 0 | 0 | 0 |
| P2 Validation | 0 | 0 | 0 |
Availability — 244 of 244 positions complete


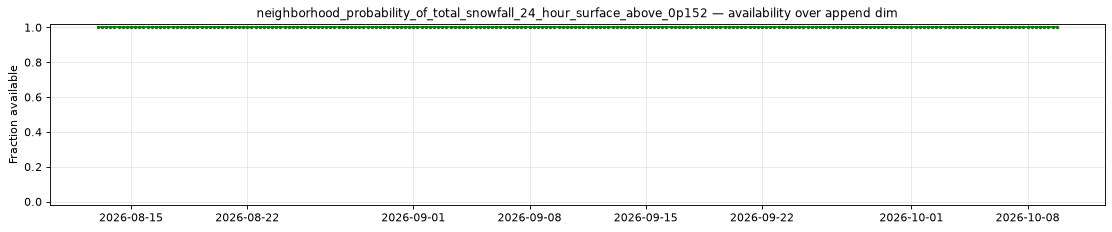
neighborhood_probability_of_total_snowfall_24_hour_surface_above_0p304
Metadata
| Field | Value |
|---|---|
| units | percent |
| long_name | Neighborhood probability of 24 hour total snowfall (surface) above 0.304 m |
| short_name | neighborhood_probability_of_total_snowfall_24_hour_surface_above_0p304 |
| standard_name | n/a |
| step_type | accum |
| comment | Threshold applies to the preceding 24 hours of accumulation. Published every 3 forecast hours from lead 24 hours. Neighborhood probability of 24 hour total snowfall (surface) above 0.304 m. |
Point time series — 2026-08-13T00:00 - 2026-10-12T18:00, sampled lead=24h
| Point | min | mean | max |
|---|---|---|---|
| P1 | 0 | 0 | 0 |
| P2 | 0 | 0.0123 | 3 |
Spatial — init=2026-10-11T06:00, lead=24h (reference not available)
| Source | min | mean | max |
|---|---|---|---|
| Validation | 0 | 0.3924 | 100 |
Temporal — init=2026-10-11T06:00
| Source | min | mean | max |
|---|---|---|---|
| P1 Validation | 0 | 0 | 0 |
| P2 Validation | 0 | 0 | 0 |
Availability — 244 of 244 positions complete
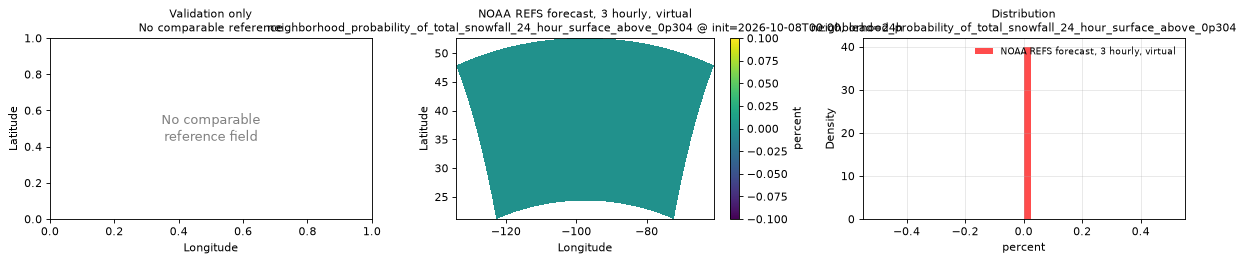
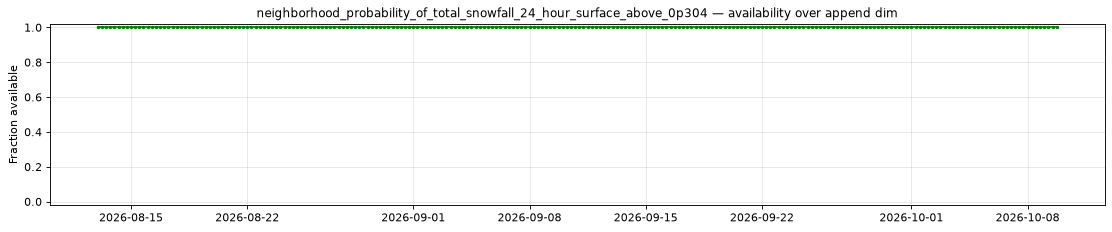
neighborhood_probability_of_total_snowfall_24_hour_surface_above_0p457
Metadata
| Field | Value |
|---|---|
| units | percent |
| long_name | Neighborhood probability of 24 hour total snowfall (surface) above 0.457 m |
| short_name | neighborhood_probability_of_total_snowfall_24_hour_surface_above_0p457 |
| standard_name | n/a |
| step_type | accum |
| comment | Threshold applies to the preceding 24 hours of accumulation. Published every 3 forecast hours from lead 24 hours. Neighborhood probability of 24 hour total snowfall (surface) above 0.457 m. |
Point time series — 2026-08-13T00:00 - 2026-10-12T18:00, sampled lead=24h
| Point | min | mean | max |
|---|---|---|---|
| P1 | 0 | 0 | 0 |
| P2 | 0 | 0 | 0 |
Spatial — init=2026-10-11T06:00, lead=24h (reference not available)
| Source | min | mean | max |
|---|---|---|---|
| Validation | 0 | 0.1213 | 85.5 |
Temporal — init=2026-10-11T06:00
| Source | min | mean | max |
|---|---|---|---|
| P1 Validation | 0 | 0 | 0 |
| P2 Validation | 0 | 0 | 0 |
Availability — 244 of 244 positions complete
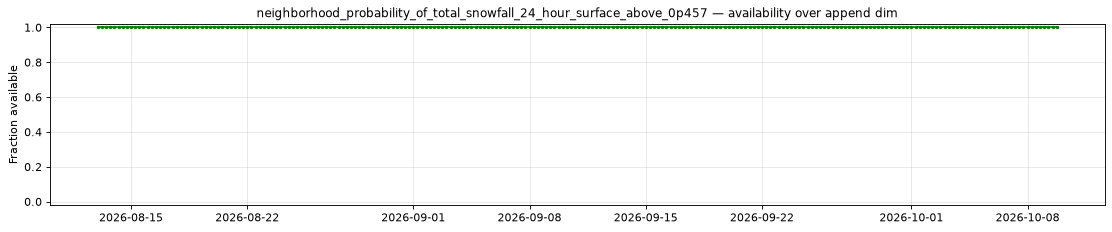
neighborhood_probability_of_total_snowfall_3_hour_surface_above_0p025
Metadata
| Field | Value |
|---|---|
| units | percent |
| long_name | Neighborhood probability of 3 hour total snowfall (surface) above 0.025 m |
| short_name | neighborhood_probability_of_total_snowfall_3_hour_surface_above_0p025 |
| standard_name | n/a |
| step_type | accum |
| comment | Threshold applies to the preceding 3 hours of accumulation. Published every 3 forecast hours from lead 3 hours. Neighborhood probability of 3 hour total snowfall (surface) above 0.025 m. |
Point time series — 2026-08-13T00:00 - 2026-10-12T18:00, sampled lead=3h
| Point | min | mean | max |
|---|---|---|---|
| P1 | 0 | 0 | 0 |
| P2 | 0 | 0.2992 | 14.5 |
Spatial — init=2026-10-11T06:00, lead=24h (reference not available)
| Source | min | mean | max |
|---|---|---|---|
| Validation | 0 | 1.182 | 100 |
Temporal — init=2026-10-11T06:00
| Source | min | mean | max |
|---|---|---|---|
| P1 Validation | 0 | 0 | 0 |
| P2 Validation | 0 | 2.55 | 18 |
Availability — 244 of 244 positions complete
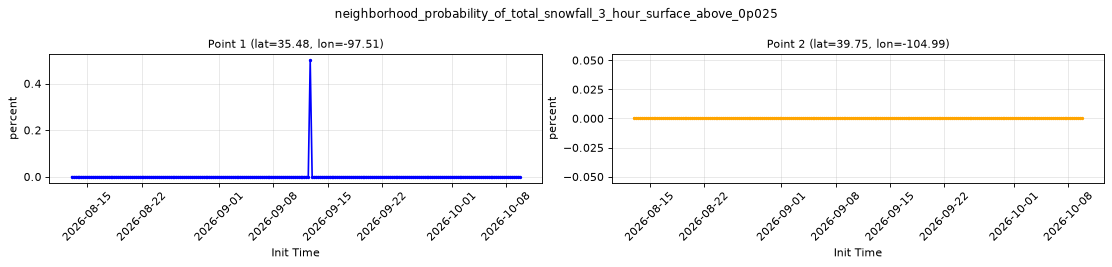
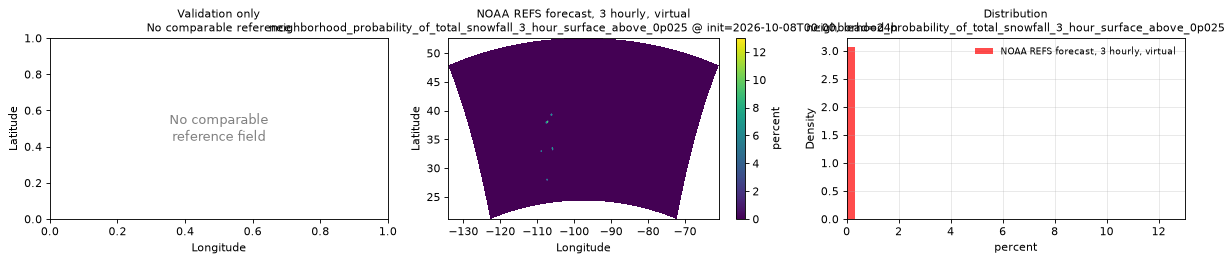
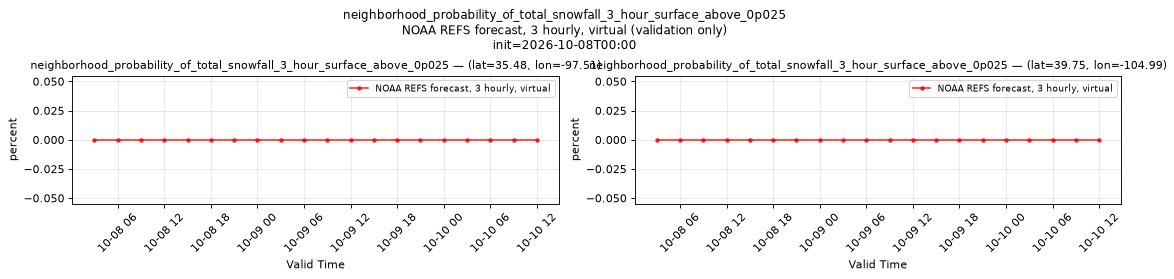

neighborhood_probability_of_total_snowfall_3_hour_surface_above_0p076
Metadata
| Field | Value |
|---|---|
| units | percent |
| long_name | Neighborhood probability of 3 hour total snowfall (surface) above 0.076 m |
| short_name | neighborhood_probability_of_total_snowfall_3_hour_surface_above_0p076 |
| standard_name | n/a |
| step_type | accum |
| comment | Threshold applies to the preceding 3 hours of accumulation. Published every 3 forecast hours from lead 3 hours. Neighborhood probability of 3 hour total snowfall (surface) above 0.076 m. |
Point time series — 2026-08-13T00:00 - 2026-10-12T18:00, sampled lead=3h
| Point | min | mean | max |
|---|---|---|---|
| P1 | 0 | 0 | 0 |
| P2 | 0 | 0 | 0 |
Spatial — init=2026-10-11T06:00, lead=24h (reference not available)
| Source | min | mean | max |
|---|---|---|---|
| Validation | 0 | 0.1824 | 93 |
Temporal — init=2026-10-11T06:00
| Source | min | mean | max |
|---|---|---|---|
| P1 Validation | 0 | 0 | 0 |
| P2 Validation | 0 | 0 | 0 |
Availability — 244 of 244 positions complete
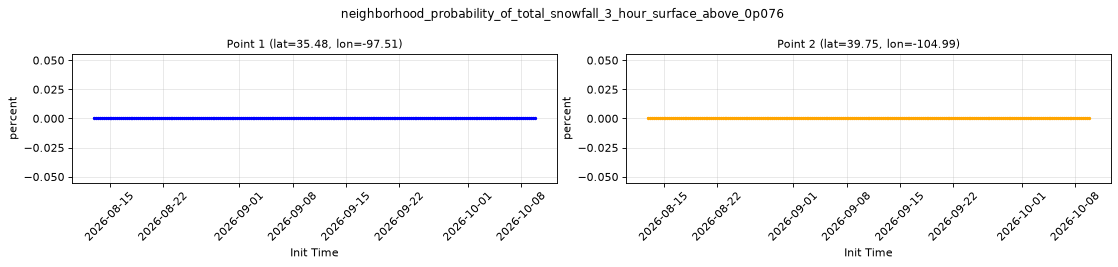


neighborhood_probability_of_total_snowfall_3_hour_surface_above_0p152
Metadata
| Field | Value |
|---|---|
| units | percent |
| long_name | Neighborhood probability of 3 hour total snowfall (surface) above 0.152 m |
| short_name | neighborhood_probability_of_total_snowfall_3_hour_surface_above_0p152 |
| standard_name | n/a |
| step_type | accum |
| comment | Threshold applies to the preceding 3 hours of accumulation. Published every 3 forecast hours from lead 3 hours. Neighborhood probability of 3 hour total snowfall (surface) above 0.152 m. |
Point time series — 2026-08-13T00:00 - 2026-10-12T18:00, sampled lead=3h
| Point | min | mean | max |
|---|---|---|---|
| P1 | 0 | 0 | 0 |
| P2 | 0 | 0 | 0 |
Spatial — init=2026-10-11T06:00, lead=24h (reference not available)
| Source | min | mean | max |
|---|---|---|---|
| Validation | 0 | 0.0008472 | 7 |
Temporal — init=2026-10-11T06:00
| Source | min | mean | max |
|---|---|---|---|
| P1 Validation | 0 | 0 | 0 |
| P2 Validation | 0 | 0 | 0 |
Availability — 244 of 244 positions complete
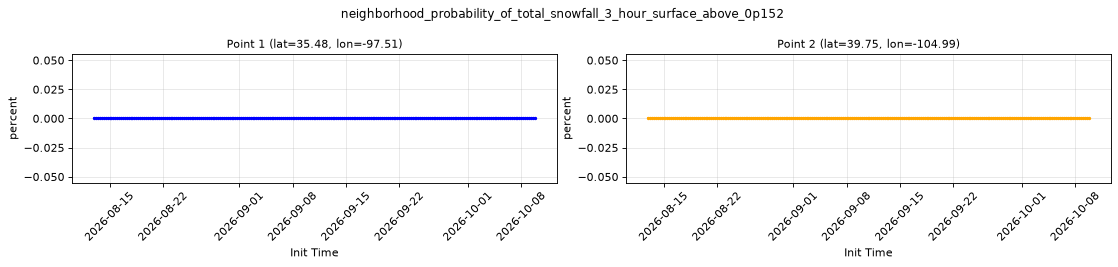
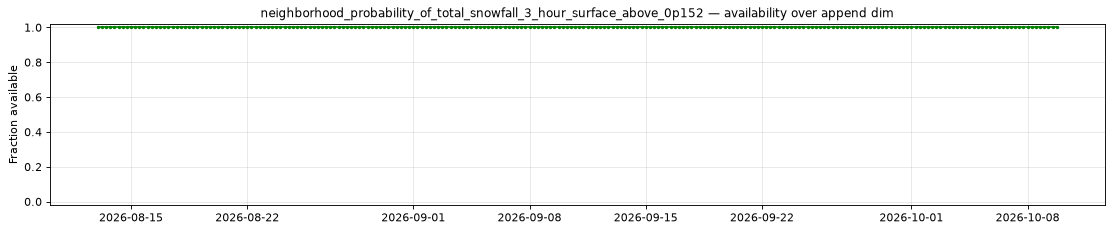
neighborhood_probability_of_total_snowfall_6_hour_surface_above_0p025
Metadata
| Field | Value |
|---|---|
| units | percent |
| long_name | Neighborhood probability of 6 hour total snowfall (surface) above 0.025 m |
| short_name | neighborhood_probability_of_total_snowfall_6_hour_surface_above_0p025 |
| standard_name | n/a |
| step_type | accum |
| comment | Threshold applies to the preceding 6 hours of accumulation. Published every 3 forecast hours from lead 6 hours. Neighborhood probability of 6 hour total snowfall (surface) above 0.025 m. |
Point time series — 2026-08-13T00:00 - 2026-10-12T18:00, sampled lead=6h
| Point | min | mean | max |
|---|---|---|---|
| P1 | 0 | 0 | 0 |
| P2 | 0 | 0.8852 | 34 |
Spatial — init=2026-10-11T06:00, lead=24h (reference not available)
| Source | min | mean | max |
|---|---|---|---|
| Validation | 0 | 1.82 | 100 |
Temporal — init=2026-10-11T06:00
| Source | min | mean | max |
|---|---|---|---|
| P1 Validation | 0 | 0 | 0 |
| P2 Validation | 0 | 3.474 | 33 |
Availability — 244 of 244 positions complete
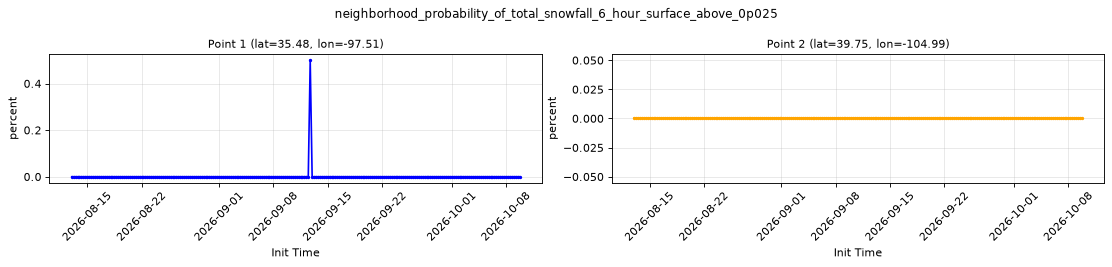
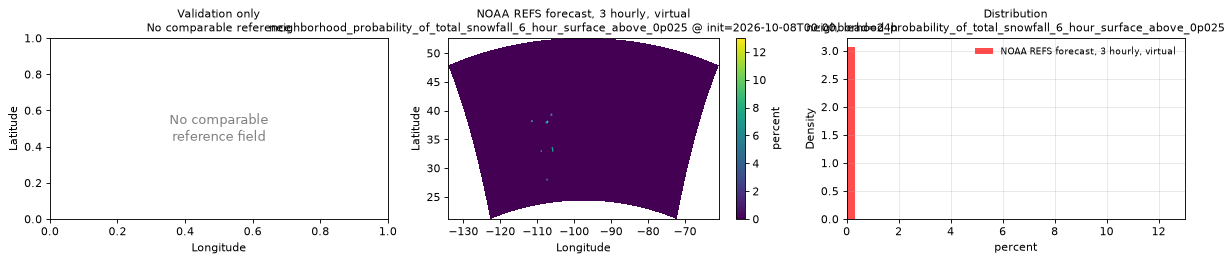


neighborhood_probability_of_total_snowfall_6_hour_surface_above_0p076
Metadata
| Field | Value |
|---|---|
| units | percent |
| long_name | Neighborhood probability of 6 hour total snowfall (surface) above 0.076 m |
| short_name | neighborhood_probability_of_total_snowfall_6_hour_surface_above_0p076 |
| standard_name | n/a |
| step_type | accum |
| comment | Threshold applies to the preceding 6 hours of accumulation. Published every 3 forecast hours from lead 6 hours. Neighborhood probability of 6 hour total snowfall (surface) above 0.076 m. |
Point time series — 2026-08-13T00:00 - 2026-10-12T18:00, sampled lead=6h
| Point | min | mean | max |
|---|---|---|---|
| P1 | 0 | 0 | 0 |
| P2 | 0 | 0.0123 | 3 |
Spatial — init=2026-10-11T06:00, lead=24h (reference not available)
| Source | min | mean | max |
|---|---|---|---|
| Validation | 0 | 0.6447 | 100 |
Temporal — init=2026-10-11T06:00
| Source | min | mean | max |
|---|---|---|---|
| P1 Validation | 0 | 0 | 0 |
| P2 Validation | 0 | 0 | 0 |
Availability — 244 of 244 positions complete


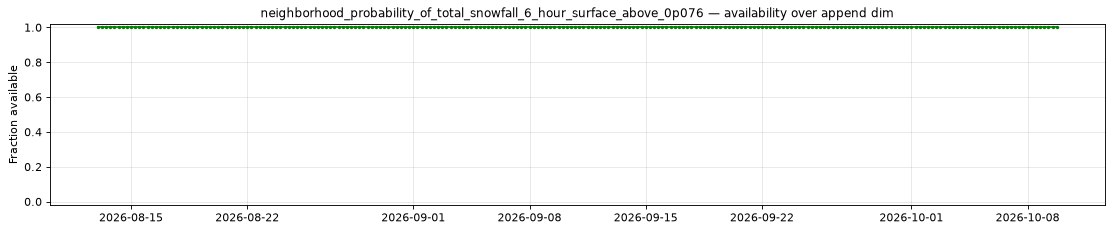
neighborhood_probability_of_total_snowfall_6_hour_surface_above_0p152
Metadata
| Field | Value |
|---|---|
| units | percent |
| long_name | Neighborhood probability of 6 hour total snowfall (surface) above 0.152 m |
| short_name | neighborhood_probability_of_total_snowfall_6_hour_surface_above_0p152 |
| standard_name | n/a |
| step_type | accum |
| comment | Threshold applies to the preceding 6 hours of accumulation. Published every 3 forecast hours from lead 6 hours. Neighborhood probability of 6 hour total snowfall (surface) above 0.152 m. |
Point time series — 2026-08-13T00:00 - 2026-10-12T18:00, sampled lead=6h
| Point | min | mean | max |
|---|---|---|---|
| P1 | 0 | 0 | 0 |
| P2 | 0 | 0 | 0 |
Spatial — init=2026-10-11T06:00, lead=24h (reference not available)
| Source | min | mean | max |
|---|---|---|---|
| Validation | 0 | 0.1424 | 90 |
Temporal — init=2026-10-11T06:00
| Source | min | mean | max |
|---|---|---|---|
| P1 Validation | 0 | 0 | 0 |
| P2 Validation | 0 | 0 | 0 |
Availability — 244 of 244 positions complete
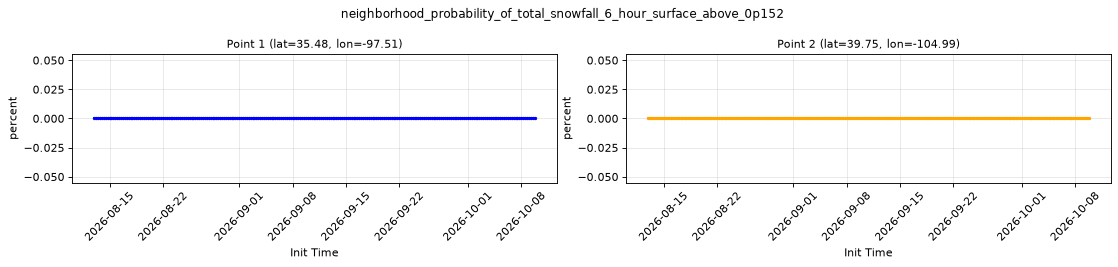

neighborhood_probability_of_total_snowfall_6_hour_surface_above_0p304
Metadata
| Field | Value |
|---|---|
| units | percent |
| long_name | Neighborhood probability of 6 hour total snowfall (surface) above 0.304 m |
| short_name | neighborhood_probability_of_total_snowfall_6_hour_surface_above_0p304 |
| standard_name | n/a |
| step_type | accum |
| comment | Threshold applies to the preceding 6 hours of accumulation. Published every 3 forecast hours from lead 6 hours. Neighborhood probability of 6 hour total snowfall (surface) above 0.304 m. |
Point time series — 2026-08-13T00:00 - 2026-10-12T18:00, sampled lead=6h
| Point | min | mean | max |
|---|---|---|---|
| P1 | 0 | 0 | 0 |
| P2 | 0 | 0 | 0 |
Spatial — init=2026-10-11T06:00, lead=24h (reference not available)
| Source | min | mean | max |
|---|---|---|---|
| Validation | 0 | 0 | 0 |
Temporal — init=2026-10-11T06:00
| Source | min | mean | max |
|---|---|---|---|
| P1 Validation | 0 | 0 | 0 |
| P2 Validation | 0 | 0 | 0 |
Availability — 244 of 244 positions complete


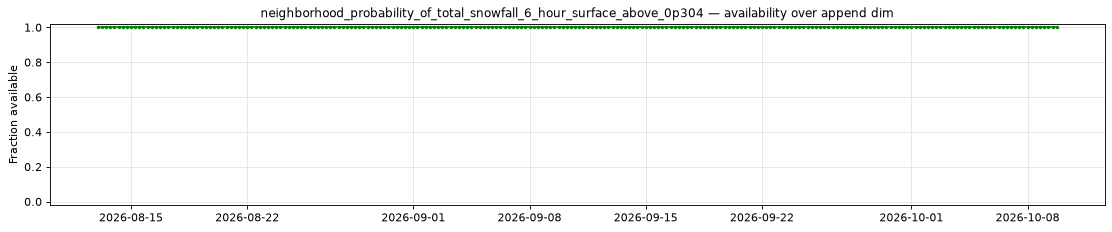
probability_matched_mean_total_precipitation_3_hour_surface
Metadata
| Field | Value |
|---|---|
| units | kg m-2 |
| long_name | Probability-matched mean of total precipitation |
| short_name | probability_matched_mean_total_precipitation_3_hour_surface |
| standard_name | precipitation_amount |
| step_type | accum |
| comment | Accumulated over the preceding 3 hours. Published every 3 forecast hours from lead 3 hours. |
Point time series — 2026-08-13T00:00 - 2026-10-12T18:00, sampled lead=3h
| Point | min | mean | max |
|---|---|---|---|
| P1 | 0 | 1.221 | 54.06 |
| P2 | -0.0001 | 0.1863 | 12.81 |
Spatial — init=2026-10-11T06:00, lead=24h (reference not available)
| Source | min | mean | max |
|---|---|---|---|
| Validation | -0.0625 | 0.556 | 69.27 |
Temporal — init=2026-10-11T06:00
| Source | min | mean | max |
|---|---|---|---|
| P1 Validation | -0.0001 | -4.5e-05 | 0 |
| P2 Validation | -0.0001 | 0.0125 | 0.1251 |
Availability — 244 of 244 positions complete
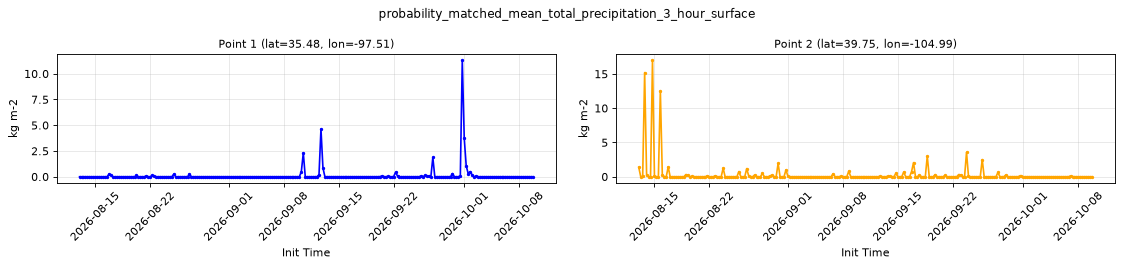
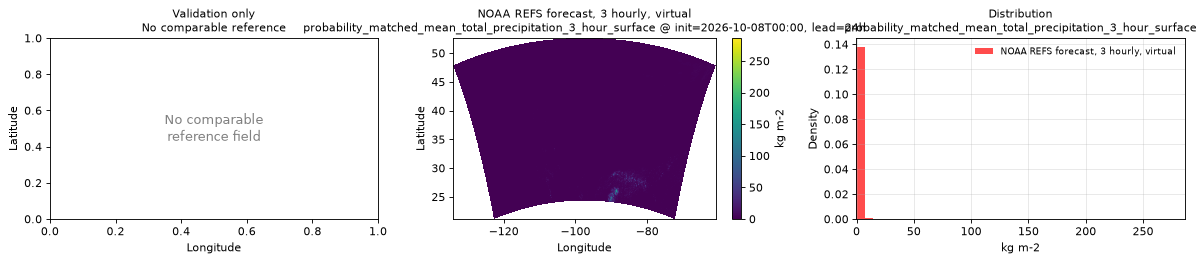
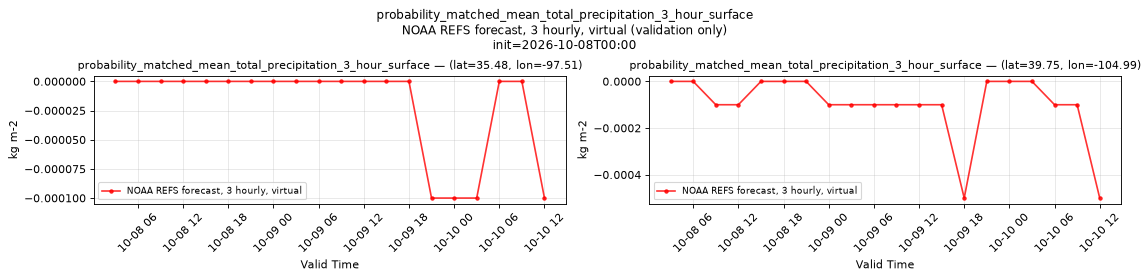
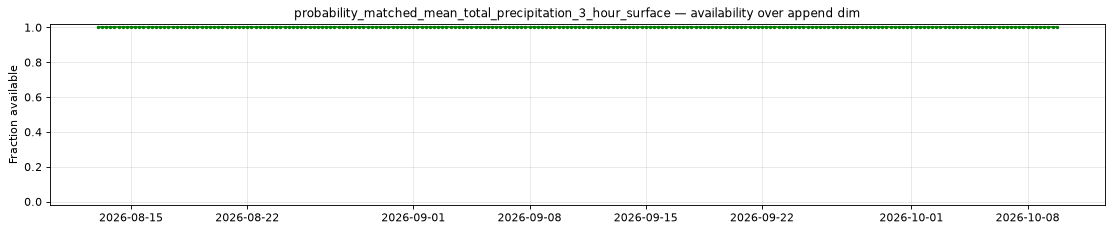
snowfall_water_equivalent_3_hour_surface [statistic=mean]
Metadata
| Field | Value |
|---|---|
| units | kg m-2 |
| long_name | Snowfall water equivalent |
| short_name | sf |
| standard_name | snowfall_amount |
| step_type | accum |
| sampled statistic | statistic=mean |
| comment | Accumulated over the preceding 3 hours. Published every 3 forecast hours from lead 3 hours. |
Point time series — 2026-08-13T00:00 - 2026-10-12T18:00, sampled lead=3h
| Point | min | mean | max |
|---|---|---|---|
| P1 | 0 | 0 | 0 |
| P2 | 0 | 1.197e-05 | 0.00286 |
Spatial — init=2026-10-11T06:00, lead=24h (reference not available)
| Source | min | mean | max |
|---|---|---|---|
| Validation | 0 | 0.02794 | 7.653 |
Temporal — init=2026-10-11T06:00
| Source | min | mean | max |
|---|---|---|---|
| P1 Validation | 0 | 0 | 0 |
| P2 Validation | 0 | 0.0226 | 0.1667 |
Availability — 244 of 244 positions complete
total_precipitation_3_hour_surface [statistic=mean]
Metadata
| Field | Value |
|---|---|
| units | kg m-2 |
| long_name | Total precipitation |
| short_name | tp |
| standard_name | precipitation_amount |
| step_type | accum |
| sampled statistic | statistic=mean |
| comment | Accumulated over the preceding 3 hours. Published every 3 forecast hours from lead 3 hours. |
Point time series — 2026-08-13T00:00 - 2026-10-12T18:00, sampled lead=3h
| Point | min | mean | max |
|---|---|---|---|
| P1 | -1e-05 | 0.9356 | 25.22 |
| P2 | -1e-05 | 0.2528 | 7.622 |
Spatial — init=2026-10-11T06:00, lead=24h (reference not available)
| Source | min | mean | max |
|---|---|---|---|
| Validation | -0.00451 | 0.5578 | 25.94 |
Temporal — init=2026-10-11T06:00
| Source | min | mean | max |
|---|---|---|---|
| P1 Validation | -0.0001 | -3.6e-05 | 0 |
| P2 Validation | -5e-05 | 0.0676 | 0.3542 |
Availability — 244 of 244 positions complete
total_precipitation_6_hour_surface [statistic=mean]
Metadata
| Field | Value |
|---|---|
| units | kg m-2 |
| long_name | Total precipitation |
| short_name | tp |
| standard_name | precipitation_amount |
| step_type | accum |
| sampled statistic | statistic=mean |
| comment | Accumulated over the preceding 6 hours. Published every 3 forecast hours from lead 6 hours. |
Point time series — 2026-08-13T00:00 - 2026-10-12T18:00, sampled lead=6h
| Point | min | mean | max |
|---|---|---|---|
| P1 | -3e-05 | 1.509 | 29.68 |
| P2 | -2e-05 | 0.5381 | 8.19 |
Spatial — init=2026-10-11T06:00, lead=24h (reference not available)
| Source | min | mean | max |
|---|---|---|---|
| Validation | -0.00454 | 1.092 | 32.17 |
Temporal — init=2026-10-11T06:00
| Source | min | mean | max |
|---|---|---|---|
| P1 Validation | -0.0002 | -7.158e-05 | 1e-05 |
| P2 Validation | -9e-05 | 0.1141 | 0.6771 |
Availability — 244 of 244 positions complete
total_snowfall_12_hour_surface [statistic=mean]
Metadata
| Field | Value |
|---|---|
| units | m |
| long_name | Total snowfall |
| short_name | asnow |
| standard_name | thickness_of_snowfall_amount |
| step_type | accum |
| sampled statistic | statistic=mean |
| comment | Accumulated over the preceding 12 hours. Published every 3 forecast hours from lead 12 hours. |
Point time series — 2026-08-13T00:00 - 2026-10-12T18:00, sampled lead=12h
| Point | min | mean | max |
|---|---|---|---|
| P1 | 0 | 0 | 0 |
| P2 | 0 | 5.176e-05 | 0.00358 |
Spatial — init=2026-10-11T06:00, lead=24h (reference not available)
| Source | min | mean | max |
|---|---|---|---|
| Validation | -1e-05 | 0.001085 | 0.2767 |
Temporal — init=2026-10-11T06:00
| Source | min | mean | max |
|---|---|---|---|
| P1 Validation | 0 | 0 | 0 |
| P2 Validation | 0 | 0.0004135 | 0.00358 |
Availability — 244 of 244 positions complete
total_snowfall_24_hour_surface [statistic=mean]
Metadata
| Field | Value |
|---|---|
| units | m |
| long_name | Total snowfall |
| short_name | asnow |
| standard_name | thickness_of_snowfall_amount |
| step_type | accum |
| sampled statistic | statistic=mean |
| comment | Accumulated over the preceding 24 hours. Published every 3 forecast hours from lead 24 hours. |
Point time series — 2026-08-13T00:00 - 2026-10-12T18:00, sampled lead=24h
| Point | min | mean | max |
|---|---|---|---|
| P1 | 0 | 0 | 0 |
| P2 | 0 | 0.000144 | 0.00444 |
Spatial — init=2026-10-11T06:00, lead=24h (reference not available)
| Source | min | mean | max |
|---|---|---|---|
| Validation | -1e-05 | 0.002163 | 0.5268 |
Temporal — init=2026-10-11T06:00
| Source | min | mean | max |
|---|---|---|---|
| P1 Validation | 0 | 0 | 0 |
| P2 Validation | 0 | 0.0005423 | 0.00358 |
Availability — 244 of 244 positions complete
total_snowfall_3_hour_surface [statistic=mean]
Metadata
| Field | Value |
|---|---|
| units | m |
| long_name | Total snowfall |
| short_name | asnow |
| standard_name | thickness_of_snowfall_amount |
| step_type | accum |
| sampled statistic | statistic=mean |
| comment | Accumulated over the preceding 3 hours. Published every 3 forecast hours from lead 3 hours. |
Point time series — 2026-08-13T00:00 - 2026-10-12T18:00, sampled lead=3h
| Point | min | mean | max |
|---|---|---|---|
| P1 | 0 | 0 | 0 |
| P2 | 0 | 8.484e-06 | 0.00128 |
Spatial — init=2026-10-11T06:00, lead=24h (reference not available)
| Source | min | mean | max |
|---|---|---|---|
| Validation | 0 | 0.0003755 | 0.0869 |
Temporal — init=2026-10-11T06:00
| Source | min | mean | max |
|---|---|---|---|
| P1 Validation | 0 | 0 | 0 |
| P2 Validation | 0 | 0.0002365 | 0.00199 |
Availability — 244 of 244 positions complete
total_snowfall_6_hour_surface [statistic=mean]
Metadata
| Field | Value |
|---|---|
| units | m |
| long_name | Total snowfall |
| short_name | asnow |
| standard_name | thickness_of_snowfall_amount |
| step_type | accum |
| sampled statistic | statistic=mean |
| comment | Accumulated over the preceding 6 hours. Published every 3 forecast hours from lead 6 hours. |
Point time series — 2026-08-13T00:00 - 2026-10-12T18:00, sampled lead=6h
| Point | min | mean | max |
|---|---|---|---|
| P1 | 0 | 0 | 0 |
| P2 | 0 | 2.303e-05 | 0.00232 |
Spatial — init=2026-10-11T06:00, lead=24h (reference not available)
| Source | min | mean | max |
|---|---|---|---|
| Validation | -1e-05 | 0.0006662 | 0.1692 |
Temporal — init=2026-10-11T06:00
| Source | min | mean | max |
|---|---|---|---|
| P1 Validation | 0 | 0 | 0 |
| P2 Validation | 0 | 0.0003442 | 0.00355 |
Availability — 244 of 244 positions complete