NOAA MRMS CONUS analysis, hourly validation report
This dataset validation report plots a sample of values from the NOAA MRMS CONUS analysis, hourly dataset over time and across space, comparing where possible to a previously validated reference dataset. It also reports the quantity of unavailable values and their associated timestamps. These analyses are one layer of a multi-layered dataset validation process we perform at dynamical.org and also provide users a preview of the dataset contents.
Report generation start time: 2026-07-21T04:19:17 UTC
Summary
This dataset has been reviewed and is ready for use. All 6 variables were checked against the full validation checklist (map geometry, value distributions, comparison to a reference product, full-period value time series, and availability), and every availability gap was verified directly against the upstream NOAA and Iowa State Mesonet archives. MRMS is an operational product whose source system has evolved over the archive's 11+ years: new variables were added over time, and scattered unavailable hours — particularly earlier in the archive — are expected.
What looks good
- Maps are correctly oriented and georeferenced across all variables (CONUS landmarks in place, extent matches the declared 20→55°N, -130→-60°E, 0.01° grid).
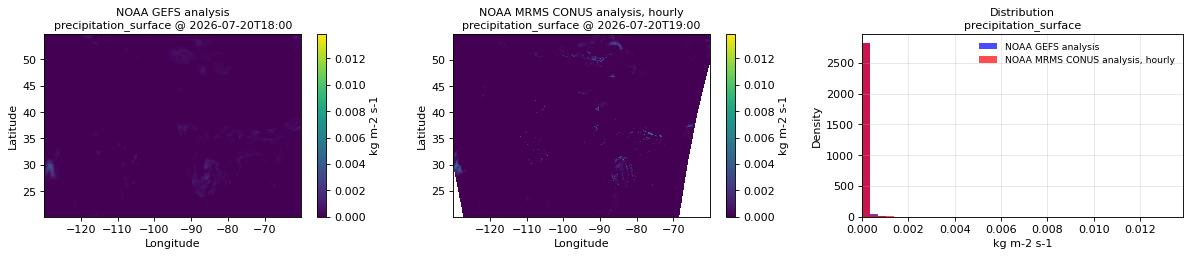
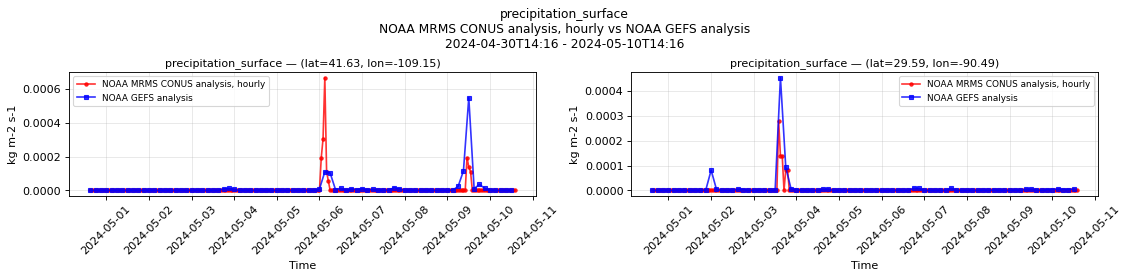
precipitation_surfaceagrees well with the GEFS analysis reference: overlapping value distributions and correlated precipitation event timing at both validation points, with MRMS resolving sharper convective peaks than the coarser model reference, as expected.- Dry hours are stored as exactly 0, so selections like
values == 0andvalues > 0behave as expected. - Radar and flash-flood-guidance coverage footprints match their product definitions, precipitation-type codes take exactly the documented flag values, and diurnal/seasonal structure is physically plausible at both validation points over the full 11.7-year record.
- No quantization banding, no unit-scale mismatches, no sentinel values leaking into the data, and no unexplained drifts or step changes across the full period.
Review notes
Variable additions
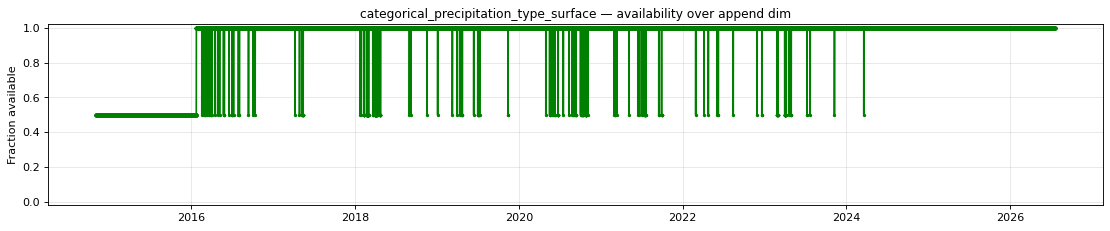
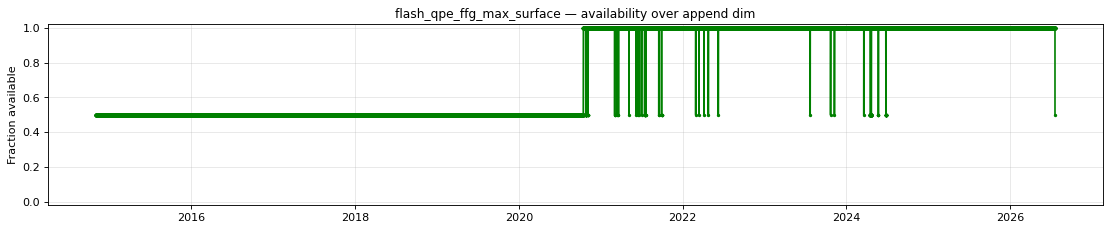
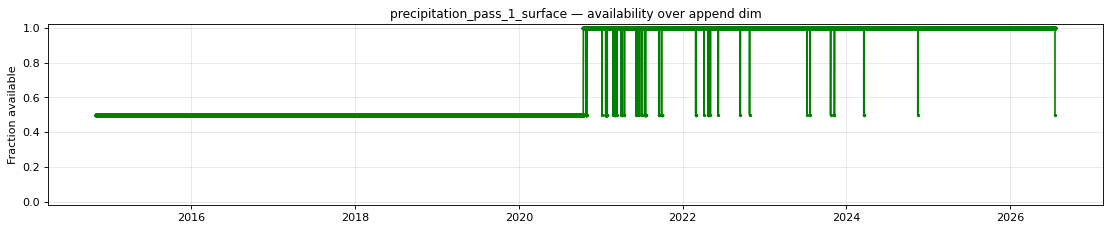
precipitation_pass_1_surface,precipitation_pass_2_surface, andflash_qpe_ffg_max_surfacebegin 2020-10-14T20:00Z, when the MRMS v12 upgrade introduced these products; earlier hours are NaN.categorical_precipitation_type_surfacebegins 2016-01-22T20:00Z: the Iowa State Mesonet archive, the only source for this period, does not carry the precipitation-type product before that hour.
Intermittent gaps — each sampled gap was verified absent from the upstream NOAA and Iowa State Mesonet archives; none are backfillable.
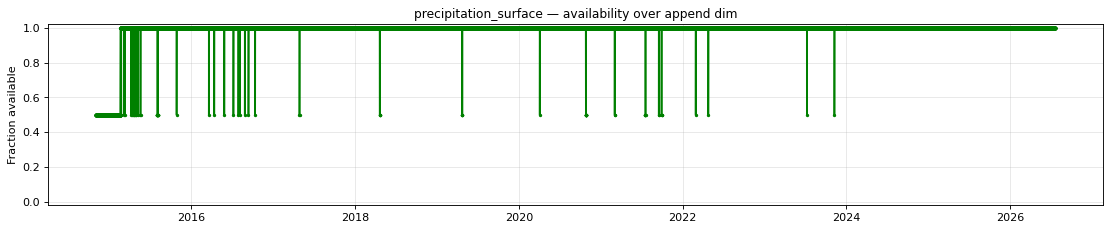
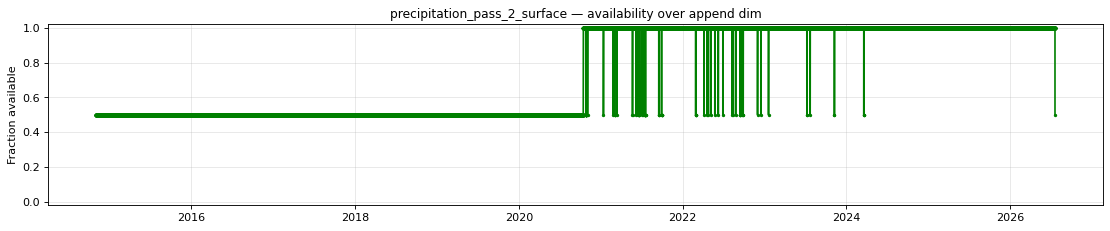
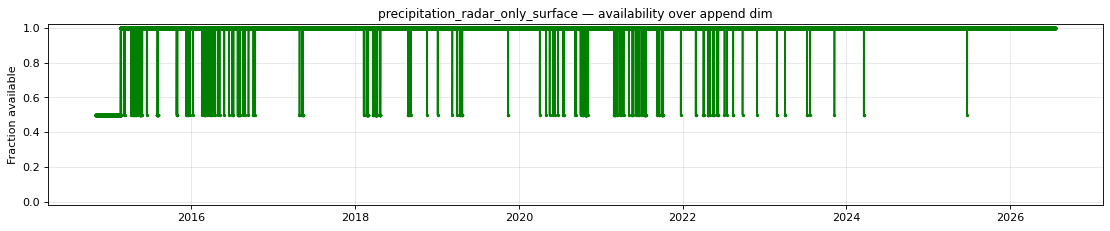
precipitation_surfaceandprecipitation_radar_only_surfacehave very low coverage from November 2014 through February 2015: the gauge-corrected product is absent upstream in this period, and the radar-only files that do exist contain valid data for under 5% of the grid until late February 2015.categorical_precipitation_type_surfaceis missing ~2,300 scattered hours from February–May 2016 and ~330 more after mid-2016.precipitation_pass_1_surface(~116 hours) andprecipitation_pass_2_surface(~85 hours) have scattered upstream product outages after their 2020 launch;precipitation_surfaceretains data at most of those hours via its radar-only fallback.flash_qpe_ffg_max_surfaceis missing ~247 hours after its launch, dominated by two upstream outages: 2024-04-16 → 2024-04-22 (~144 hours) and 2024-06-26 → 2024-06-27 (~26 hours).
New data latency
- The most recent 1–2 hours of
precipitation_pass_1_surface,precipitation_pass_2_surface, andflash_qpe_ffg_max_surfaceare NaN until their gauge-delayed source files are published (~60–75 minutes after each hour); the hourly update fills them as they arrive. - The most recent hours of
precipitation_surfacemay temporarily hold radar-only data; the hourly update upgrades them to the pass 2 multi-sensor product within ~3 hours.
Spatial coverage
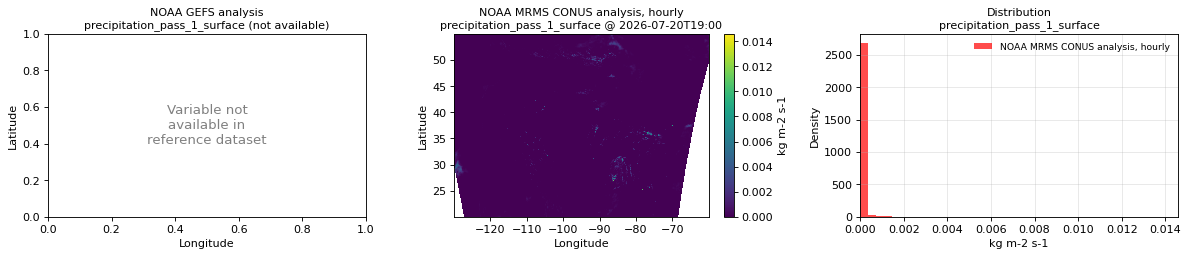
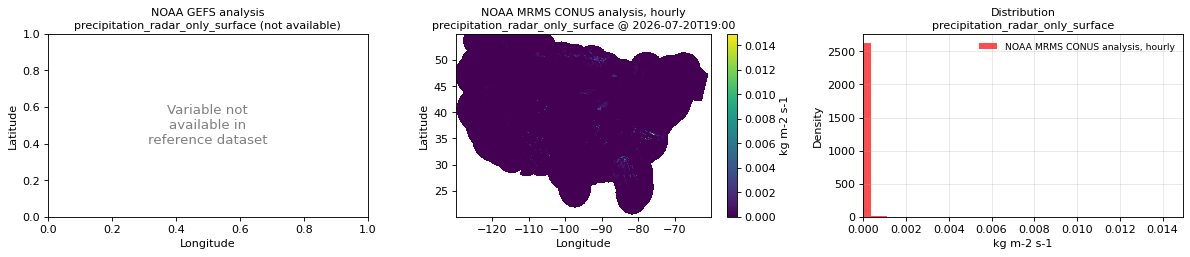
precipitation_radar_only_surfaceis NaN outside radar coverage (~34% of the grid at any time), andflash_qpe_ffg_max_surfaceis NaN outside combined radar and flash-flood-guidance coverage (~64%).categorical_precipitation_type_surfacemarks out-of-coverage cells with its-3no-coverage flag value rather than NaN. The multi-sensor variables (precipitation_surface, pass 1, pass 2) cover essentially the full grid. See each variable's spatial plot below for its coverage footprint.
Datasets
| Role | Name | ID | Version | URL |
|---|---|---|---|---|
| Validation | NOAA MRMS CONUS analysis, hourly | noaa-mrms-conus-analysis-hourly |
v0.3.0 |
s3://us-west-2.opendata.source.coop/dynamical/noaa-mrms-conus-analysis-hourly/v0.3.0.zarr |
| Reference | NOAA GEFS analysis | noaa-gefs-analysis |
0.1.2 |
s3://dynamical-noaa-gefs/noaa-gefs-analysis/v0.1.2.icechunk/ |
Run parameters
| Parameter | Value |
|---|---|
| Validation dataset type | analysis |
| Validation time range | time 2014-11-01T00:00 → 2026-07-21T04:00 |
| Reference time range | time 2000-01-01T00:00 → 2026-07-21T00:00 |
| Point 1 | lat=41.6250, lon=-109.1450 |
| Point 2 | lat=29.5850, lon=-90.4850 |
| Spatial comparison time | 2026-07-20T19:00 (reference at 2026-07-20T18:00) |
| Timeseries period | 2024-04-30T14:16 - 2024-05-10T14:16 |
| Vertical level | middle level per vertical dim |
Availability
The plot below shows the availability of each variable over time — light red marks unavailable data, dark green marks present data.
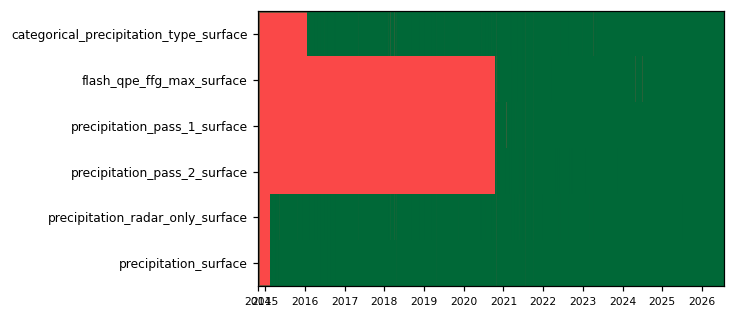
| Variable | Complete positions | Incomplete % | First incomplete | Last incomplete |
|---|---|---|---|---|
categorical_precipitation_type_surface |
91633/102725 | 10.80% | 2014-11-01T00:00 | 2024-03-19T18:00 |
flash_qpe_ffg_max_surface |
50279/102725 | 51.05% | 2014-11-01T00:00 | 2026-07-21T04:00 |
precipitation_pass_1_surface |
50412/102725 | 50.93% | 2014-11-01T00:00 | 2026-07-21T04:00 |
precipitation_pass_2_surface |
50443/102725 | 50.90% | 2014-11-01T00:00 | 2026-07-21T04:00 |
precipitation_radar_only_surface |
99799/102725 | 2.85% | 2014-11-01T00:00 | 2025-06-24T05:00 |
precipitation_surface |
100015/102725 | 2.64% | 2014-11-01T00:00 | 2023-11-09T19:00 |
- Unavailable timestamps:
unavailable_timestamps.txt
Per-variable details
categorical_precipitation_type_surface
Metadata
| Field | Value |
|---|---|
| units | 1 |
| long_name | Precipitation type |
| short_name | ptype |
| standard_name | n/a |
| step_type | instant |
| flag_values | -3, 0, 1, 3, 6, 7, 10, 91, 96 |
| flag_meanings | no_coverage no_precipitation warm_stratiform_rain snow convective_rain rain_mixed_with_hail cold_stratiform_rain tropical_stratiform_rain_mix tropical_convective_rain_mix |
| comment | Surface precipitation type flag. -3=no coverage, 0=no precipitation, 1=warm stratiform rain, 3=snow, 6=convective rain, 7=rain mixed with hail, 10=cold stratiform rain, 91=tropical/stratiform rain mix, 96=tropical/convective rain mix. |
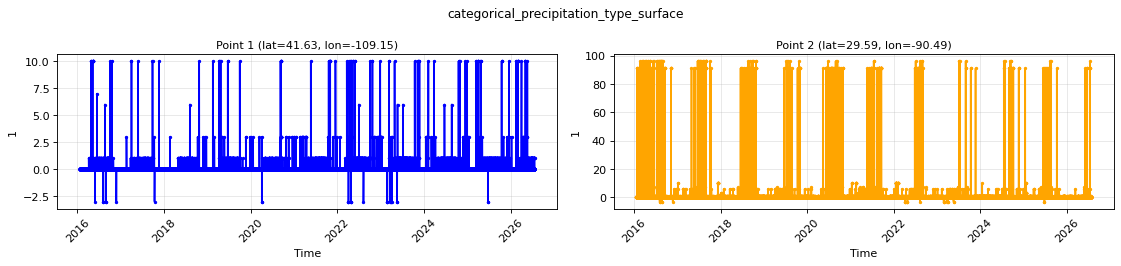
Point time series — 2014-11-01T00:00 - 2026-07-21T04:00
| Point | min | mean | max |
|---|---|---|---|
| P1 | -3 | 0.03423 | 10 |
| P2 | -3 | 0.4536 | 96 |
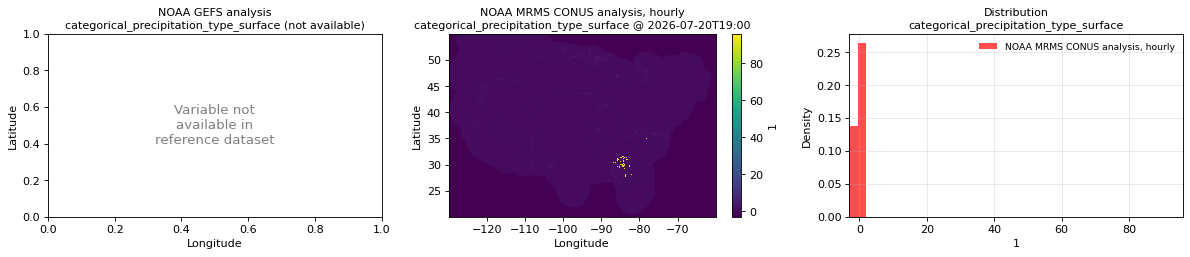
Spatial — 2026-07-20T19:00 (reference not available)
| Source | min | mean | max |
|---|---|---|---|
| Validation | -3 | -0.9114 | 96 |
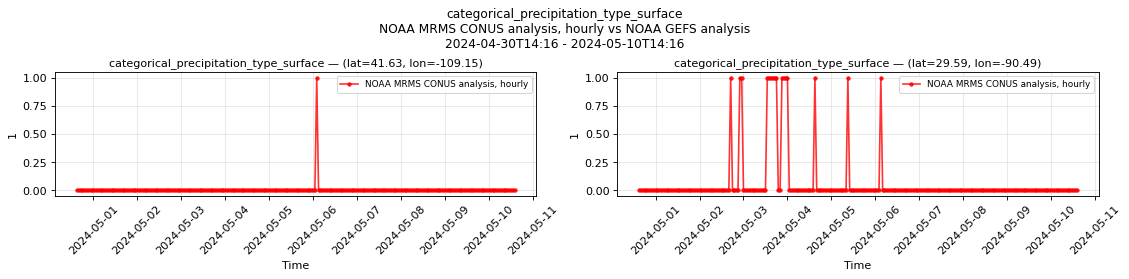
Temporal — 2024-04-30T14:16 - 2024-05-10T14:16
| Source | min | mean | max |
|---|---|---|---|
| P1 Validation | 0 | 0.004167 | 1 |
| P2 Validation | 0 | 0.06667 | 1 |
Availability — 91633 of 102725 positions complete (incomplete 2014-11-01T00:00 → 2024-03-19T18:00); nulls P1 11092/102725, P2 11092/102725
flash_qpe_ffg_max_surface
Metadata
| Field | Value |
|---|---|
| units | percent |
| long_name | FLASH QPE-to-FFG percentage maximum |
| short_name | FLASH_QPE_FFGMAX |
| standard_name | n/a |
| step_type | instant |
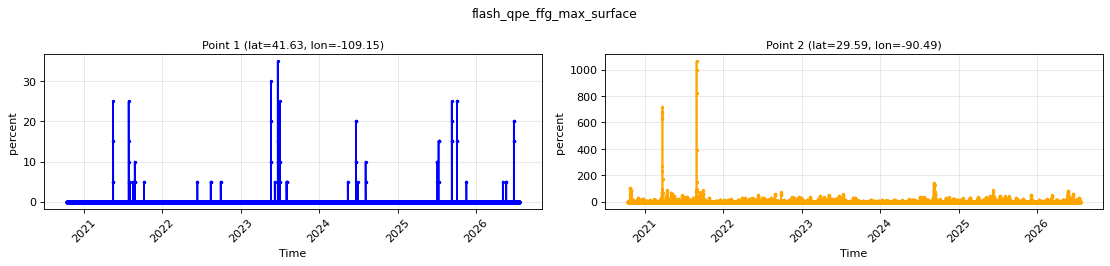
| comment | Maximum percentage of Quantitative Precipitation Estimate (QPE) to Flash Flood Guidance (FFG) from the FLASH system. Percentage where values > 100 indicate QPE exceeds FFG. NaN outside the area the FLASH system covers. Available from October 2020 onward. |
Point time series — 2014-11-01T00:00 - 2026-07-21T04:00
| Point | min | mean | max |
|---|---|---|---|
| P1 | -0 | 0.02337 | 35 |
| P2 | -0 | 1.11 | 1064 |
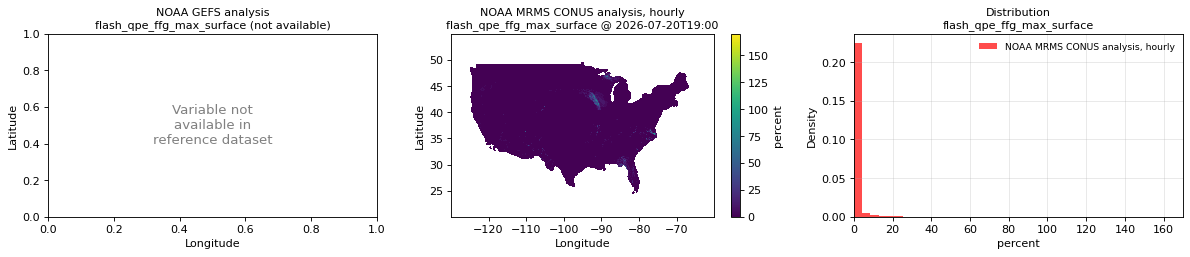
Spatial — 2026-07-20T19:00 (reference not available)
| Source | min | mean | max |
|---|---|---|---|
| Validation | -0 | 0.5325 | 170 |
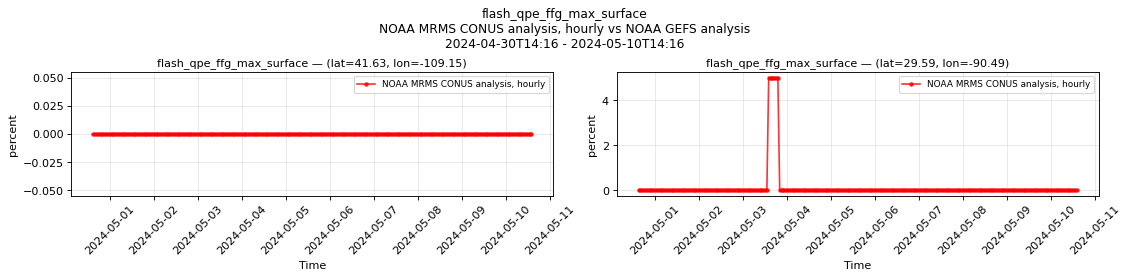
Temporal — 2024-04-30T14:16 - 2024-05-10T14:16
| Source | min | mean | max |
|---|---|---|---|
| P1 Validation | -0 | 0 | -0 |
| P2 Validation | -0 | 0.125 | 5 |
Availability — 50279 of 102725 positions complete (incomplete 2014-11-01T00:00 → 2026-07-21T04:00); nulls P1 52446/102725, P2 52446/102725
precipitation_pass_1_surface
Metadata
| Field | Value |
|---|---|
| units | kg m-2 s-1 |
| long_name | Precipitation rate |
| short_name | prate |
| standard_name | precipitation_flux |
| step_type | avg |
| comment | Average precipitation rate over the previous hour, pass 1 (lower latency, fewer gauges). Derived from MultiSensor_QPE_01H_Pass1. Available from October 2020 onward. Units equivalent to mm/s. |
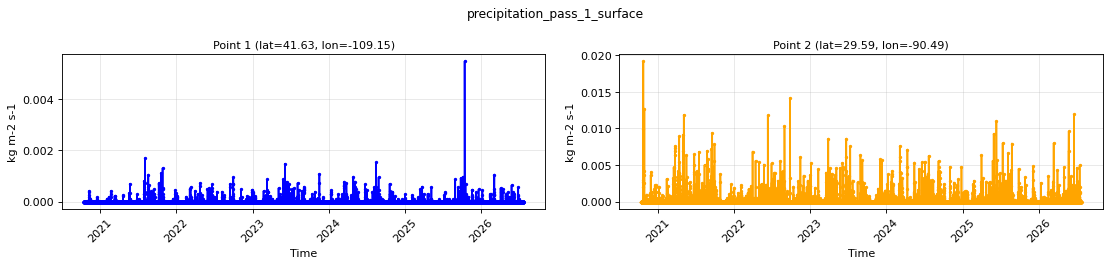
Point time series — 2014-11-01T00:00 - 2026-07-21T04:00
| Point | min | mean | max |
|---|---|---|---|
| P1 | 0 | 3.013e-06 | 0.005463 |
| P2 | 0 | 4.781e-05 | 0.01917 |
Spatial — 2026-07-20T19:00 (reference not available)
| Source | min | mean | max |
|---|---|---|---|
| Validation | 0 | 3.297e-05 | 0.01459 |
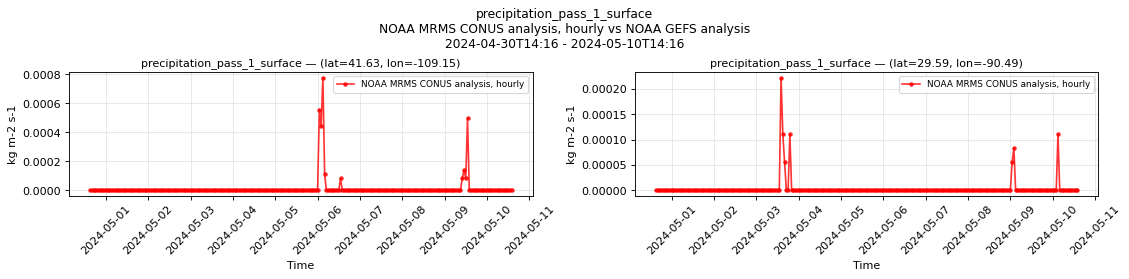
Temporal — 2024-04-30T14:16 - 2024-05-10T14:16
| Source | min | mean | max |
|---|---|---|---|
| P1 Validation | 0 | 1.158e-05 | 0.0007782 |
| P2 Validation | 0 | 3.125e-06 | 0.0002222 |
Availability — 50412 of 102725 positions complete (incomplete 2014-11-01T00:00 → 2026-07-21T04:00); nulls P1 52313/102725, P2 52313/102725
precipitation_pass_2_surface
Metadata
| Field | Value |
|---|---|
| units | kg m-2 s-1 |
| long_name | Precipitation rate |
| short_name | prate |
| standard_name | precipitation_flux |
| step_type | avg |
| comment | Average precipitation rate over the previous hour, pass 2 (higher latency, more gauges). Derived from MultiSensor_QPE_01H_Pass2. Available from October 2020 onward. Units equivalent to mm/s. |
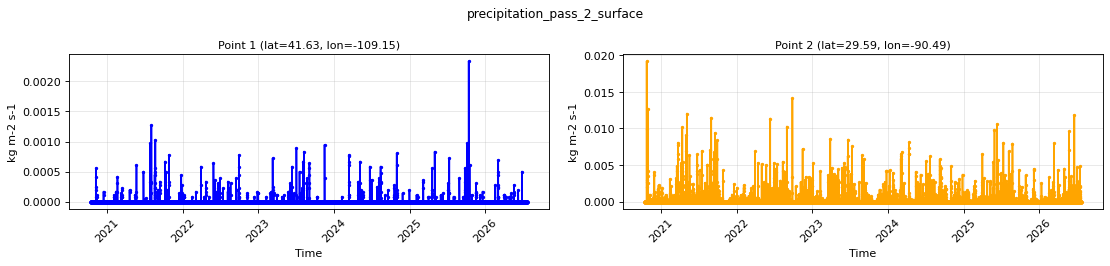
Point time series — 2014-11-01T00:00 - 2026-07-21T04:00
| Point | min | mean | max |
|---|---|---|---|
| P1 | 0 | 1.501e-06 | 0.002335 |
| P2 | 0 | 4.724e-05 | 0.01917 |
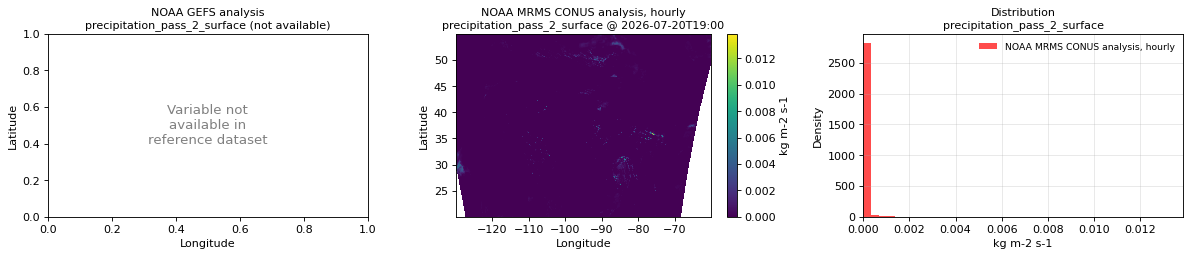
Spatial — 2026-07-20T19:00 (reference not available)
| Source | min | mean | max |
|---|---|---|---|
| Validation | 0 | 3.061e-05 | 0.01385 |
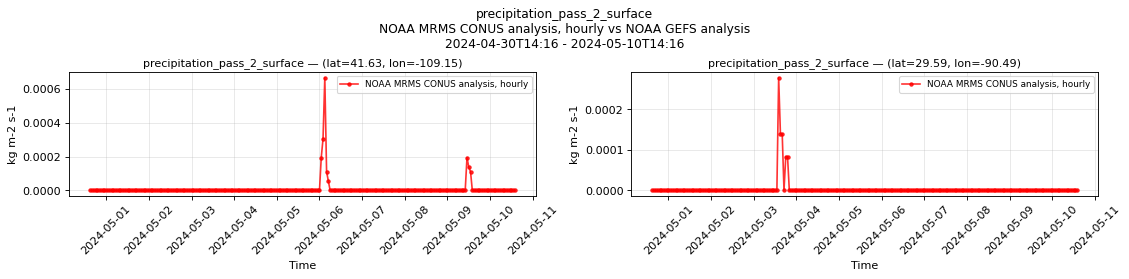
Temporal — 2024-04-30T14:16 - 2024-05-10T14:16
| Source | min | mean | max |
|---|---|---|---|
| P1 Validation | 0 | 7.412e-06 | 0.0006676 |
| P2 Validation | 0 | 3.016e-06 | 0.0002785 |
Availability — 50443 of 102725 positions complete (incomplete 2014-11-01T00:00 → 2026-07-21T04:00); nulls P1 52282/102725, P2 52282/102725
precipitation_radar_only_surface
Metadata
| Field | Value |
|---|---|
| units | kg m-2 s-1 |
| long_name | Precipitation rate from radar |
| short_name | rdpr |
| standard_name | precipitation_flux |
| step_type | avg |
| comment | Average radar-only precipitation rate over the previous hour (no gauge correction). Derived from RadarOnly_QPE_01H. Units equivalent to mm/s. |
Point time series — 2014-11-01T00:00 - 2026-07-21T04:00
| Point | min | mean | max |
|---|---|---|---|
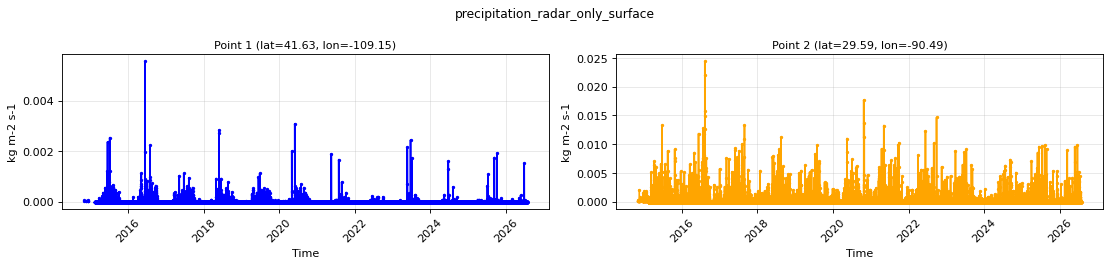
| P1 | 0 | 2.705e-06 | 0.005554 |
| P2 | 0 | 5.46e-05 | 0.02441 |
Spatial — 2026-07-20T19:00 (reference not available)
| Source | min | mean | max |
|---|---|---|---|
| Validation | 0 | 2.487e-05 | 0.01495 |
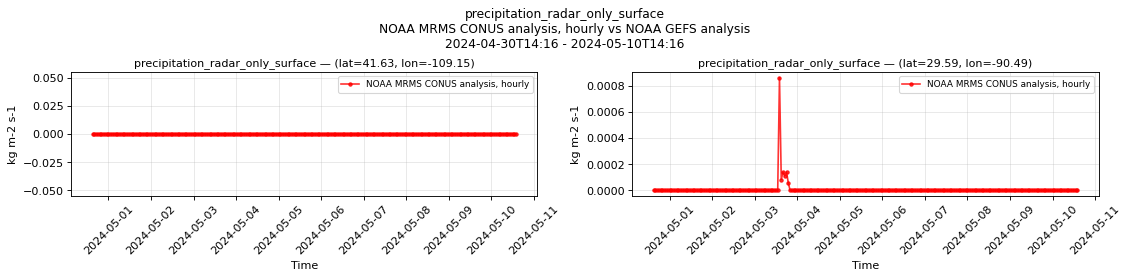
Temporal — 2024-04-30T14:16 - 2024-05-10T14:16
| Source | min | mean | max |
|---|---|---|---|
| P1 Validation | 0 | 0 | 0 |
| P2 Validation | 0 | 5.795e-06 | 0.0008621 |
Availability — 99799 of 102725 positions complete (incomplete 2014-11-01T00:00 → 2025-06-24T05:00); nulls P1 2918/102725, P2 2745/102725
precipitation_surface
Metadata
| Field | Value |
|---|---|
| units | kg m-2 s-1 |
| long_name | Precipitation rate |
| short_name | prate |
| standard_name | precipitation_flux |
| step_type | avg |
| comment | Average precipitation rate over the previous hour. Derived from MultiSensor_QPE_01H_Pass2 from October 2020, GaugeCorr_QPE_01H before. If primary product is unavailable, falls back to MultiSensor_QPE_01H_Pass1 and then RadarOnly_QPE_01H. Units equivalent to mm/s. |
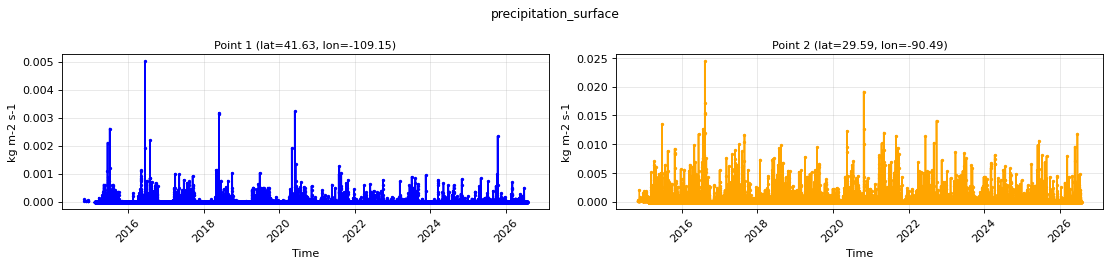
Point time series — 2014-11-01T00:00 - 2026-07-21T04:00
| Point | min | mean | max |
|---|---|---|---|
| P1 | 0 | 3.252e-06 | 0.005005 |
| P2 | 0 | 5.412e-05 | 0.02441 |
Spatial — 2026-07-20T19:00 (reference at 2026-07-20T18:00)
| Source | min | mean | max |
|---|---|---|---|
| Validation | 0 | 3.061e-05 | 0.01385 |
| Reference | 0 | 3.14e-05 | 0.003326 |
Temporal — 2024-04-30T14:16 - 2024-05-10T14:16
| Source | min | mean | max |
|---|---|---|---|
| P1 Validation | 0 | 7.412e-06 | 0.0006676 |
| P1 Reference | 0 | 1.352e-05 | 0.0005493 |
| P2 Validation | 0 | 3.016e-06 | 0.0002785 |
| P2 Reference | 0 | 9.134e-06 | 0.0004539 |
Availability — 100015 of 102725 positions complete (incomplete 2014-11-01T00:00 → 2023-11-09T19:00); nulls P1 2702/102725, P2 2529/102725