Google WeatherNext 3 forecast, 48 hour, 0.05 degree, virtual validation report
This dataset validation report plots a sample of values from the Google WeatherNext 3 forecast, 48 hour, 0.05 degree, virtual dataset over time and across space, comparing where possible to a previously validated reference dataset. It also reports the quantity of unavailable values and their associated timestamps. These analyses are one layer of a multi-layered dataset validation process we perform at dynamical.org and also provide users a preview of the dataset contents.
Report generation start time: 2026-10-31T19:58:32 UTC
Summary
This dataset has been reviewed and is ready for use.
What looks good
- Both variables were available at all 48 scanned initializations. The sampled decode check covered 20 of 48 initialization regions and five leads, reporting 200 successfully decoded references.
- The plotted fields show consistent geographic orientation and plausible units and ranges.
- Trained on point-location station data, this distinct high-resolution model head predicts 0.05° data covering the globe, including over ocean. It is not 0.1° data interpolated to 0.05°.
Review notes
- Longitudes use the 0–360 convention, and the horizontal dimensions are named
yandx.yholds latitude ascending from south to north andxholds longitude. For example, 100°W is x=260 in this dataset.
Datasets
| Role | Name | ID | Version | URL |
|---|---|---|---|---|
| Validation | Google WeatherNext 3 forecast, 48 hour, 0.05 degree, virtual | google-weathernext3-forecast-48-hour-0-05-degree-virtual |
v0.1.0 |
https://google-weathernext3.r2.dynamical.org/google-weathernext3-forecast-48-hour-0-05-degree-virtual/v0.1.0.icechunk |
| Reference | NOAA GFS analysis | noaa-gfs-analysis |
0.1.0 |
s3://dynamical-noaa-gfs/noaa-gfs-analysis/v0.1.0.icechunk |
Run parameters
| Parameter | Value |
|---|---|
| Validation dataset type | forecast |
| Validation time range | init_time 2026-06-30T00:00 → 2026-07-01T23:00 |
| Reference time range | time 2021-05-01T00:00 → 2026-10-31T17:00 |
| Point 1 | lat=39.7500, lon=255.0000 |
| Point 2 | lat=25.0000, lon=300.0000 |
| Spatial comparison time | init=2026-07-01T00:00, lead=24h (reference at 2026-07-02T00:00) |
| Timeseries period | init=2026-07-01T00:00 |
| Statistic | mean when declared, otherwise standard_deviation |
| Store type | virtual — availability manifest-probed; value series sampled |
Availability
The plot below shows the availability of each variable over time — light red marks unavailable data, dark green marks present data.
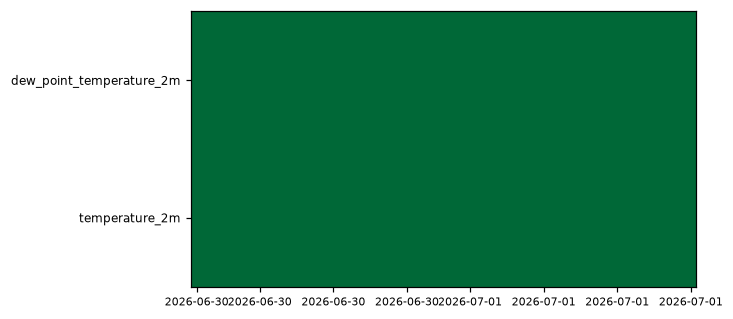
Every variable is complete at every scanned position.
Decode health
200 references decoded successfully, sampled across 20 of 48 append-dim regions, 5 leads and up to 6 present levels per group variable.
Per-variable details
dew_point_temperature_2m [statistic=mean]
Metadata
| Field | Value |
|---|---|
| units | degree_Celsius |
| long_name | 2 metre dewpoint temperature |
| short_name | 2d |
| standard_name | dew_point_temperature |
| step_type | instant |
| sampled statistic | statistic=mean |
| comment | WeatherNext 3's station-trained head, defined everywhere. |
Point time series — 2026-06-30T00:00 - 2026-07-01T23:00, sampled lead=2h
| Point | min | mean | max |
|---|---|---|---|
| P1 | -2.64 | 3.929 | 9.305 |
| P2 | 22.37 | 23.28 | 23.72 |
Spatial — init=2026-07-01T00:00, lead=24h (reference not available)
| Source | min | mean | max |
|---|---|---|---|
| Validation | -70.11 | 4.337 | 29.89 |
Temporal — init=2026-07-01T00:00
| Source | min | mean | max |
|---|---|---|---|
| P1 Validation | 1.76 | 6.78 | 10.74 |
| P2 Validation | 22.37 | 22.96 | 23.38 |
Availability — 48 of 48 positions complete
temperature_2m [statistic=mean]
Metadata
| Field | Value |
|---|---|
| units | degree_Celsius |
| long_name | 2 metre temperature |
| short_name | 2t |
| standard_name | air_temperature |
| step_type | instant |
| sampled statistic | statistic=mean |
| comment | WeatherNext 3's station-trained head, defined everywhere. |
Point time series — 2026-06-30T00:00 - 2026-07-01T23:00, sampled lead=2h
| Point | min | mean | max |
|---|---|---|---|
| P1 | 14.72 | 24.03 | 32.54 |
| P2 | 26.81 | 27.73 | 28.46 |
Spatial — init=2026-07-01T00:00, lead=24h (reference at 2026-07-02T00:00)
| Source | min | mean | max |
|---|---|---|---|
| Validation | -70.46 | 8.361 | 39.22 |
| Reference | -72 | 8.511 | 40.25 |
Temporal — init=2026-07-01T00:00
| Source | min | mean | max |
|---|---|---|---|
| P1 Validation | 14.4 | 22.94 | 31.39 |
| P1 Reference | 17 | 24.83 | 34 |
| P2 Validation | 27.43 | 28.09 | 28.67 |
| P2 Reference | 26.5 | 27.06 | 27.38 |
Availability — 48 of 48 positions complete