Google WeatherNext 3 forecast, 15 day, 0.1 degree, virtual validation report
This dataset validation report plots a sample of values from the Google WeatherNext 3 forecast, 15 day, 0.1 degree, virtual dataset over time and across space, comparing where possible to a previously validated reference dataset. It also reports the quantity of unavailable values and their associated timestamps. These analyses are one layer of a multi-layered dataset validation process we perform at dynamical.org and also provide users a preview of the dataset contents.
Report generation start time: 2026-10-31T22:32:07 UTC
Summary
This dataset has been reviewed and is ready for use.
What looks good
- All 19 variables were available at all 8 scanned initializations. The sampled decode check covered 8 of 8 initialization regions and five leads, reporting 760 successfully decoded references.
- The plotted fields show consistent geographic orientation and plausible units and ranges.
- Sea-surface-temperature masking follows the continents. The land location has no sea-surface-temperature values, as expected.
- Precipitation and solar radiation show plausible hourly behavior. Rainfall is nonnegative and episodic, while radiation follows the daylight cycle without a cumulative ramp.
Review notes
- Longitudes use the 0–360 convention, and the horizontal dimensions are named
yandx.yholds latitude ascending from south to north andxholds longitude. For example, 100°W is x=260 in this dataset.
Datasets
| Role | Name | ID | Version | URL |
|---|---|---|---|---|
| Validation | Google WeatherNext 3 forecast, 15 day, 0.1 degree, virtual | google-weathernext3-forecast-15-day-0-1-degree-virtual |
v0.1.0 |
https://google-weathernext3.r2.dynamical.org/google-weathernext3-forecast-15-day-0-1-degree-virtual/v0.1.0.icechunk |
| Reference | NOAA GFS analysis | noaa-gfs-analysis |
0.1.0 |
s3://dynamical-noaa-gfs/noaa-gfs-analysis/v0.1.0.icechunk |
Run parameters
| Parameter | Value |
|---|---|
| Validation dataset type | forecast |
| Validation time range | init_time 2026-06-30T00:00 → 2026-07-01T18:00 |
| Reference time range | time 2021-05-01T00:00 → 2026-10-31T23:00 |
| Point 1 | lat=39.7000, lon=255.0000 |
| Point 2 | lat=25.0000, lon=300.0000 |
| Spatial comparison time | init=2026-07-01T00:00, lead=24h (reference at 2026-07-02T00:00) |
| Timeseries period | init=2026-07-01T00:00 |
| Statistic | mean when declared, otherwise standard_deviation |
| Store type | virtual — availability manifest-probed; value series sampled |
Availability
The plot below shows the availability of each variable over time — light red marks unavailable data, dark green marks present data.
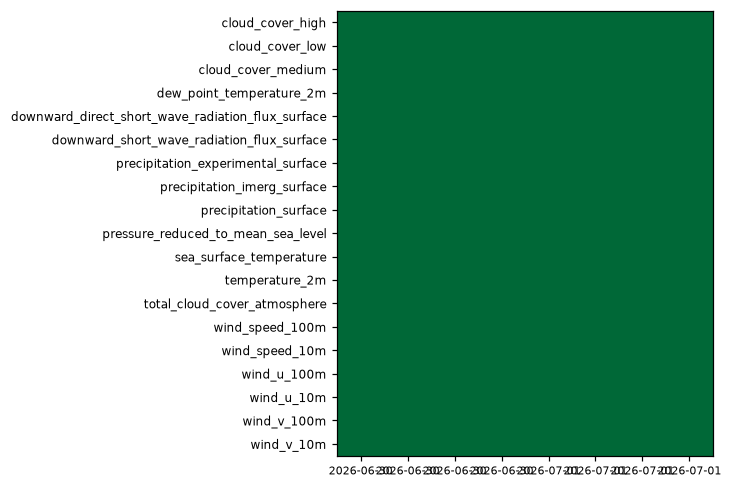
Every variable is complete at every scanned position.
Decode health
760 references decoded successfully, sampled across 8 of 8 append-dim regions, 5 leads and up to 6 present levels per group variable.
Per-variable details
cloud_cover_high [statistic=mean]
Metadata
| Field | Value |
|---|---|
| units | percent |
| long_name | High cloud cover |
| short_name | hcc |
| standard_name | cloud_area_fraction_in_atmosphere_layer |
| step_type | instant |
| sampled statistic | statistic=mean |
Point time series — 2026-06-30T00:00 - 2026-07-01T18:00, sampled lead=2h
| Point | min | mean | max |
|---|---|---|---|
| P1 | 0.04658 | 14.96 | 51.37 |
| P2 | 0.05554 | 5.216 | 33.07 |
Spatial — init=2026-07-01T00:00, lead=24h (reference not available)
| Source | min | mean | max |
|---|---|---|---|
| Validation | 0.00407 | 38.09 | 99.97 |
Temporal — init=2026-07-01T00:00
| Source | min | mean | max |
|---|---|---|---|
| P1 Validation | 0.049 | 29.24 | 74.91 |
| P2 Validation | 0.2409 | 28.8 | 59.38 |
Availability — 8 of 8 positions complete
cloud_cover_low [statistic=mean]
Metadata
| Field | Value |
|---|---|
| units | percent |
| long_name | Low cloud cover |
| short_name | lcc |
| standard_name | cloud_area_fraction_in_atmosphere_layer |
| step_type | instant |
| sampled statistic | statistic=mean |
Point time series — 2026-06-30T00:00 - 2026-07-01T18:00, sampled lead=2h
| Point | min | mean | max |
|---|---|---|---|
| P1 | 0.03272 | 0.06281 | 0.1009 |
| P2 | 0.9819 | 6.714 | 14.86 |
Spatial — init=2026-07-01T00:00, lead=24h (reference not available)
| Source | min | mean | max |
|---|---|---|---|
| Validation | 0.003559 | 45.3 | 99.99 |
Temporal — init=2026-07-01T00:00
| Source | min | mean | max |
|---|---|---|---|
| P1 Validation | 0.0233 | 1.112 | 8.642 |
| P2 Validation | 2.047 | 11.8 | 21.69 |
Availability — 8 of 8 positions complete
cloud_cover_medium [statistic=mean]
Metadata
| Field | Value |
|---|---|
| units | percent |
| long_name | Medium cloud cover |
| short_name | mcc |
| standard_name | cloud_area_fraction_in_atmosphere_layer |
| step_type | instant |
| sampled statistic | statistic=mean |
Point time series — 2026-06-30T00:00 - 2026-07-01T18:00, sampled lead=2h
| Point | min | mean | max |
|---|---|---|---|
| P1 | 0.04576 | 10.75 | 33.55 |
| P2 | 0.6527 | 9.606 | 17.95 |
Spatial — init=2026-07-01T00:00, lead=24h (reference not available)
| Source | min | mean | max |
|---|---|---|---|
| Validation | 0.002098 | 29.47 | 100 |
Temporal — init=2026-07-01T00:00
| Source | min | mean | max |
|---|---|---|---|
| P1 Validation | 0.06558 | 11.55 | 32.28 |
| P2 Validation | 0.08073 | 5.303 | 17.82 |
Availability — 8 of 8 positions complete
dew_point_temperature_2m [statistic=mean]
Metadata
| Field | Value |
|---|---|
| units | degree_Celsius |
| long_name | 2 metre dewpoint temperature |
| short_name | 2d |
| standard_name | dew_point_temperature |
| step_type | instant |
| sampled statistic | statistic=mean |
Point time series — 2026-06-30T00:00 - 2026-07-01T18:00, sampled lead=2h
| Point | min | mean | max |
|---|---|---|---|
| P1 | -8.153 | 1.527 | 8.935 |
| P2 | 20.76 | 21.79 | 22.84 |
Spatial — init=2026-07-01T00:00, lead=24h (reference not available)
| Source | min | mean | max |
|---|---|---|---|
| Validation | -71.34 | 3.934 | 29.5 |
Temporal — init=2026-07-01T00:00
| Source | min | mean | max |
|---|---|---|---|
| P1 Validation | -4.18 | 6.713 | 12.07 |
| P2 Validation | 20.63 | 22.29 | 23.07 |
Availability — 8 of 8 positions complete
downward_direct_short_wave_radiation_flux_surface [statistic=mean]
Metadata
| Field | Value |
|---|---|
| units | W m-2 |
| long_name | Surface direct short-wave radiation flux |
| short_name | aswdir_s |
| standard_name | surface_direct_downwelling_shortwave_flux_in_air |
| step_type | avg |
| sampled statistic | statistic=mean |
| comment | Average flux since the previous forecast step. |
Point time series — 2026-06-30T00:00 - 2026-07-01T18:00, sampled lead=2h
| Point | min | mean | max |
|---|---|---|---|
| P1 | 0.08039 | 250.7 | 762.2 |
| P2 | 0.05527 | 267.9 | 603.4 |
Spatial — init=2026-07-01T00:00, lead=24h (reference not available)
| Source | min | mean | max |
|---|---|---|---|
| Validation | 0 | 93.58 | 855.8 |
Temporal — init=2026-07-01T00:00
| Source | min | mean | max |
|---|---|---|---|
| P1 Validation | 0.02302 | 234.7 | 814.1 |
| P2 Validation | 0.01882 | 235 | 821.1 |
Availability — 8 of 8 positions complete
downward_short_wave_radiation_flux_surface [statistic=mean]
Metadata
| Field | Value |
|---|---|
| units | W m-2 |
| long_name | Surface downward short-wave radiation flux |
| short_name | sdswrf |
| standard_name | surface_downwelling_shortwave_flux_in_air |
| step_type | avg |
| sampled statistic | statistic=mean |
| comment | Average flux since the previous forecast step. |
Point time series — 2026-06-30T00:00 - 2026-07-01T18:00, sampled lead=2h
| Point | min | mean | max |
|---|---|---|---|
| P1 | 0.04812 | 325.1 | 939.7 |
| P2 | 0.04283 | 331.5 | 732.6 |
Spatial — init=2026-07-01T00:00, lead=24h (reference at 2026-07-02T00:00)
| Source | min | mean | max |
|---|---|---|---|
| Validation | 0 | 155.9 | 977.6 |
| Reference | 0 | 163.3 | 972 |
Temporal — init=2026-07-01T00:00
| Source | min | mean | max |
|---|---|---|---|
| P1 Validation | 0.04956 | 312.9 | 967.1 |
| P1 Reference | 0 | 338 | 1032 |
| P2 Validation | 0.02245 | 303.3 | 951.3 |
| P2 Reference | 0 | 329.4 | 884 |
Availability — 8 of 8 positions complete
precipitation_experimental_surface [statistic=mean]
Metadata
| Field | Value |
|---|---|
| units | kg m-2 s-1 |
| long_name | Precipitation rate |
| short_name | prate |
| standard_name | precipitation_flux |
| step_type | avg |
| sampled statistic | statistic=mean |
| comment | Average precipitation rate since the previous forecast step. Units equivalent to mm/s. WeatherNext 3 forecast of 1-hour precipitation from its experimental satellite-radar precipitation head; a model forecast, not an observation. |
Point time series — 2026-06-30T00:00 - 2026-07-01T18:00, sampled lead=2h
| Point | min | mean | max |
|---|---|---|---|
| P1 | 5.621e-09 | 2.649e-07 | 1.462e-06 |
| P2 | 8.588e-08 | 1.843e-05 | 9.85e-05 |
Spatial — init=2026-07-01T00:00, lead=24h (reference not available)
| Source | min | mean | max |
|---|---|---|---|
| Validation | 0 | 2.92e-05 | 0.004447 |
Temporal — init=2026-07-01T00:00
| Source | min | mean | max |
|---|---|---|---|
| P1 Validation | 6.401e-09 | 1.796e-05 | 0.0002884 |
| P2 Validation | 7.965e-09 | 1.138e-05 | 0.0001656 |
Availability — 8 of 8 positions complete
precipitation_imerg_surface [statistic=mean]
Metadata
| Field | Value |
|---|---|
| units | kg m-2 s-1 |
| long_name | Precipitation rate |
| short_name | prate |
| standard_name | precipitation_flux |
| step_type | avg |
| sampled statistic | statistic=mean |
| comment | Average precipitation rate since the previous forecast step. Units equivalent to mm/s. WeatherNext 3 forecast of 1-hour precipitation calibrated to IMERG satellite precipitation; a model forecast, not an observation. |
Point time series — 2026-06-30T00:00 - 2026-07-01T18:00, sampled lead=2h
| Point | min | mean | max |
|---|---|---|---|
| P1 | 1.883e-08 | 1.221e-06 | 7.961e-06 |
| P2 | 1.821e-08 | 3.671e-06 | 2.051e-05 |
Spatial — init=2026-07-01T00:00, lead=24h (reference not available)
| Source | min | mean | max |
|---|---|---|---|
| Validation | 4.266e-10 | 2.876e-05 | 0.004213 |
Temporal — init=2026-07-01T00:00
| Source | min | mean | max |
|---|---|---|---|
| P1 Validation | 7.198e-09 | 1.043e-05 | 0.000121 |
| P2 Validation | 8.092e-09 | 4.523e-06 | 6.441e-05 |
Availability — 8 of 8 positions complete
precipitation_surface [statistic=mean]
Metadata
| Field | Value |
|---|---|
| units | kg m-2 s-1 |
| long_name | Precipitation rate |
| short_name | prate |
| standard_name | precipitation_flux |
| step_type | avg |
| sampled statistic | statistic=mean |
| comment | Average precipitation rate since the previous forecast step. Units equivalent to mm/s. WeatherNext 3 model-native 1-hour precipitation. |
Point time series — 2026-06-30T00:00 - 2026-07-01T18:00, sampled lead=2h
| Point | min | mean | max |
|---|---|---|---|
| P1 | 2.09e-08 | 2.242e-06 | 1.316e-05 |
| P2 | 4.744e-08 | 9.907e-06 | 5.915e-05 |
Spatial — init=2026-07-01T00:00, lead=24h (reference at 2026-07-02T00:00)
| Source | min | mean | max |
|---|---|---|---|
| Validation | 3.583e-10 | 3.182e-05 | 0.002363 |
| Reference | 0 | 3.162e-05 | 0.01685 |
Temporal — init=2026-07-01T00:00
| Source | min | mean | max |
|---|---|---|---|
| P1 Validation | 2.336e-08 | 6.22e-06 | 7.895e-05 |
| P1 Reference | 0 | 6.762e-07 | 6.962e-05 |
| P2 Validation | 2.76e-08 | 5.668e-06 | 3.503e-05 |
| P2 Reference | 0 | 1.477e-05 | 0.0005913 |
Availability — 8 of 8 positions complete
pressure_reduced_to_mean_sea_level [statistic=mean]
Metadata
| Field | Value |
|---|---|
| units | Pa |
| long_name | Pressure reduced to MSL |
| short_name | prmsl |
| standard_name | air_pressure_at_mean_sea_level |
| step_type | instant |
| sampled statistic | statistic=mean |
Point time series — 2026-06-30T00:00 - 2026-07-01T18:00, sampled lead=2h
| Point | min | mean | max |
|---|---|---|---|
| P1 | 1.002e+05 | 1.007e+05 | 1.012e+05 |
| P2 | 1.018e+05 | 1.019e+05 | 1.021e+05 |
Spatial — init=2026-07-01T00:00, lead=24h (reference at 2026-07-02T00:00)
| Source | min | mean | max |
|---|---|---|---|
| Validation | 9.391e+04 | 1.007e+05 | 1.039e+05 |
| Reference | 9.414e+04 | 1.008e+05 | 1.073e+05 |
Temporal — init=2026-07-01T00:00
| Source | min | mean | max |
|---|---|---|---|
| P1 Validation | 1.003e+05 | 1.013e+05 | 1.018e+05 |
| P1 Reference | 1.001e+05 | 1.011e+05 | 1.018e+05 |
| P2 Validation | 1.017e+05 | 1.021e+05 | 1.024e+05 |
| P2 Reference | 1.018e+05 | 1.021e+05 | 1.024e+05 |
Availability — 8 of 8 positions complete
sea_surface_temperature [statistic=mean]
Metadata
| Field | Value |
|---|---|
| units | degree_Celsius |
| long_name | Sea surface temperature |
| short_name | sst |
| standard_name | sea_surface_temperature |
| step_type | instant |
| sampled statistic | statistic=mean |
| comment | NaN over land where sea surface temperature does not apply. |
Point time series — 2026-06-30T00:00 - 2026-07-01T18:00, sampled lead=2h
| Point | min | mean | max |
|---|---|---|---|
| P1 | n/a | n/a | n/a |
| P2 | 28.24 | 28.73 | 29.46 |
Spatial — init=2026-07-01T00:00, lead=24h (reference not available)
| Source | min | mean | max |
|---|---|---|---|
| Validation | -1.711 | 14.37 | 33.82 |
Temporal — init=2026-07-01T00:00
| Source | min | mean | max |
|---|---|---|---|
| P1 Validation | n/a | n/a | n/a |
| P2 Validation | 28.94 | 29.34 | 30.32 |
Availability — 8 of 8 positions complete
temperature_2m [statistic=mean]
Metadata
| Field | Value |
|---|---|
| units | degree_Celsius |
| long_name | 2 metre temperature |
| short_name | 2t |
| standard_name | air_temperature |
| step_type | instant |
| sampled statistic | statistic=mean |
Point time series — 2026-06-30T00:00 - 2026-07-01T18:00, sampled lead=2h
| Point | min | mean | max |
|---|---|---|---|
| P1 | 16.13 | 23.7 | 32.87 |
| P2 | 26.1 | 27.26 | 28.22 |
Spatial — init=2026-07-01T00:00, lead=24h (reference at 2026-07-02T00:00)
| Source | min | mean | max |
|---|---|---|---|
| Validation | -71.61 | 8.295 | 39.33 |
| Reference | -72 | 8.511 | 40.25 |
Temporal — init=2026-07-01T00:00
| Source | min | mean | max |
|---|---|---|---|
| P1 Validation | 13.42 | 23.88 | 34.26 |
| P1 Reference | 17 | 27.45 | 37.5 |
| P2 Validation | 27.13 | 28.47 | 29.24 |
| P2 Reference | 26 | 27.45 | 28.62 |
Availability — 8 of 8 positions complete
total_cloud_cover_atmosphere [statistic=mean]
Metadata
| Field | Value |
|---|---|
| units | percent |
| long_name | Total cloud cover |
| short_name | tcc |
| standard_name | cloud_area_fraction |
| step_type | instant |
| sampled statistic | statistic=mean |
Point time series — 2026-06-30T00:00 - 2026-07-01T18:00, sampled lead=2h
| Point | min | mean | max |
|---|---|---|---|
| P1 | 0.1843 | 19.59 | 65.35 |
| P2 | 1.406 | 19 | 45.42 |
Spatial — init=2026-07-01T00:00, lead=24h (reference at 2026-07-02T00:00)
| Source | min | mean | max |
|---|---|---|---|
| Validation | 0.001401 | 68.78 | 99.99 |
| Reference | 0 | 69.82 | 100 |
Temporal — init=2026-07-01T00:00
| Source | min | mean | max |
|---|---|---|---|
| P1 Validation | 0.2888 | 33.76 | 78.04 |
| P1 Reference | 0 | 23.72 | 100 |
| P2 Validation | 8.314 | 39.36 | 65.02 |
| P2 Reference | 0 | 50.37 | 100 |
Availability — 8 of 8 positions complete
wind_speed_100m [statistic=mean]
Metadata
| Field | Value |
|---|---|
| units | m s-1 |
| long_name | 100 metre wind speed |
| short_name | 100si |
| standard_name | wind_speed |
| step_type | instant |
| sampled statistic | statistic=mean |
| comment | The statistic of ensemble wind speed, not derived from the u/v statistics. |
Point time series — 2026-06-30T00:00 - 2026-07-01T18:00, sampled lead=2h
| Point | min | mean | max |
|---|---|---|---|
| P1 | 1.88 | 3.938 | 6.285 |
| P2 | 0.8498 | 3.251 | 4.639 |
Spatial — init=2026-07-01T00:00, lead=24h (reference not available)
| Source | min | mean | max |
|---|---|---|---|
| Validation | 0.5316 | 8.637 | 31.9 |
Temporal — init=2026-07-01T00:00
| Source | min | mean | max |
|---|---|---|---|
| P1 Validation | 1.479 | 3.738 | 7.766 |
| P2 Validation | 1.597 | 3.67 | 5.889 |
Availability — 8 of 8 positions complete
wind_speed_10m [statistic=mean]
Metadata
| Field | Value |
|---|---|
| units | m s-1 |
| long_name | 10 metre wind speed |
| short_name | 10si |
| standard_name | wind_speed |
| step_type | instant |
| sampled statistic | statistic=mean |
| comment | The statistic of ensemble wind speed, not derived from the u/v statistics. |
Point time series — 2026-06-30T00:00 - 2026-07-01T18:00, sampled lead=2h
| Point | min | mean | max |
|---|---|---|---|
| P1 | 1.223 | 2.538 | 4.432 |
| P2 | 0.8036 | 3.091 | 4.344 |
Spatial — init=2026-07-01T00:00, lead=24h (reference not available)
| Source | min | mean | max |
|---|---|---|---|
| Validation | 0.3682 | 6.769 | 24.81 |
Temporal — init=2026-07-01T00:00
| Source | min | mean | max |
|---|---|---|---|
| P1 Validation | 1.085 | 2.51 | 5.542 |
| P2 Validation | 1.581 | 3.472 | 5.438 |
Availability — 8 of 8 positions complete
wind_u_100m [statistic=mean]
Metadata
| Field | Value |
|---|---|
| units | m s-1 |
| long_name | 100 metre U wind component |
| short_name | 100u |
| standard_name | eastward_wind |
| step_type | instant |
| sampled statistic | statistic=mean |
Point time series — 2026-06-30T00:00 - 2026-07-01T18:00, sampled lead=2h
| Point | min | mean | max |
|---|---|---|---|
| P1 | -4.732 | -0.9974 | 0.9796 |
| P2 | -3.204 | -2.19 | -0.1794 |
Spatial — init=2026-07-01T00:00, lead=24h (reference at 2026-07-02T00:00)
| Source | min | mean | max |
|---|---|---|---|
| Validation | -31.66 | 0.7031 | 29.53 |
| Reference | -32.5 | 0.7846 | 30 |
Temporal — init=2026-07-01T00:00
| Source | min | mean | max |
|---|---|---|---|
| P1 Validation | -4.336 | 0.2564 | 2.353 |
| P1 Reference | -12 | -1.051 | 15.62 |
| P2 Validation | -4.737 | -2.414 | -0.4135 |
| P2 Reference | -4.938 | -1.515 | 2.031 |
Availability — 8 of 8 positions complete
wind_u_10m [statistic=mean]
Metadata
| Field | Value |
|---|---|
| units | m s-1 |
| long_name | 10 metre U wind component |
| short_name | 10u |
| standard_name | eastward_wind |
| step_type | instant |
| sampled statistic | statistic=mean |
Point time series — 2026-06-30T00:00 - 2026-07-01T18:00, sampled lead=2h
| Point | min | mean | max |
|---|---|---|---|
| P1 | -3.537 | -0.6387 | 0.7859 |
| P2 | -3.069 | -2.088 | -0.1631 |
Spatial — init=2026-07-01T00:00, lead=24h (reference at 2026-07-02T00:00)
| Source | min | mean | max |
|---|---|---|---|
| Validation | -23.79 | 0.4879 | 23.81 |
| Reference | -24.25 | 0.5274 | 24.25 |
Temporal — init=2026-07-01T00:00
| Source | min | mean | max |
|---|---|---|---|
| P1 Validation | -3.316 | 0.1145 | 1.722 |
| P1 Reference | -8.375 | -0.8915 | 11 |
| P2 Validation | -4.363 | -2.276 | -0.4244 |
| P2 Reference | -4.562 | -1.449 | 1.984 |
Availability — 8 of 8 positions complete
wind_v_100m [statistic=mean]
Metadata
| Field | Value |
|---|---|
| units | m s-1 |
| long_name | 100 metre V wind component |
| short_name | 100v |
| standard_name | northward_wind |
| step_type | instant |
| sampled statistic | statistic=mean |
Point time series — 2026-06-30T00:00 - 2026-07-01T18:00, sampled lead=2h
| Point | min | mean | max |
|---|---|---|---|
| P1 | -3.845 | 0.116 | 5.74 |
| P2 | -0.6665 | 1.91 | 3.837 |
Spatial — init=2026-07-01T00:00, lead=24h (reference at 2026-07-02T00:00)
| Source | min | mean | max |
|---|---|---|---|
| Validation | -24.16 | 0.7018 | 30.13 |
| Reference | -28 | 0.7212 | 27.5 |
Temporal — init=2026-07-01T00:00
| Source | min | mean | max |
|---|---|---|---|
| P1 Validation | -6.212 | 0.1197 | 5.848 |
| P1 Reference | -14.25 | 0.9771 | 13.12 |
| P2 Validation | -1.361 | 0.9956 | 3.616 |
| P2 Reference | -2.531 | 1.529 | 5.125 |
Availability — 8 of 8 positions complete
wind_v_10m [statistic=mean]
Metadata
| Field | Value |
|---|---|
| units | m s-1 |
| long_name | 10 metre V wind component |
| short_name | 10v |
| standard_name | northward_wind |
| step_type | instant |
| sampled statistic | statistic=mean |
Point time series — 2026-06-30T00:00 - 2026-07-01T18:00, sampled lead=2h
| Point | min | mean | max |
|---|---|---|---|
| P1 | -2.172 | 0.1761 | 3.921 |
| P2 | -0.6319 | 1.808 | 3.643 |
Spatial — init=2026-07-01T00:00, lead=24h (reference at 2026-07-02T00:00)
| Source | min | mean | max |
|---|---|---|---|
| Validation | -18.99 | 0.6329 | 21.8 |
| Reference | -22.25 | 0.6287 | 22.25 |
Temporal — init=2026-07-01T00:00
| Source | min | mean | max |
|---|---|---|---|
| P1 Validation | -4.346 | 0.076 | 3.109 |
| P1 Reference | -9.125 | 0.5394 | 8.625 |
| P2 Validation | -1.248 | 0.9512 | 3.446 |
| P2 Reference | -2.469 | 1.475 | 4.812 |
Availability — 8 of 8 positions complete