Google WeatherNext 2 forecast, operational, virtual validation report
This dataset validation report plots a sample of values from the Google WeatherNext 2 forecast, operational, virtual dataset over time and across space, comparing where possible to a previously validated reference dataset. It also reports the quantity of unavailable values and their associated timestamps. These analyses are one layer of a multi-layered dataset validation process we perform at dynamical.org and also provide users a preview of the dataset contents.
Report generation start time: 2026-10-21T13:02:19 UTC
Summary
This dataset has been reviewed and is ready for use.
What looks good
- All 14 variables are complete at all 2,633 scanned initializations, from 2025-01-01 through 2026-10-21T00:00 UTC. No expected source files are missing in this run.
- Every sampled reference decoded cleanly: 1,400 references across 20 regions, five lead times and up to three present levels per pressure-level variable.
- Geometry and coordinates are correct on every spatial map, with north up and land features where expected on the 0–360 longitude grid.
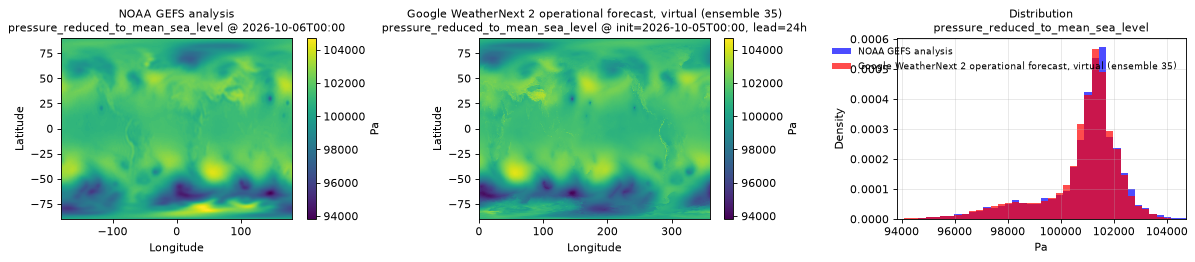
- The six variables shared with NOAA GEFS analysis compare well at the snapshot: 2 m temperature, mean sea level pressure, and 10 m and 100 m wind components. Snapshot mean 2 m temperature is 6.905 °C against 7.054 °C in the reference; mean sea level pressure is 100,800 Pa against 100,900 Pa.
- The fields are meteorologically plausible, with no persistent step changes in the 14 sampled full-period series through October 2026. Seasonal cycles, upper-level jets and storm-track precipitation are coherent; land temperature has a stronger diurnal cycle than ocean temperature.
Review notes
- Longitudes use the 0–360 convention, and the horizontal dimensions are named
yandx.yholds latitude ascending from south to north andxholds longitude. For example, 100°W is x=260 in this dataset.
Variables needing care
- Sea surface temperature is a daily field. It steps once every 24 hours and is NaN over land.
For further review
Datasets
| Role | Name | ID | Version | URL |
|---|---|---|---|---|
| Validation | Google WeatherNext 2 forecast, operational, virtual | google-weathernext2-forecast-operational-virtual |
v0.1.0 |
https://google-weathernext2.r2.dynamical.org/google-weathernext2-forecast-operational-virtual/v0.1.0.icechunk |
| Reference | NOAA GEFS analysis | noaa-gefs-analysis |
0.1.2 |
s3://dynamical-noaa-gefs/noaa-gefs-analysis/v0.1.2.icechunk/ |
Run parameters
| Parameter | Value |
|---|---|
| Validation dataset type | forecast |
| Validation time range | init_time 2025-01-01T00:00 → 2026-10-21T00:00 |
| Reference time range | time 2000-01-01T00:00 → 2026-10-21T06:00 |
| Point 1 | lat=40.0000, lon=260.0000 |
| Point 2 | lat=-20.0000, lon=220.0000 |
| Ensemble member | 35 |
| Spatial comparison time | init=2026-10-05T00:00, lead=24h (reference at 2026-10-06T00:00) |
| Timeseries period | init=2026-10-05T00:00 |
| Vertical level | middle level per vertical dim |
| Store type | virtual — availability manifest-probed; value series sampled |
Availability
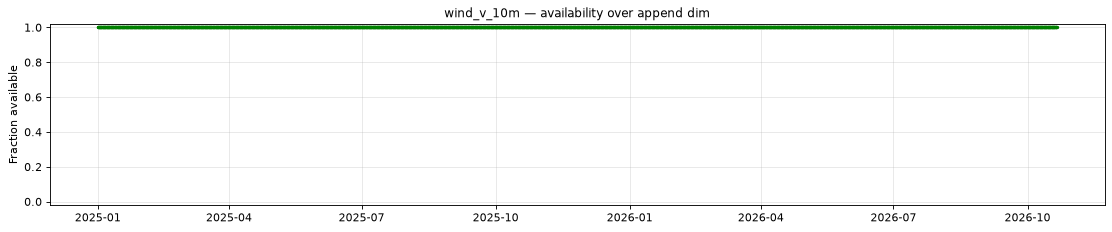
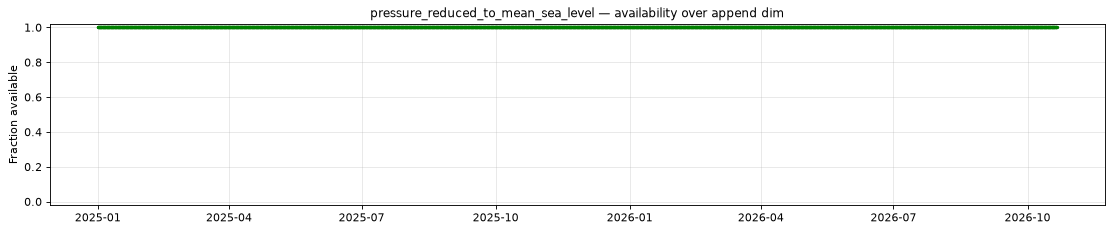
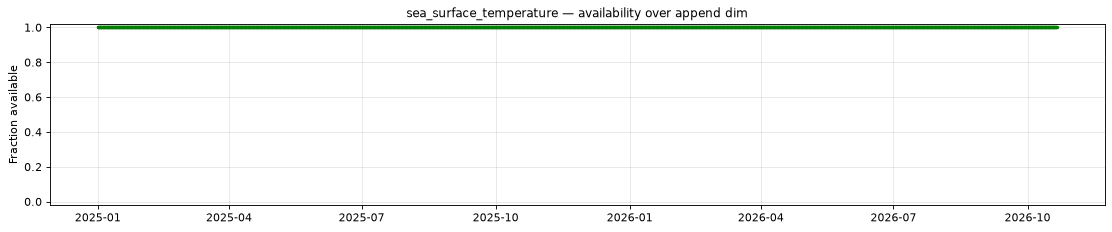
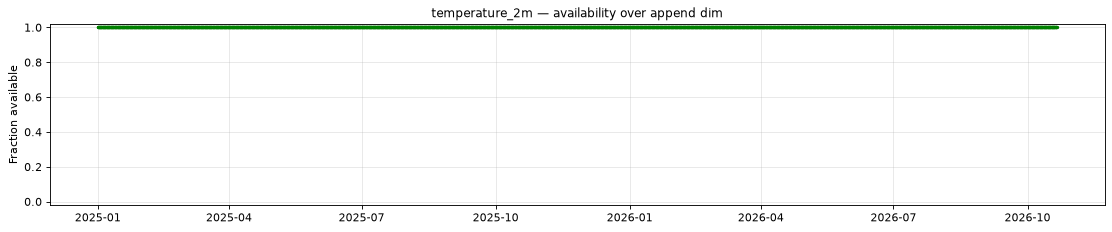
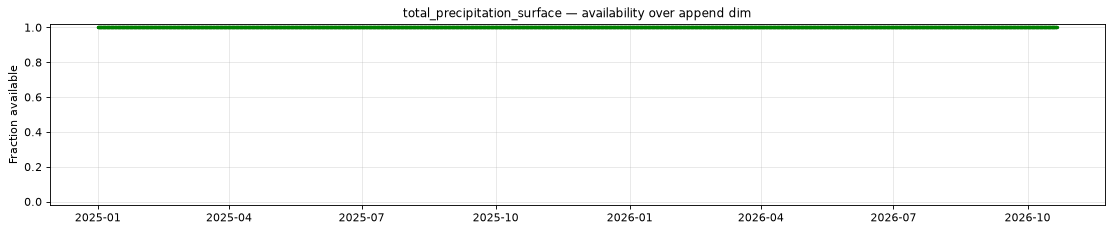
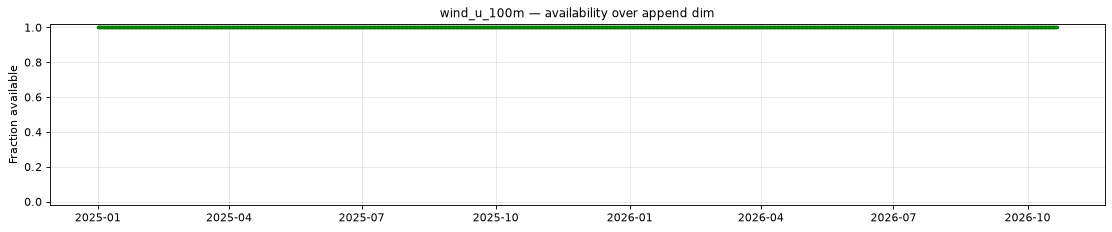
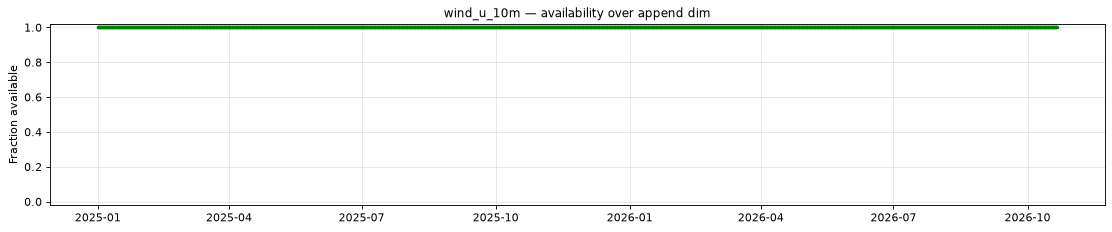
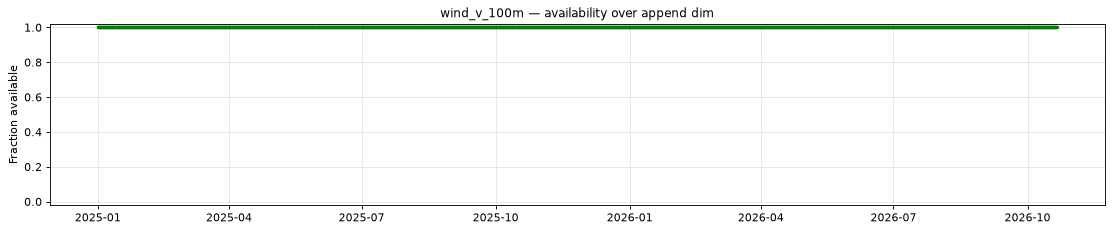
The plot below shows the availability of each variable over time — light red marks unavailable data, dark green marks present data.
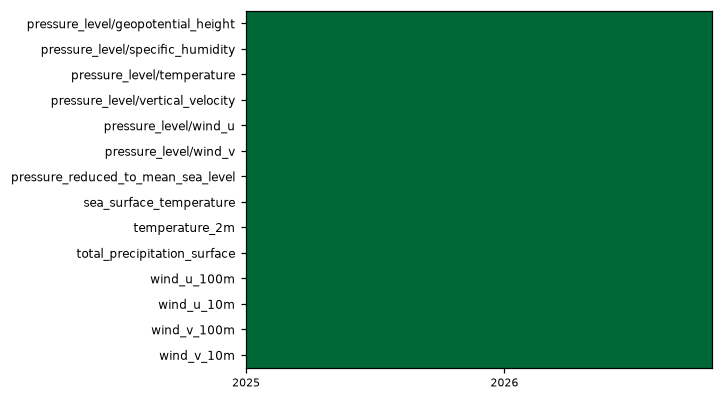
Every variable is complete at every scanned position.
Decode health
1400 references decoded successfully, sampled across 20 of 2633 append-dim regions, 5 leads and up to 3 present levels per group variable.
Per-variable details
pressure_level/geopotential_height [pressure_level=400]
Metadata
| Field | Value |
|---|---|
| units | m |
| long_name | Geopotential height |
| short_name | gh |
| standard_name | geopotential_height |
| step_type | instant |
| sampled level | pressure_level=400 |
Point time series — 2025-01-01T00:00 - 2026-10-21T00:00, sampled lead=12h, member=0, pressure_level=400
| Point | min | mean | max |
|---|---|---|---|
| P1 | 6807 | 7395 | 7690 |
| P2 | 7444 | 7567 | 7641 |
Spatial — init=2026-10-05T00:00, lead=24h (reference not available)
| Source | min | mean | max |
|---|---|---|---|
| Validation | 6176 | 7157 | 7705 |
Temporal — init=2026-10-05T00:00
| Source | min | mean | max |
|---|---|---|---|
| P1 Validation | 7331 | 7491 | 7581 |
| P2 Validation | 7488 | 7546 | 7586 |
Availability — 2633 of 2633 positions complete
pressure_level/specific_humidity [pressure_level=400]
Metadata
| Field | Value |
|---|---|
| units | 1 |
| long_name | Specific humidity |
| short_name | q |
| standard_name | specific_humidity |
| step_type | instant |
| sampled level | pressure_level=400 |
| comment | Small negative values are raw model artifacts; set values < 0 to zero. |
Point time series — 2025-01-01T00:00 - 2026-10-21T00:00, sampled lead=12h, member=0, pressure_level=400
| Point | min | mean | max |
|---|---|---|---|
| P1 | 8.813e-06 | 0.0005033 | 0.002493 |
| P2 | 4.871e-05 | 0.0007191 | 0.002631 |
Spatial — init=2026-10-05T00:00, lead=24h (reference not available)
| Source | min | mean | max |
|---|---|---|---|
| Validation | -9.894e-05 | 0.0004257 | 0.006075 |
Temporal — init=2026-10-05T00:00
| Source | min | mean | max |
|---|---|---|---|
| P1 Validation | 6.505e-05 | 0.0004268 | 0.001809 |
| P2 Validation | 0.0001223 | 0.001379 | 0.002771 |
Availability — 2633 of 2633 positions complete
pressure_level/temperature [pressure_level=400]
Metadata
| Field | Value |
|---|---|
| units | degree_Celsius |
| long_name | Temperature |
| short_name | t |
| standard_name | air_temperature |
| step_type | instant |
| sampled level | pressure_level=400 |
Point time series — 2025-01-01T00:00 - 2026-10-21T00:00, sampled lead=12h, member=0, pressure_level=400
| Point | min | mean | max |
|---|---|---|---|
| P1 | -46.73 | -25.68 | -12.78 |
| P2 | -25.45 | -17.93 | -11.52 |
Spatial — init=2026-10-05T00:00, lead=24h (reference not available)
| Source | min | mean | max |
|---|---|---|---|
| Validation | -56.91 | -30 | -4.49 |
Temporal — init=2026-10-05T00:00
| Source | min | mean | max |
|---|---|---|---|
| P1 Validation | -28.01 | -23.11 | -18.5 |
| P2 Validation | -19.02 | -15.32 | -13.41 |
Availability — 2633 of 2633 positions complete
pressure_level/vertical_velocity [pressure_level=400]
Metadata
| Field | Value |
|---|---|
| units | Pa s-1 |
| long_name | Vertical velocity |
| short_name | w |
| standard_name | lagrangian_tendency_of_air_pressure |
| step_type | instant |
| sampled level | pressure_level=400 |
Point time series — 2025-01-01T00:00 - 2026-10-21T00:00, sampled lead=12h, member=0, pressure_level=400
| Point | min | mean | max |
|---|---|---|---|
| P1 | -2.184 | 0.04377 | 1.134 |
| P2 | -1.753 | -0.0244 | 0.5661 |
Spatial — init=2026-10-05T00:00, lead=24h (reference not available)
| Source | min | mean | max |
|---|---|---|---|
| Validation | -9.796 | 0.0009656 | 4.752 |
Temporal — init=2026-10-05T00:00
| Source | min | mean | max |
|---|---|---|---|
| P1 Validation | -1.114 | 0.03179 | 0.7115 |
| P2 Validation | -0.4791 | 0.01336 | 0.2724 |
Availability — 2633 of 2633 positions complete
pressure_level/wind_u [pressure_level=400]
Metadata
| Field | Value |
|---|---|
| units | m s-1 |
| long_name | U component of wind |
| short_name | u |
| standard_name | eastward_wind |
| step_type | instant |
| sampled level | pressure_level=400 |
Point time series — 2025-01-01T00:00 - 2026-10-21T00:00, sampled lead=12h, member=0, pressure_level=400
| Point | min | mean | max |
|---|---|---|---|
| P1 | -12.75 | 15.27 | 53.44 |
| P2 | -12.48 | 9.987 | 35.5 |
Spatial — init=2026-10-05T00:00, lead=24h (reference not available)
| Source | min | mean | max |
|---|---|---|---|
| Validation | -41.62 | 8.729 | 73.36 |
Temporal — init=2026-10-05T00:00
| Source | min | mean | max |
|---|---|---|---|
| P1 Validation | -6.143 | 11.77 | 24.06 |
| P2 Validation | 21.12 | 32.42 | 39.57 |
Availability — 2633 of 2633 positions complete
pressure_level/wind_v [pressure_level=400]
Metadata
| Field | Value |
|---|---|
| units | m s-1 |
| long_name | V component of wind |
| short_name | v |
| standard_name | northward_wind |
| step_type | instant |
| sampled level | pressure_level=400 |
Point time series — 2025-01-01T00:00 - 2026-10-21T00:00, sampled lead=12h, member=0, pressure_level=400
| Point | min | mean | max |
|---|---|---|---|
| P1 | -39.41 | -2.713 | 35.93 |
| P2 | -18.9 | 0.1688 | 17.29 |
Spatial — init=2026-10-05T00:00, lead=24h (reference not available)
| Source | min | mean | max |
|---|---|---|---|
| Validation | -59.05 | -0.01641 | 53.8 |
Temporal — init=2026-10-05T00:00
| Source | min | mean | max |
|---|---|---|---|
| P1 Validation | -26.59 | -4.529 | 18.8 |
| P2 Validation | -13.07 | -3.402 | 9.592 |
Availability — 2633 of 2633 positions complete
pressure_reduced_to_mean_sea_level
Metadata
| Field | Value |
|---|---|
| units | Pa |
| long_name | Pressure reduced to MSL |
| short_name | prmsl |
| standard_name | air_pressure_at_mean_sea_level |
| step_type | instant |
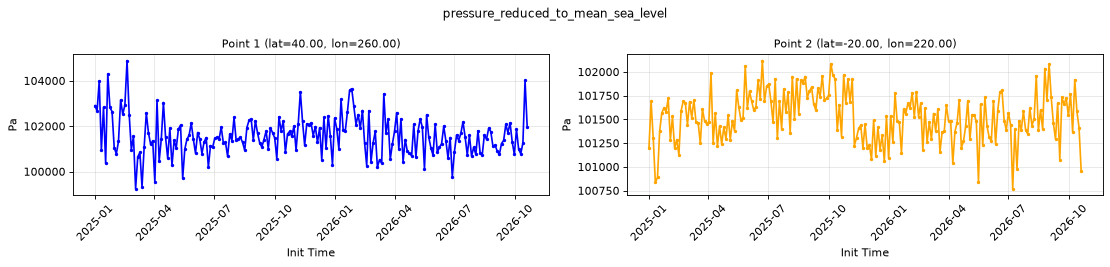
Point time series — 2025-01-01T00:00 - 2026-10-21T00:00, sampled lead=12h, member=0
| Point | min | mean | max |
|---|---|---|---|
| P1 | 9.924e+04 | 1.016e+05 | 1.049e+05 |
| P2 | 1.008e+05 | 1.015e+05 | 1.021e+05 |
Spatial — init=2026-10-05T00:00, lead=24h (reference at 2026-10-06T00:00)
| Source | min | mean | max |
|---|---|---|---|
| Validation | 9.382e+04 | 1.008e+05 | 1.043e+05 |
| Reference | 9.382e+04 | 1.009e+05 | 1.047e+05 |
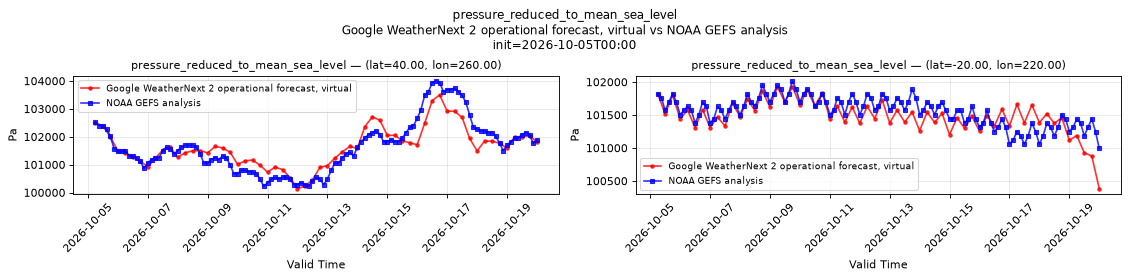
Temporal — init=2026-10-05T00:00
| Source | min | mean | max |
|---|---|---|---|
| P1 Validation | 1.001e+05 | 1.016e+05 | 1.035e+05 |
| P1 Reference | 1.002e+05 | 1.017e+05 | 1.04e+05 |
| P2 Validation | 1.004e+05 | 1.015e+05 | 1.019e+05 |
| P2 Reference | 1.01e+05 | 1.016e+05 | 1.02e+05 |
Availability — 2633 of 2633 positions complete
sea_surface_temperature
Metadata
| Field | Value |
|---|---|
| units | degree_Celsius |
| long_name | Sea surface temperature |
| short_name | sst |
| standard_name | sea_surface_temperature |
| step_type | instant |
| comment | NaN over land where sea surface temperature does not apply. Value changes once every 24 hours. |
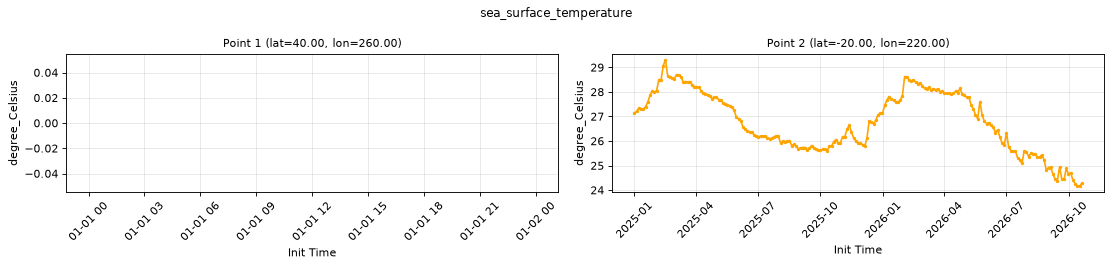
Point time series — 2025-01-01T00:00 - 2026-10-21T00:00, sampled lead=12h, member=0
| Point | min | mean | max |
|---|---|---|---|
| P1 | n/a | n/a | n/a |
| P2 | 24.16 | 26.78 | 29.3 |
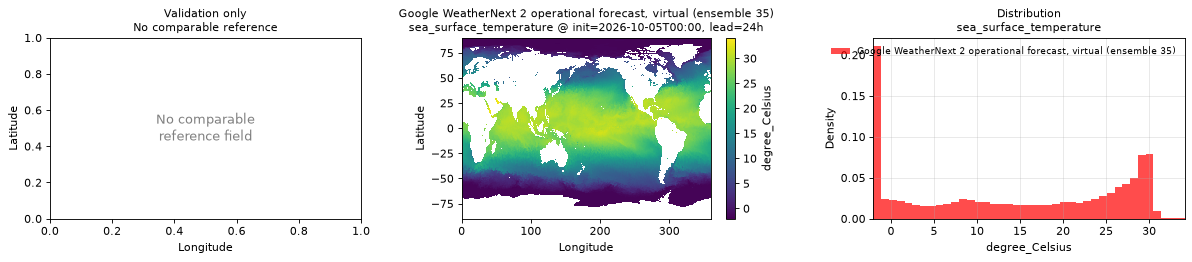
Spatial — init=2026-10-05T00:00, lead=24h (reference not available)
| Source | min | mean | max |
|---|---|---|---|
| Validation | -2.043 | 14.34 | 34.12 |
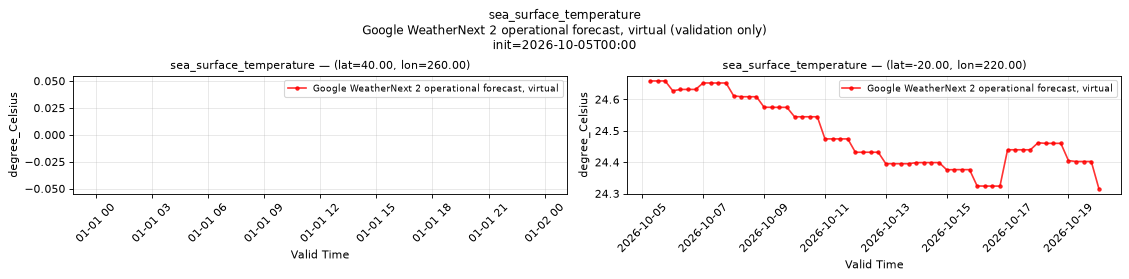
Temporal — init=2026-10-05T00:00
| Source | min | mean | max |
|---|---|---|---|
| P1 Validation | n/a | n/a | n/a |
| P2 Validation | 24.32 | 24.49 | 24.66 |
Availability — 2633 of 2633 positions complete
temperature_2m
Metadata
| Field | Value |
|---|---|
| units | degree_Celsius |
| long_name | 2 metre temperature |
| short_name | 2t |
| standard_name | air_temperature |
| step_type | instant |
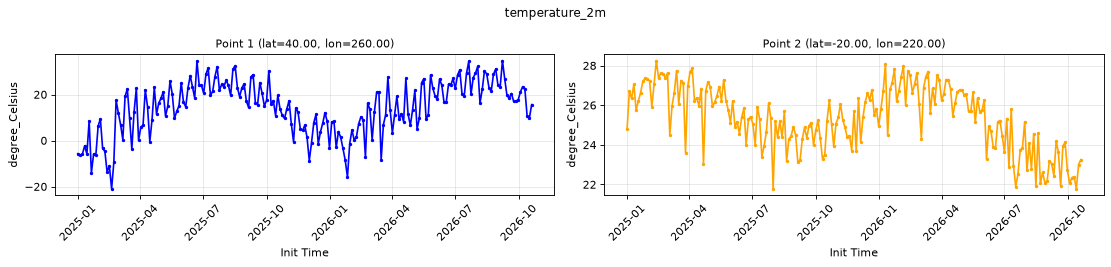
Point time series — 2025-01-01T00:00 - 2026-10-21T00:00, sampled lead=12h, member=0
| Point | min | mean | max |
|---|---|---|---|
| P1 | -20.99 | 14.2 | 34.75 |
| P2 | 21.78 | 25.35 | 28.25 |
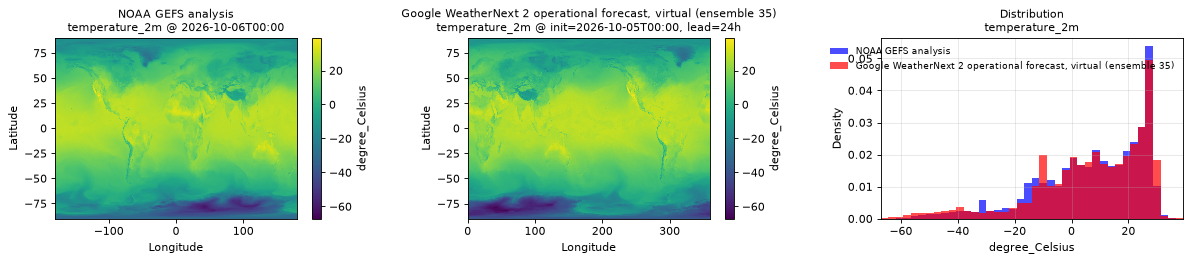
Spatial — init=2026-10-05T00:00, lead=24h (reference at 2026-10-06T00:00)
| Source | min | mean | max |
|---|---|---|---|
| Validation | -67.18 | 6.905 | 39.28 |
| Reference | -61.75 | 7.054 | 38 |
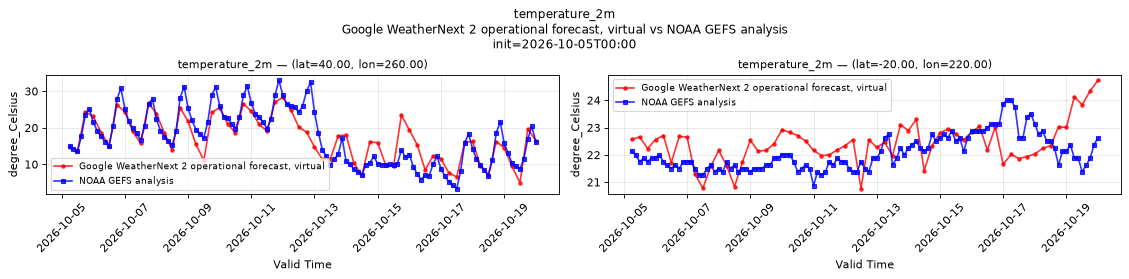
Temporal — init=2026-10-05T00:00
| Source | min | mean | max |
|---|---|---|---|
| P1 Validation | 4.98 | 17.15 | 28.35 |
| P1 Reference | 3.375 | 17.42 | 33 |
| P2 Validation | 20.76 | 22.43 | 24.73 |
| P2 Reference | 20.88 | 22.07 | 24 |
Availability — 2633 of 2633 positions complete
total_precipitation_surface
Metadata
| Field | Value |
|---|---|
| units | kg m-2 |
| long_name | Total precipitation |
| short_name | tp |
| standard_name | precipitation_amount |
| step_type | accum |
| comment | Accumulated over a six-hour forecast interval. Small negative values are raw model artifacts; set values < 0 to zero. |
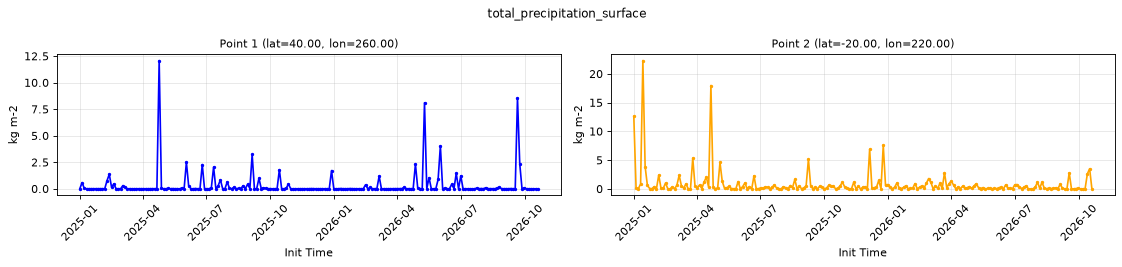
Point time series — 2025-01-01T00:00 - 2026-10-21T00:00, sampled lead=12h, member=0
| Point | min | mean | max |
|---|---|---|---|
| P1 | -0.0109 | 0.3316 | 12.08 |
| P2 | -0.004965 | 0.8094 | 22.3 |
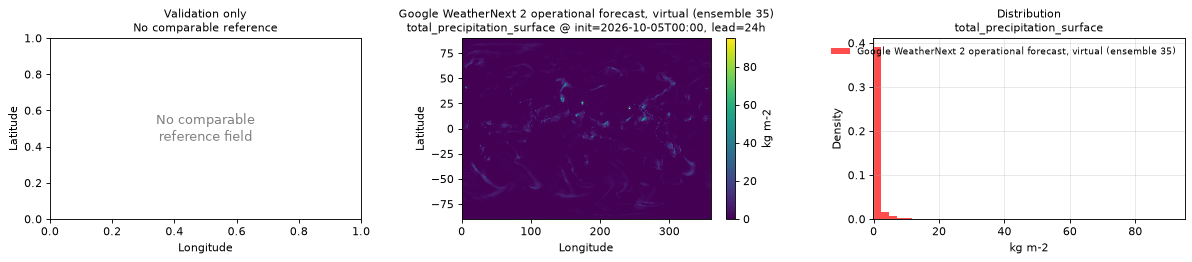
Spatial — init=2026-10-05T00:00, lead=24h (reference not available)
| Source | min | mean | max |
|---|---|---|---|
| Validation | -0.05659 | 0.6807 | 95.07 |
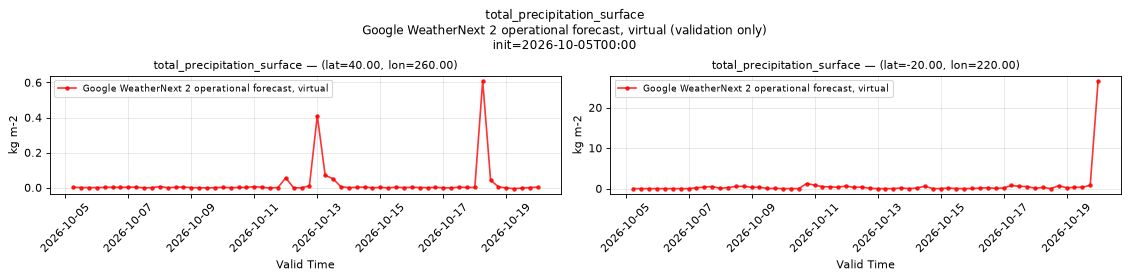
Temporal — init=2026-10-05T00:00
| Source | min | mean | max |
|---|---|---|---|
| P1 Validation | -0.005986 | 0.02117 | 0.6088 |
| P2 Validation | -0.003235 | 0.6795 | 26.57 |
Availability — 2633 of 2633 positions complete
wind_u_100m
Metadata
| Field | Value |
|---|---|
| units | m s-1 |
| long_name | 100 metre U wind component |
| short_name | 100u |
| standard_name | eastward_wind |
| step_type | instant |
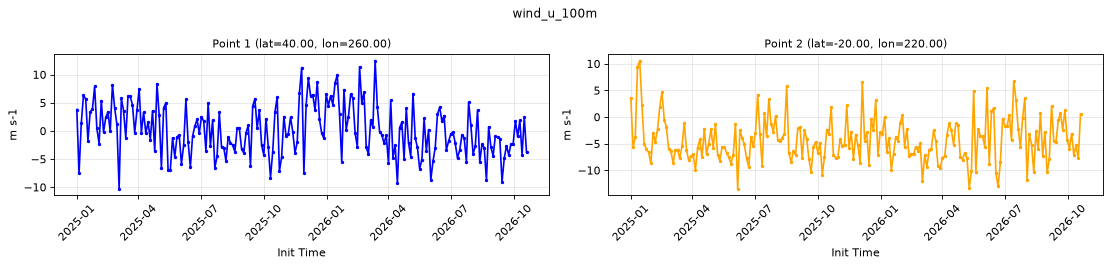
Point time series — 2025-01-01T00:00 - 2026-10-21T00:00, sampled lead=12h, member=0
| Point | min | mean | max |
|---|---|---|---|
| P1 | -10.3 | 0.1526 | 12.49 |
| P2 | -13.48 | -4.294 | 10.59 |
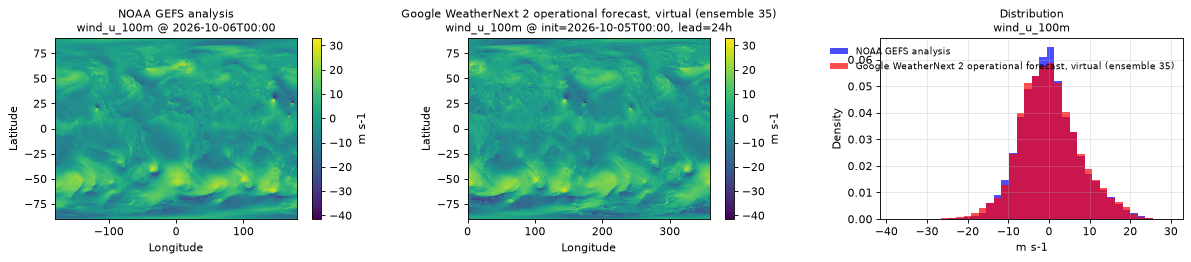
Spatial — init=2026-10-05T00:00, lead=24h (reference at 2026-10-06T00:00)
| Source | min | mean | max |
|---|---|---|---|
| Validation | -38.97 | 0.1488 | 33.04 |
| Reference | -41.5 | 0.2017 | 31.25 |
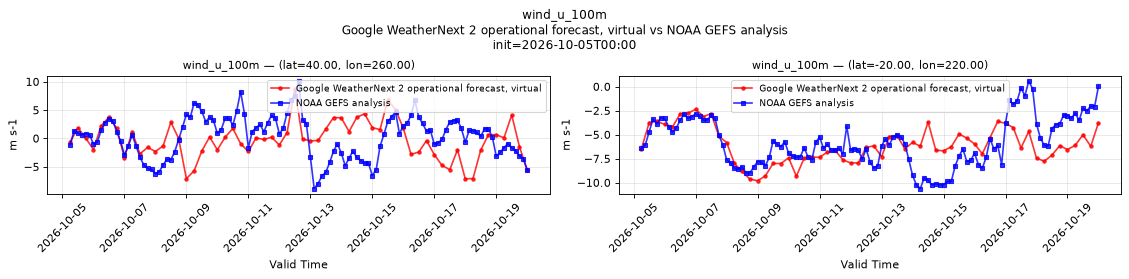
Temporal — init=2026-10-05T00:00
| Source | min | mean | max |
|---|---|---|---|
| P1 Validation | -7.139 | -0.2404 | 8.736 |
| P1 Reference | -8.875 | 0.2367 | 10.12 |
| P2 Validation | -9.807 | -6.065 | -2.359 |
| P2 Reference | -10.62 | -5.811 | 0.5859 |
Availability — 2633 of 2633 positions complete
wind_u_10m
Metadata
| Field | Value |
|---|---|
| units | m s-1 |
| long_name | 10 metre U wind component |
| short_name | 10u |
| standard_name | eastward_wind |
| step_type | instant |
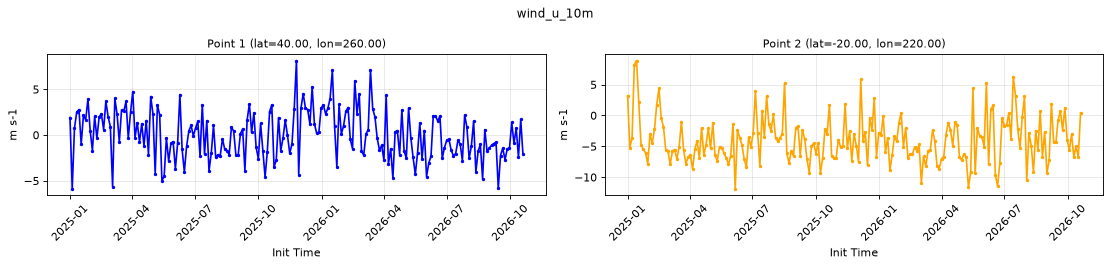
Point time series — 2025-01-01T00:00 - 2026-10-21T00:00, sampled lead=12h, member=0
| Point | min | mean | max |
|---|---|---|---|
| P1 | -5.89 | 0.01848 | 8.137 |
| P2 | -11.88 | -3.934 | 8.882 |
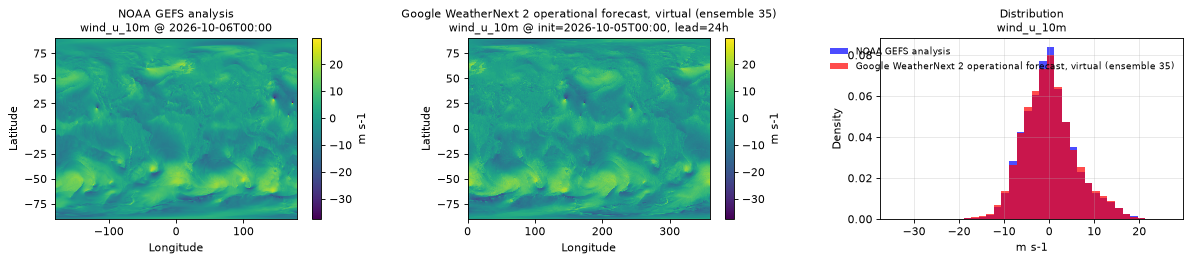
Spatial — init=2026-10-05T00:00, lead=24h (reference at 2026-10-06T00:00)
| Source | min | mean | max |
|---|---|---|---|
| Validation | -28.45 | 0.1069 | 25.9 |
| Reference | -37.5 | 0.1493 | 29.75 |
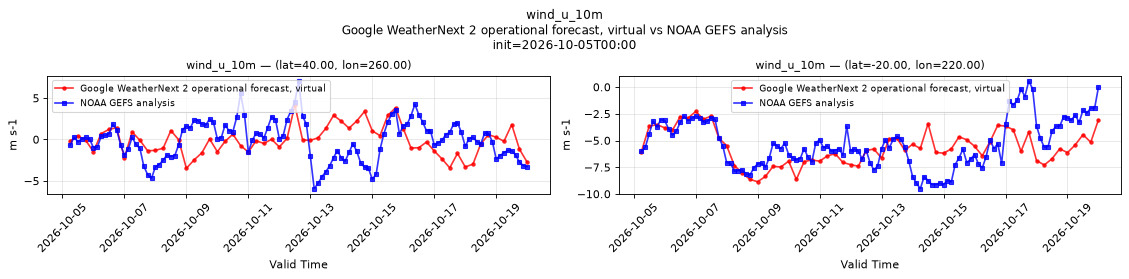
Temporal — init=2026-10-05T00:00
| Source | min | mean | max |
|---|---|---|---|
| P1 Validation | -3.489 | -0.1148 | 4.133 |
| P1 Reference | -5.938 | -0.1071 | 7.062 |
| P2 Validation | -8.856 | -5.623 | -2.285 |
| P2 Reference | -9.5 | -5.29 | 0.5703 |
Availability — 2633 of 2633 positions complete
wind_v_100m
Metadata
| Field | Value |
|---|---|
| units | m s-1 |
| long_name | 100 metre V wind component |
| short_name | 100v |
| standard_name | northward_wind |
| step_type | instant |
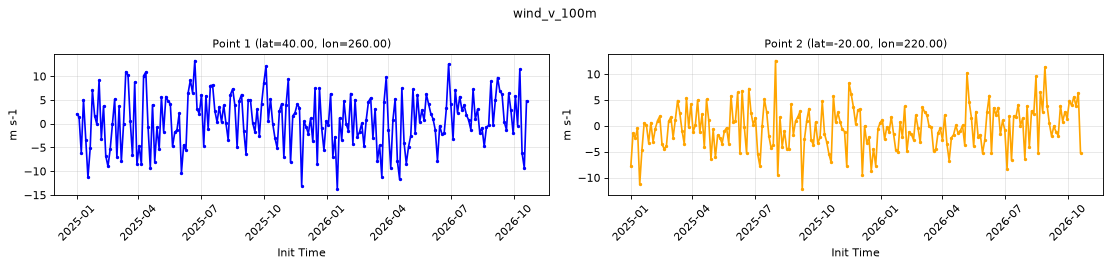
Point time series — 2025-01-01T00:00 - 2026-10-21T00:00, sampled lead=12h, member=0
| Point | min | mean | max |
|---|---|---|---|
| P1 | -13.73 | 0.687 | 13.3 |
| P2 | -12.17 | -0.3539 | 12.61 |
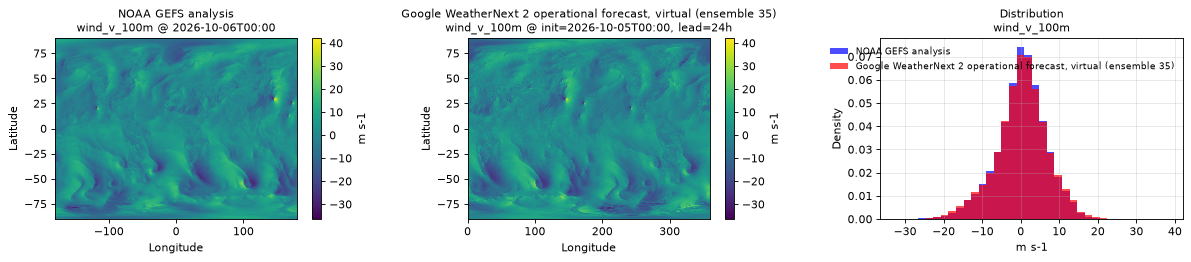
Spatial — init=2026-10-05T00:00, lead=24h (reference at 2026-10-06T00:00)
| Source | min | mean | max |
|---|---|---|---|
| Validation | -36.43 | 0.2264 | 42.14 |
| Reference | -32.5 | 0.1923 | 41.5 |
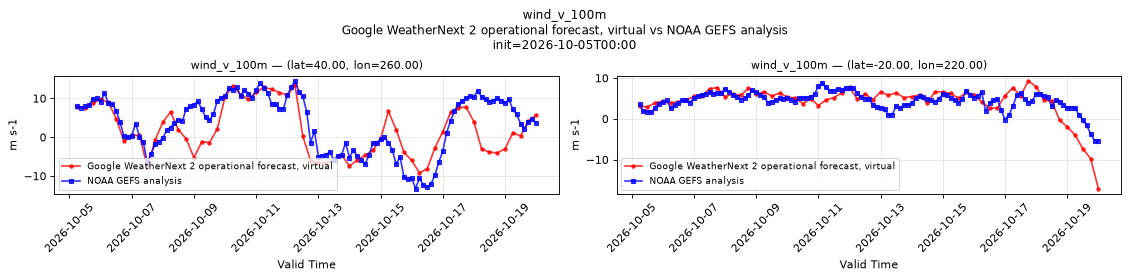
Temporal — init=2026-10-05T00:00
| Source | min | mean | max |
|---|---|---|---|
| P1 Validation | -9.177 | 1.898 | 13.35 |
| P1 Reference | -13.25 | 3.401 | 14.5 |
| P2 Validation | -17.09 | 4.254 | 9.29 |
| P2 Reference | -5.312 | 4.399 | 8.875 |
Availability — 2633 of 2633 positions complete
wind_v_10m
Metadata
| Field | Value |
|---|---|
| units | m s-1 |
| long_name | 10 metre V wind component |
| short_name | 10v |
| standard_name | northward_wind |
| step_type | instant |
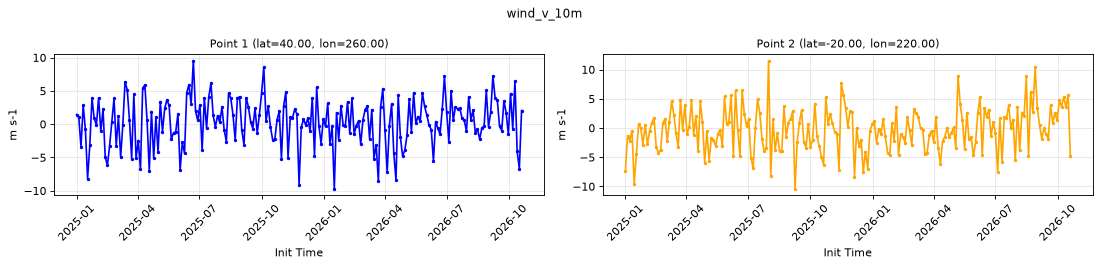
Point time series — 2025-01-01T00:00 - 2026-10-21T00:00, sampled lead=12h, member=0
| Point | min | mean | max |
|---|---|---|---|
| P1 | -9.714 | 0.3208 | 9.555 |
| P2 | -10.41 | -0.2957 | 11.54 |
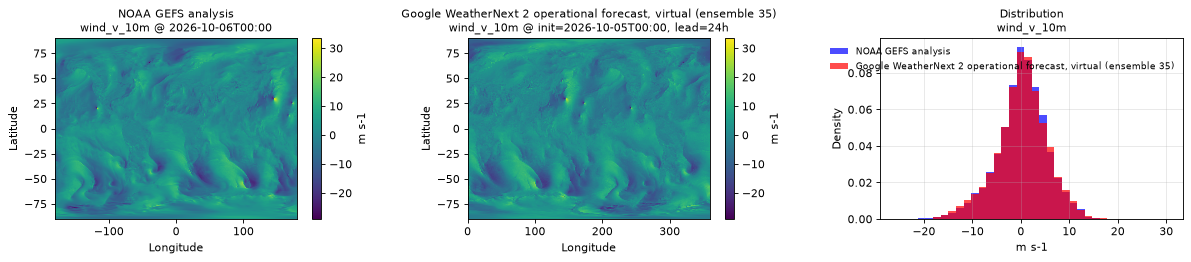
Spatial — init=2026-10-05T00:00, lead=24h (reference at 2026-10-06T00:00)
| Source | min | mean | max |
|---|---|---|---|
| Validation | -27.77 | 0.2358 | 31.36 |
| Reference | -29 | 0.207 | 33.5 |
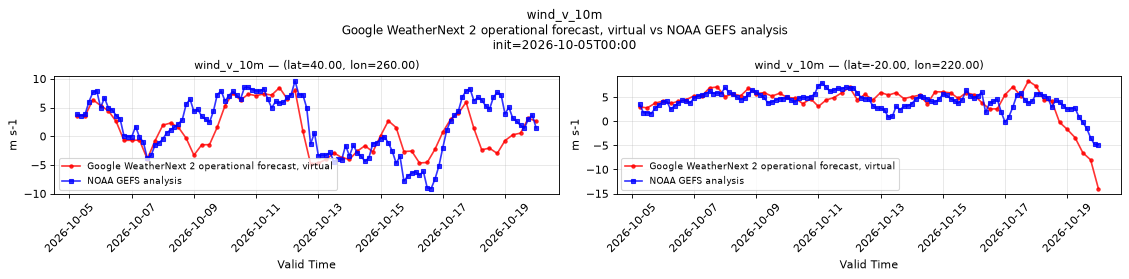
Temporal — init=2026-10-05T00:00
| Source | min | mean | max |
|---|---|---|---|
| P1 Validation | -4.821 | 1.019 | 8.453 |
| P1 Reference | -9.125 | 2.021 | 9.625 |
| P2 Validation | -13.98 | 4.027 | 8.358 |
| P2 Reference | -4.875 | 4.117 | 7.938 |
Availability — 2633 of 2633 positions complete