ECMWF IFS ENS forecast, 6 day, 0.25 degree, virtual validation report
This dataset validation report plots a sample of values from the ECMWF IFS ENS forecast, 6 day, 0.25 degree, virtual dataset over time and across space, comparing where possible to a previously validated reference dataset. It also reports the quantity of unavailable values and their associated timestamps. These analyses are one layer of a multi-layered dataset validation process we perform at dynamical.org and also provide users a preview of the dataset contents.
Report generation start time: 2026-11-11T15:07:23 UTC
Summary
This dataset has been reviewed and is ready for use.
What looks good
- All expected source files and variable references are present except the one file noted below. Every partial-coverage variable starts or ends exactly at its documented date.
- Values match the source. Independent decodes of source GRIB messages (temperature, humidity, wind, soil temperature) agree with the store to 1e-6.
- Maps are correct for every variable, for the main member and a second one (member 23).
- Variables are physically consistent with one another. Dew point ≤ temperature, gust ≥ 10 m wind, 100 m wind > 10 m wind, geopotential = 9.80665 × geopotential height, vorticity and divergence agree with the winds, and cloud layers are consistent with total cloud.
- Run totals start at 0 and grow with lead time, and static fields are present for the control member at lead 0.
Review notes
Unavailable data
- Initialization 2024-09-18T06, lead 111 hours is missing for all variables and members. The source's index for that file does not match its data, so it cannot be read. Unavailable timestamps.
Variable coverage
- Some variables cover only part of the archive, matching when ECMWF open data started or stopped publishing them. Initializations outside a variable's range hold NaN.
- From 2024-10-24T12:
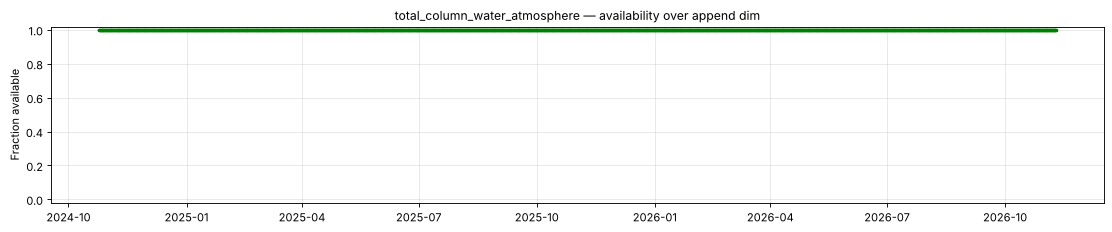
total_column_water_atmosphere. - From 2024-11-12T06:
wind_gust_10m,maximum_temperature_2m,minimum_temperature_2m,categorical_precipitation_type_surface,precipitation_rate_surface,most_unstable_convective_available_potential_energy_surface, both turbulent surface stress run totals,sea_ice_thickness_surface,sea_surface_height, and sea water velocity u and v. - Through 2024-11-12T00 only:
convective_available_potential_energy_surface, whichmost_unstable_convective_available_potential_energy_surfacereplaces. - From 2025-11-20T12:
total_cloud_cover_atmosphere,snowfall_water_equivalent_run_total_surface,snow_water_equivalent_surface. - From 2026-02-11T12:
snow_density_surface. - From 2026-05-12T06 (control member 0 only):
geopotential_height_surface,standard_deviation_of_sub_gridscale_orography_surface,slope_of_sub_gridscale_orography_surface(lead 0 only) andpressure_level/geopotential. - From 2026-10-20T06:
low_cloud_cover,medium_cloud_cover,high_cloud_cover,convective_precipitation_run_total_surface, and total column cloud ice, cloud liquid and rain water.
- From 2024-10-24T12:
- Not every pressure level covers the whole archive. 100, 150, 400 and 600 hPa start at 2025-01-14T06, and 10 hPa starts at 2026-05-12T06. Earlier initializations hold NaN at those levels.
Source changes over time
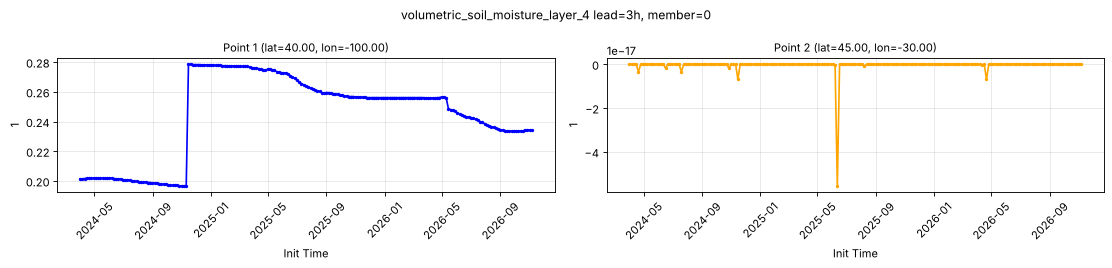
- ECMWF model upgrades at 2024-11-12T06 (IFS cycle 49r1) and 2026-05-12T06 (cycle 50r1) cause step changes in soil temperature and soil moisture, and at 2026-05-12T06 in sea surface height. Account for these steps when computing climatologies or trends across those dates.
Datasets
| Role | Name | ID | Version | URL |
|---|---|---|---|---|
| Validation | ECMWF IFS ENS forecast, 6 day, 0.25 degree, virtual | ecmwf-ifs-ens-forecast-6-day-0-25-degree-virtual |
v0.1.0 |
s3://dynamical-ecmwf-ifs-ens/ecmwf-ifs-ens-forecast-6-day-0-25-degree-virtual/v0.1.0.icechunk |
| Reference | NOAA GEFS analysis | noaa-gefs-analysis |
0.1.2 |
s3://dynamical-noaa-gefs/noaa-gefs-analysis/v0.1.2.icechunk/ |
Run parameters
| Parameter | Value |
|---|---|
| Validation dataset type | forecast |
| Validation time range | init_time 2024-04-01T00:00 → 2026-11-09T18:00 |
| Reference time range | time 2000-01-01T00:00 → 2026-11-11T09:00 |
| Point 1 | lat=40.0000, lon=-100.0000 |
| Point 2 | lat=45.0000, lon=-30.0000 |
| Ensemble member | 30 |
| Spatial comparison time | init=2026-10-25T00:00, lead=102h (member, lead and reference time recorded per variable) |
| Timeseries period | init=2026-10-25T00:00 |
| Vertical level | middle level per vertical dim |
| Store type | virtual — availability manifest-probed; value series sampled |
| Additional member check | All variables inspected at member 23, initialization 2026-11-02T00:00, lead 138 hours. |
Availability
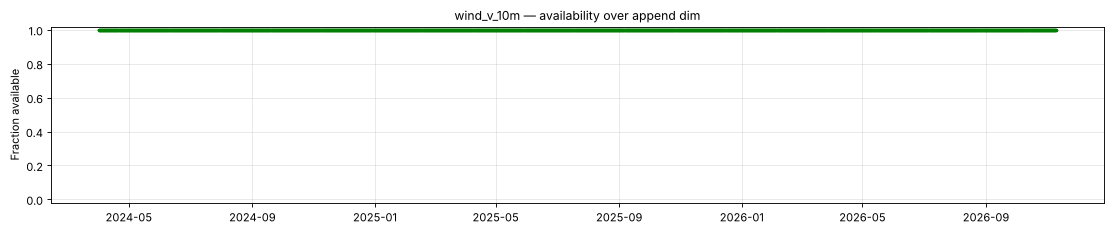
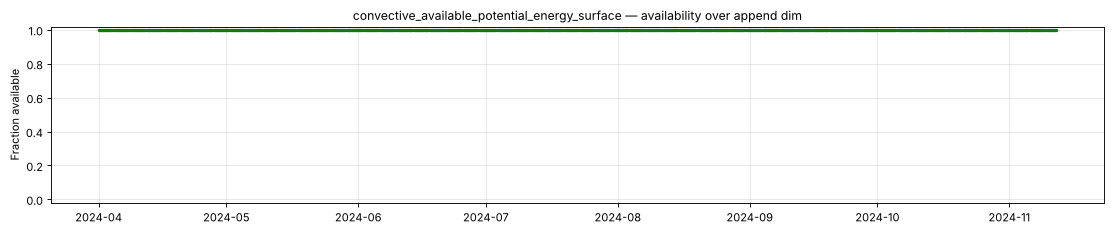
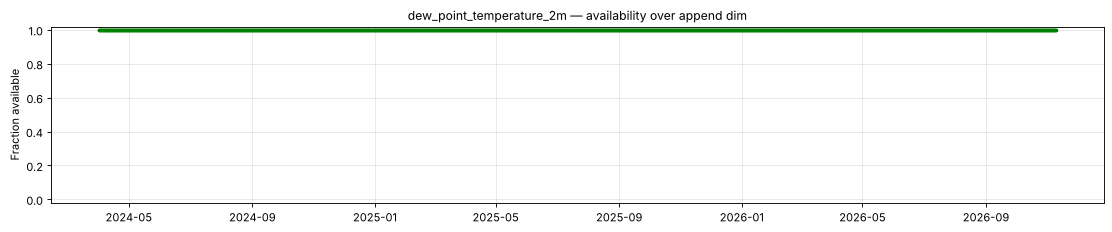
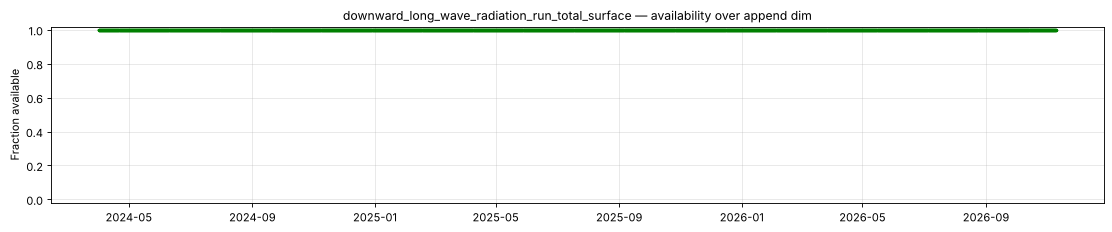
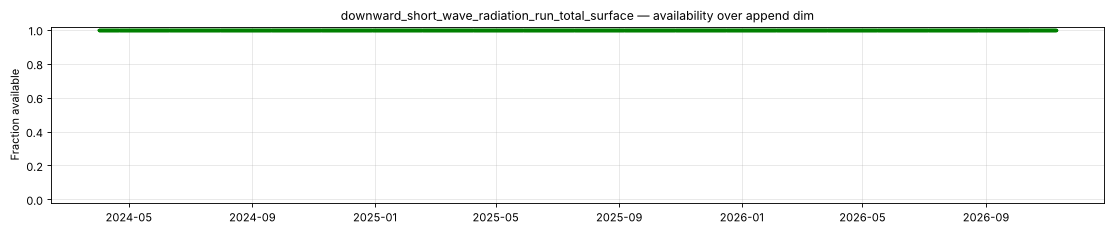
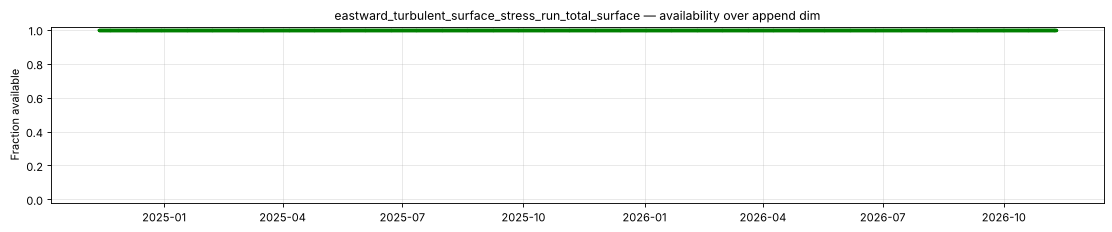
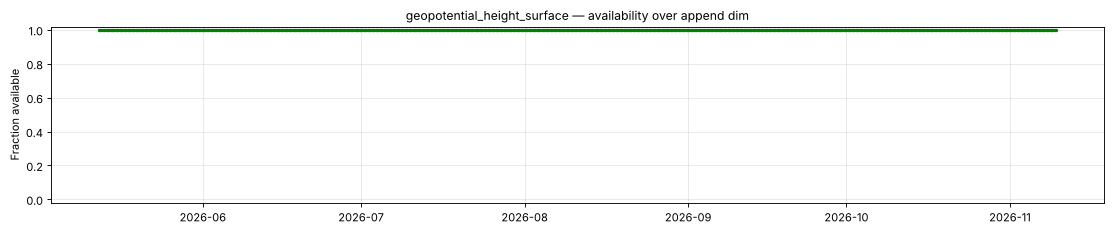
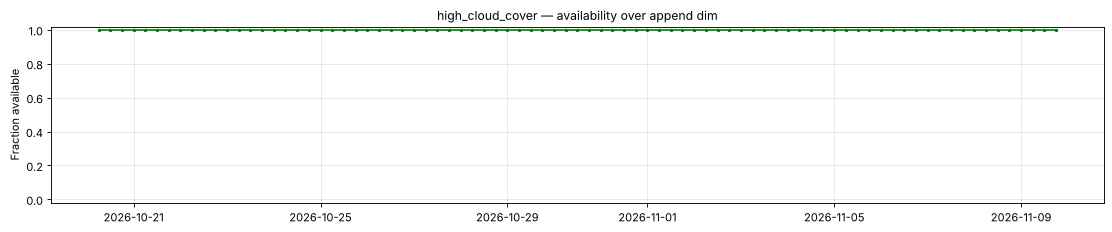
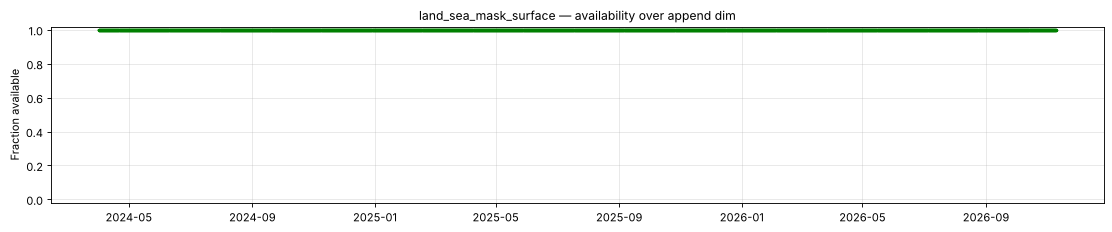
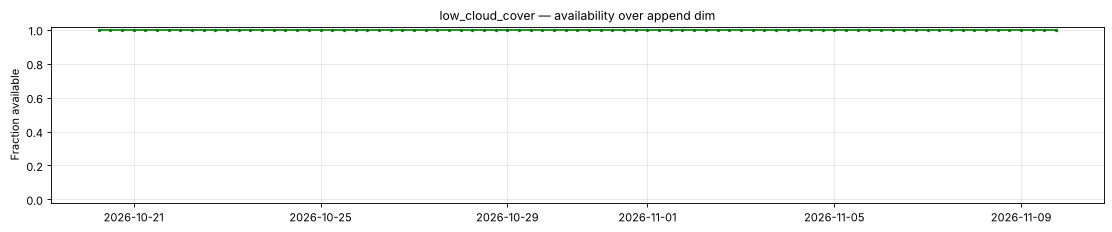
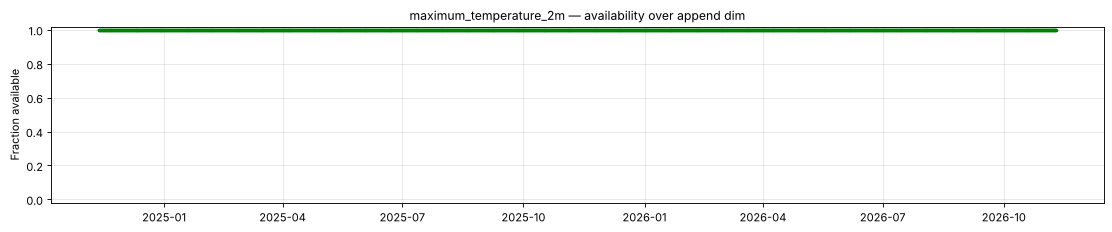
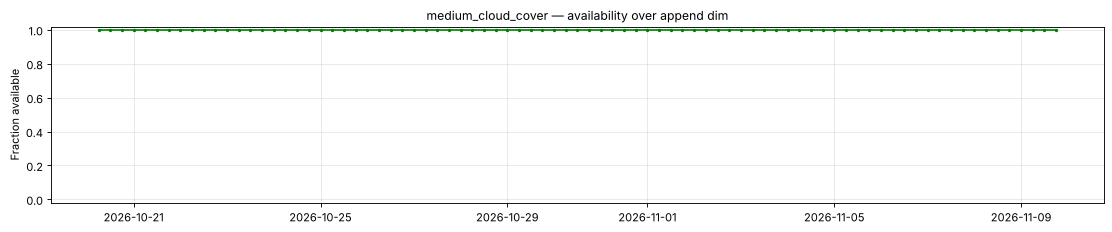
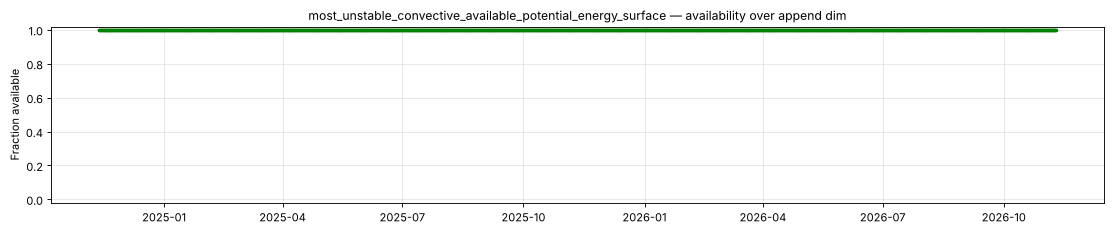
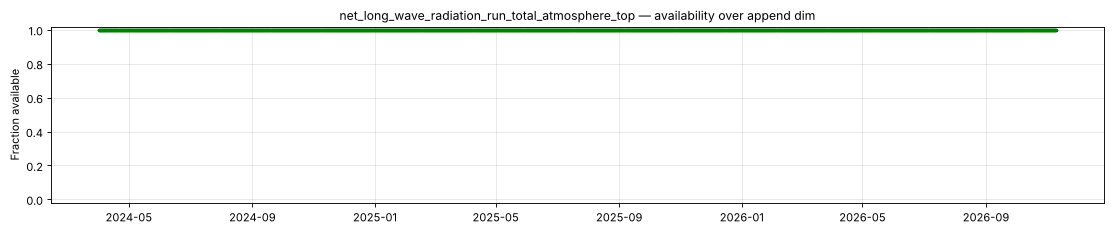
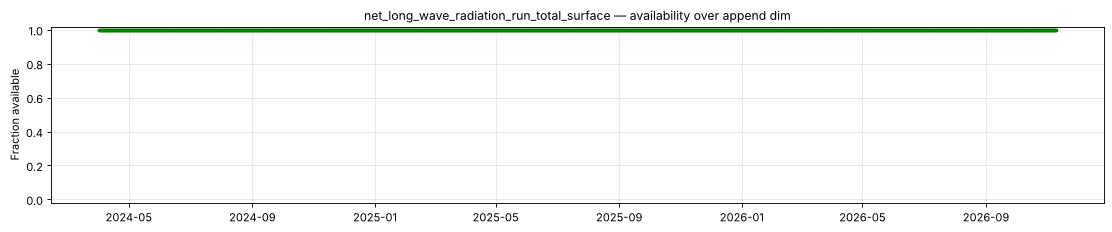
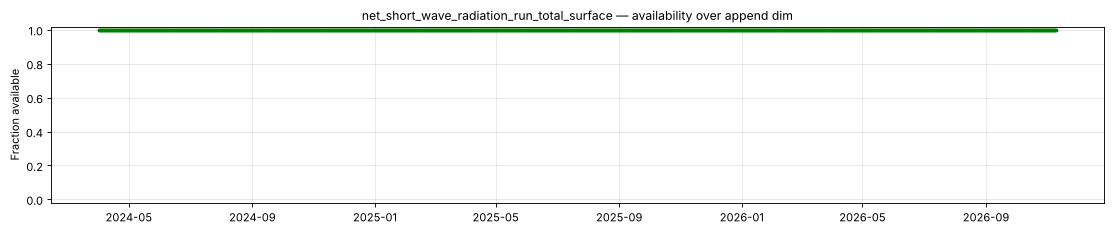
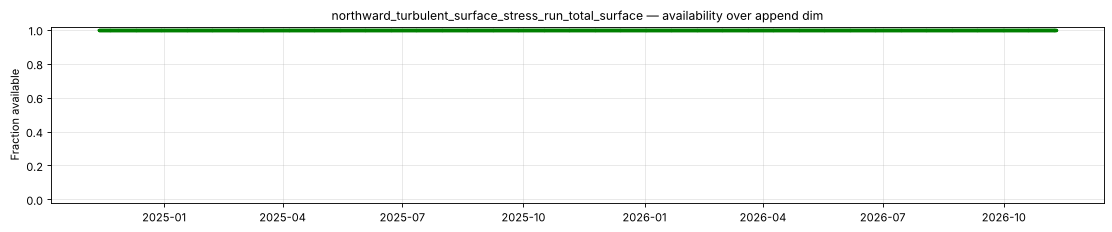
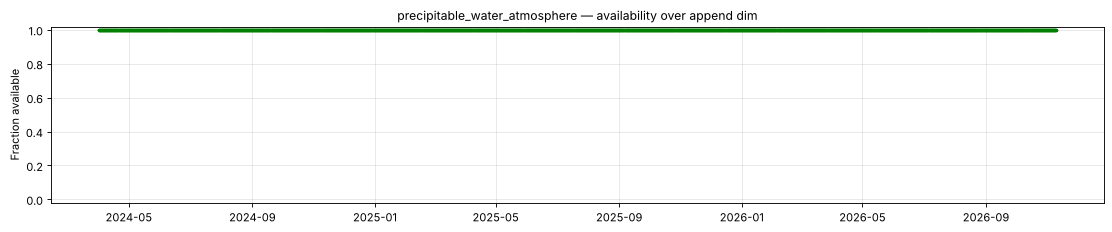
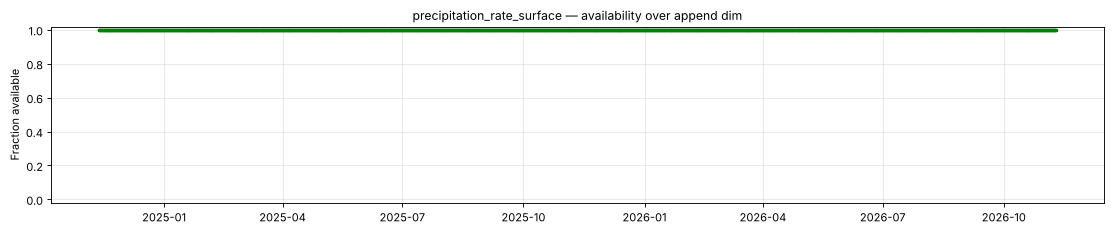
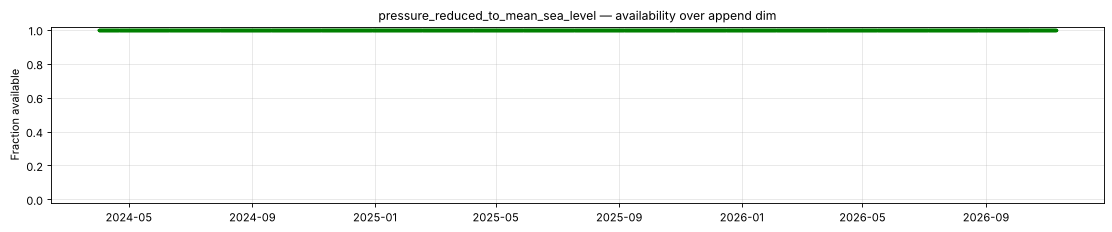
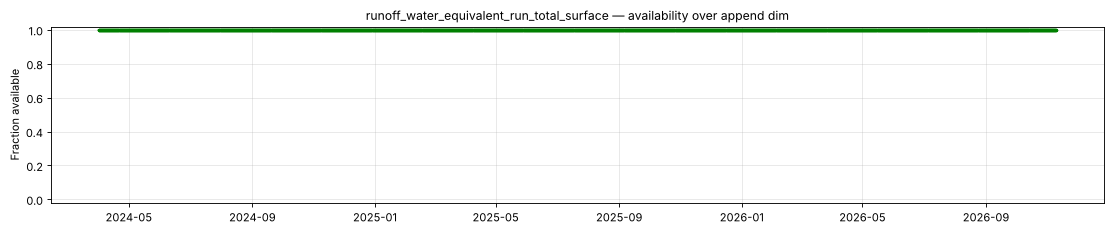
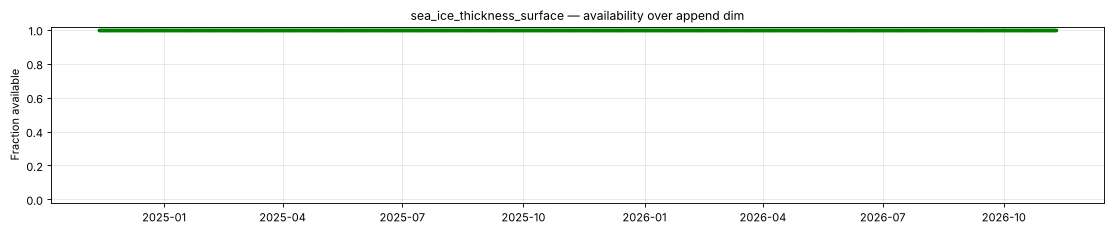
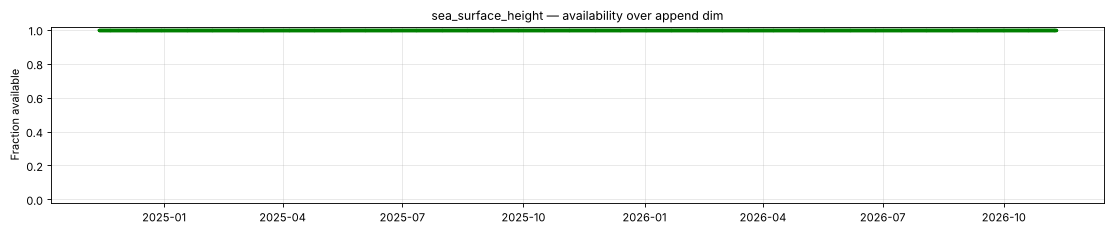
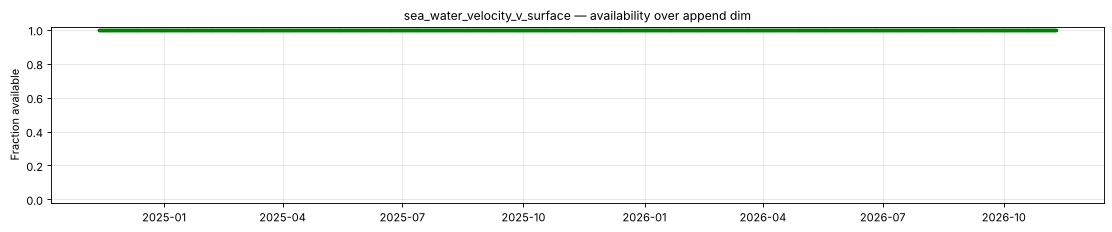
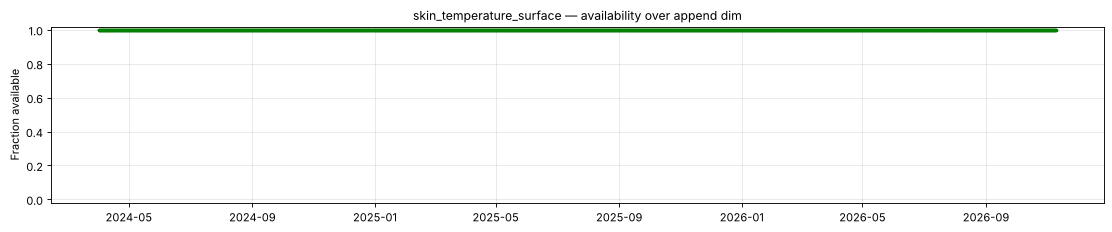
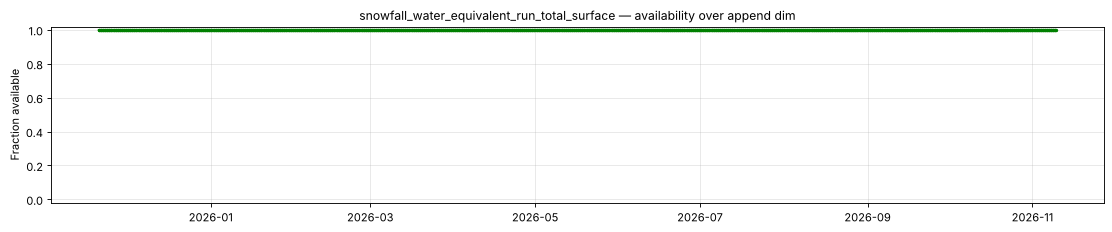
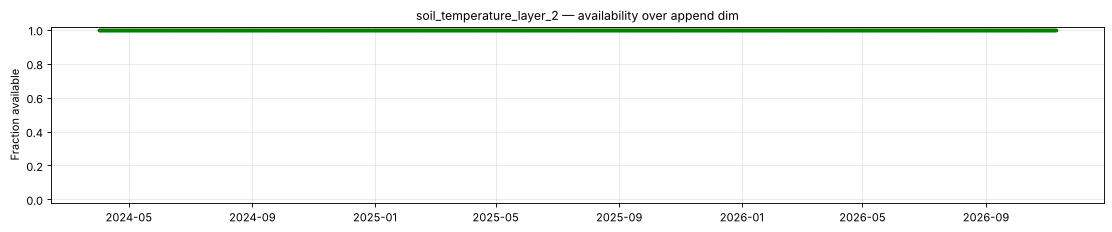
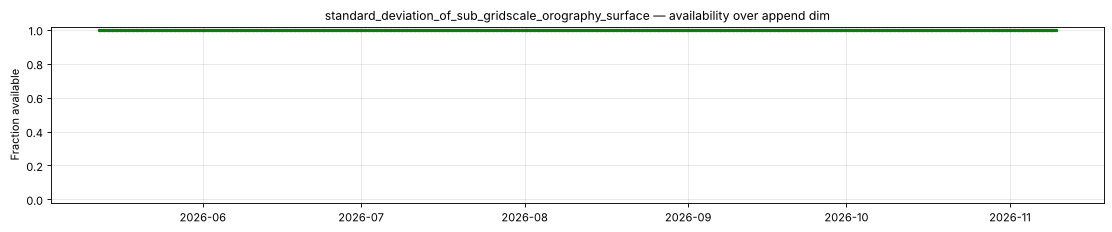
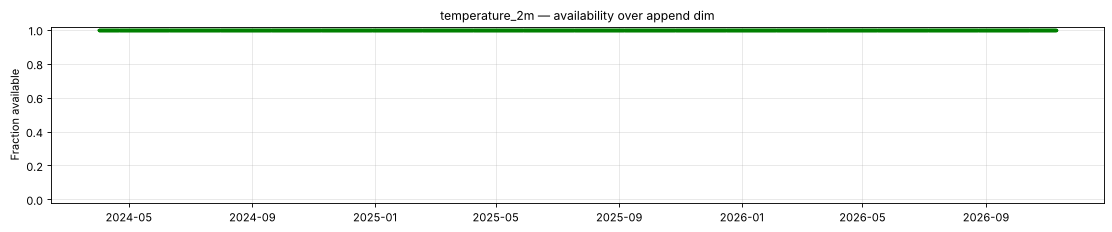
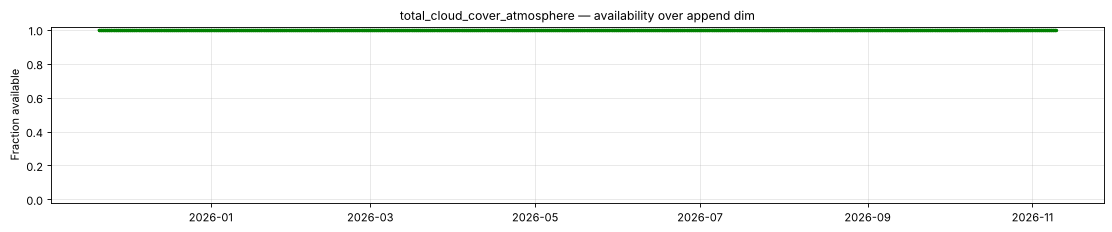
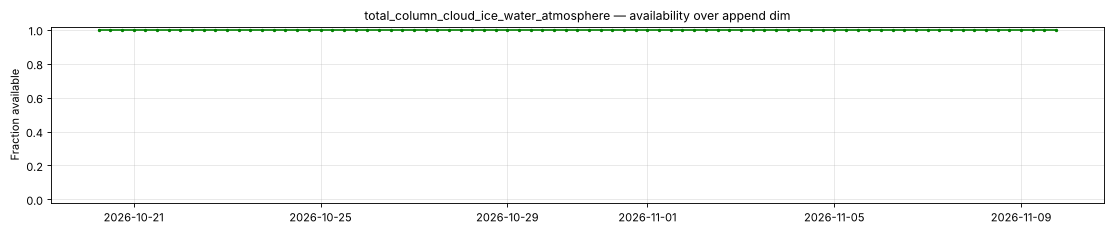
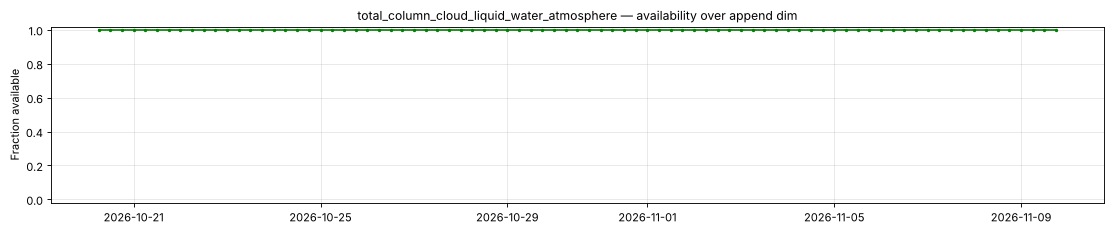
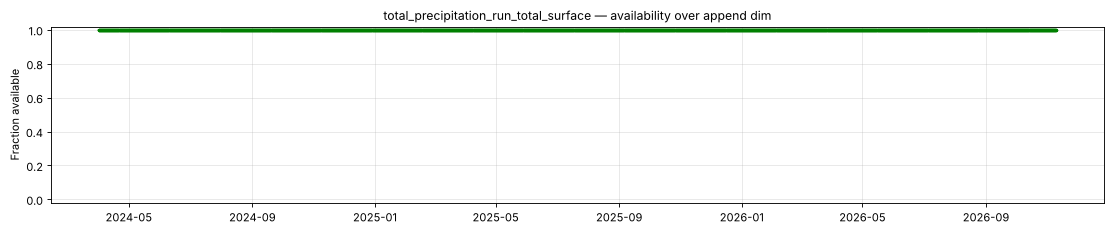
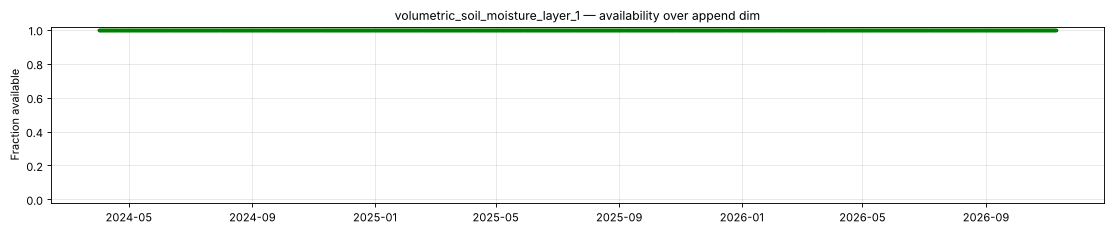
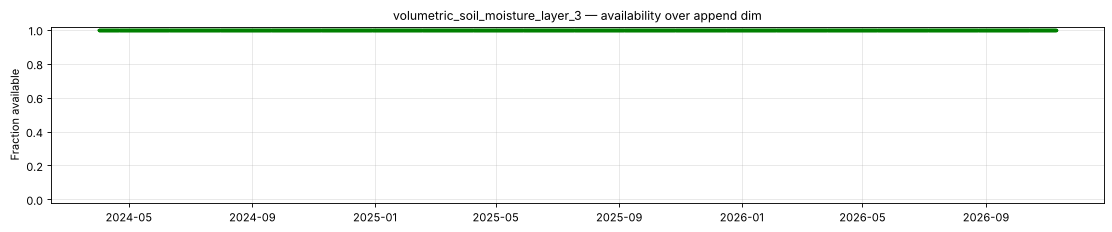
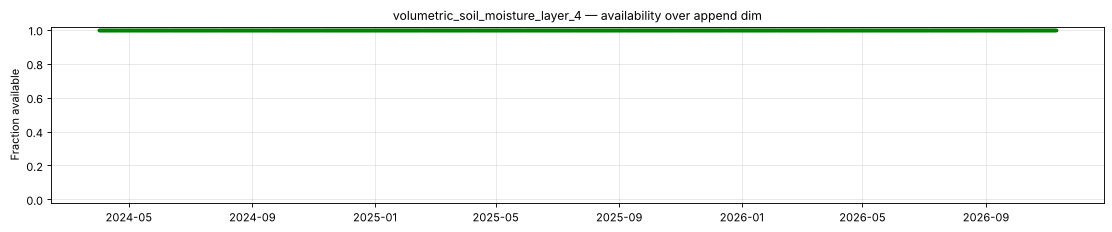
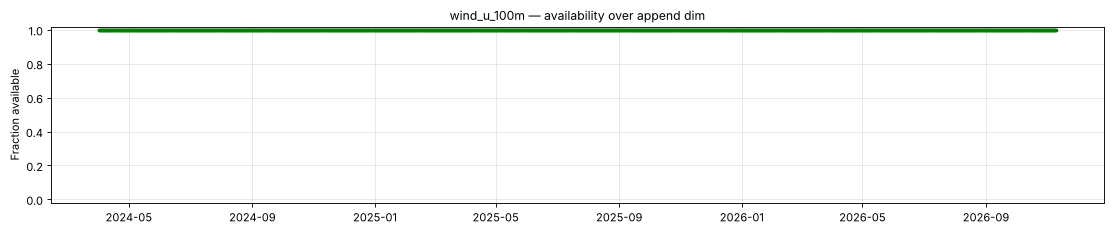
The plot below shows the availability of each variable over time — light red marks unavailable data, dark green marks present data.
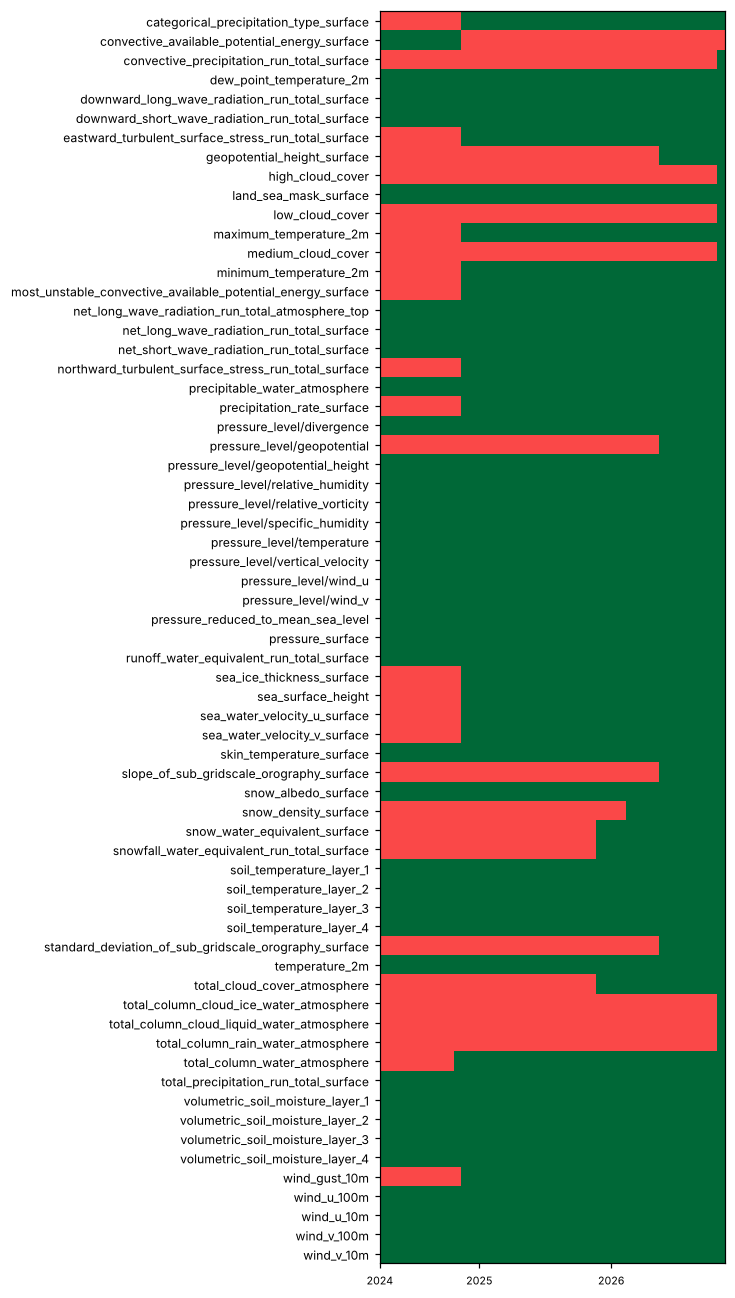
| Variable | Complete positions | Incomplete % | First incomplete | Last incomplete |
|---|---|---|---|---|
categorical_precipitation_type_surface |
2911/3812 | 23.64% | 2024-04-01T00:00 | 2024-11-12T00:00 |
convective_available_potential_energy_surface |
901/3812 | 76.36% | 2024-11-12T06:00 | 2026-11-09T18:00 |
convective_precipitation_run_total_surface |
83/3812 | 97.82% | 2024-04-01T00:00 | 2026-10-20T00:00 |
eastward_turbulent_surface_stress_run_total_surface |
2911/3812 | 23.64% | 2024-04-01T00:00 | 2024-11-12T00:00 |
geopotential_height_surface |
727/3812 | 80.93% | 2024-04-01T00:00 | 2026-05-12T00:00 |
high_cloud_cover |
83/3812 | 97.82% | 2024-04-01T00:00 | 2026-10-20T00:00 |
low_cloud_cover |
83/3812 | 97.82% | 2024-04-01T00:00 | 2026-10-20T00:00 |
maximum_temperature_2m |
2911/3812 | 23.64% | 2024-04-01T00:00 | 2024-11-12T00:00 |
medium_cloud_cover |
83/3812 | 97.82% | 2024-04-01T00:00 | 2026-10-20T00:00 |
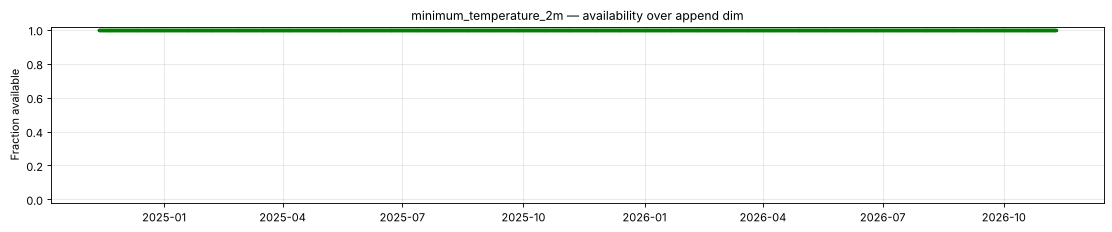
minimum_temperature_2m |
2911/3812 | 23.64% | 2024-04-01T00:00 | 2024-11-12T00:00 |
most_unstable_convective_available_potential_energy_surface |
2911/3812 | 23.64% | 2024-04-01T00:00 | 2024-11-12T00:00 |
northward_turbulent_surface_stress_run_total_surface |
2911/3812 | 23.64% | 2024-04-01T00:00 | 2024-11-12T00:00 |
precipitation_rate_surface |
2911/3812 | 23.64% | 2024-04-01T00:00 | 2024-11-12T00:00 |
pressure_level/geopotential |
727/3812 | 80.93% | 2024-04-01T00:00 | 2026-05-12T00:00 |
sea_ice_thickness_surface |
2911/3812 | 23.64% | 2024-04-01T00:00 | 2024-11-12T00:00 |
sea_surface_height |
2911/3812 | 23.64% | 2024-04-01T00:00 | 2024-11-12T00:00 |
sea_water_velocity_u_surface |
2911/3812 | 23.64% | 2024-04-01T00:00 | 2024-11-12T00:00 |
sea_water_velocity_v_surface |
2911/3812 | 23.64% | 2024-04-01T00:00 | 2024-11-12T00:00 |
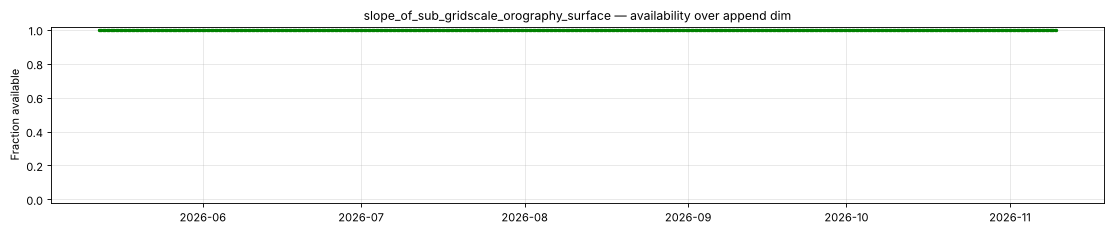
slope_of_sub_gridscale_orography_surface |
727/3812 | 80.93% | 2024-04-01T00:00 | 2026-05-12T00:00 |
snow_density_surface |
1086/3812 | 71.51% | 2024-04-01T00:00 | 2026-02-11T06:00 |
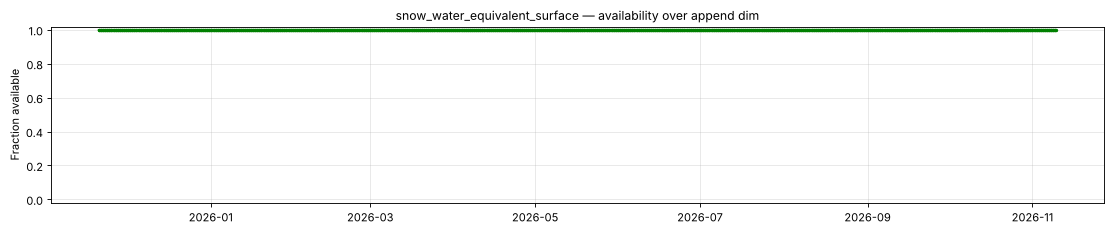
snow_water_equivalent_surface |
1418/3812 | 62.80% | 2024-04-01T00:00 | 2025-11-20T06:00 |
snowfall_water_equivalent_run_total_surface |
1418/3812 | 62.80% | 2024-04-01T00:00 | 2025-11-20T06:00 |
standard_deviation_of_sub_gridscale_orography_surface |
727/3812 | 80.93% | 2024-04-01T00:00 | 2026-05-12T00:00 |
total_cloud_cover_atmosphere |
1418/3812 | 62.80% | 2024-04-01T00:00 | 2025-11-20T06:00 |
total_column_cloud_ice_water_atmosphere |
83/3812 | 97.82% | 2024-04-01T00:00 | 2026-10-20T00:00 |
total_column_cloud_liquid_water_atmosphere |
83/3812 | 97.82% | 2024-04-01T00:00 | 2026-10-20T00:00 |
total_column_rain_water_atmosphere |
83/3812 | 97.82% | 2024-04-01T00:00 | 2026-10-20T00:00 |
total_column_water_atmosphere |
2986/3812 | 21.67% | 2024-04-01T00:00 | 2024-10-24T06:00 |
wind_gust_10m |
2911/3812 | 23.64% | 2024-04-01T00:00 | 2024-11-12T00:00 |
- Unavailable timestamps:
unavailable_timestamps.txt
Decode health
5855 references decoded successfully, sampled across 20 of 3812 append-dim regions, 5 leads and up to 2 present levels per group variable.
Per-variable details
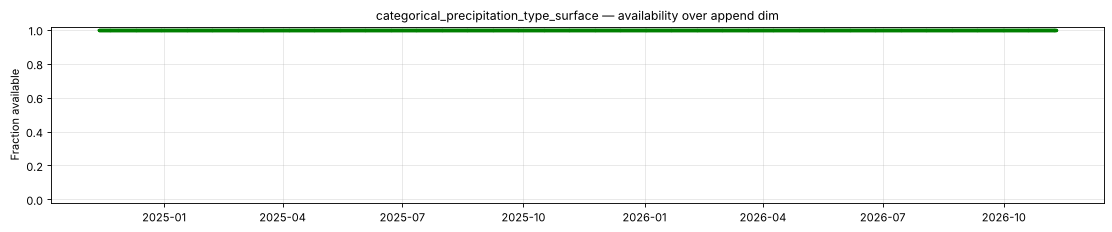
categorical_precipitation_type_surface
Metadata
| Field | Value |
|---|---|
| units | 1 |
| long_name | Precipitation type |
| short_name | ptype |
| standard_name | n/a |
| step_type | instant |
| flag_values | 0, 1, 2, 3, 4, 5, 6, 7, 8, 9, 10, 11, 12, 13, 14, 255 |
| flag_meanings | no_precipitation rain thunderstorm freezing_rain mixed_ice snow wet_snow mixture_of_rain_and_snow ice_pellets graupel hail drizzle freezing_drizzle hail_less_than_5mm hail_greater_than_or_equal_to_5mm missing |
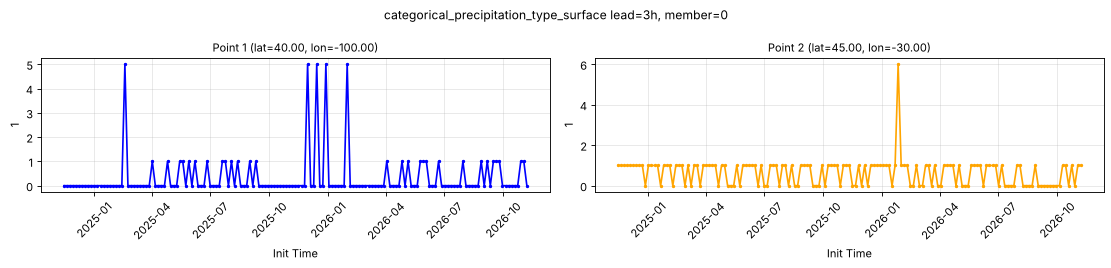
Point time series — 2024-04-01T00:00 - 2026-11-09T18:00, sampled lead=3h, member=0
| Point | min | mean | max |
|---|---|---|---|
| P1 | 0 | 0.3464 | 5 |
| P2 | 0 | 0.6471 | 6 |
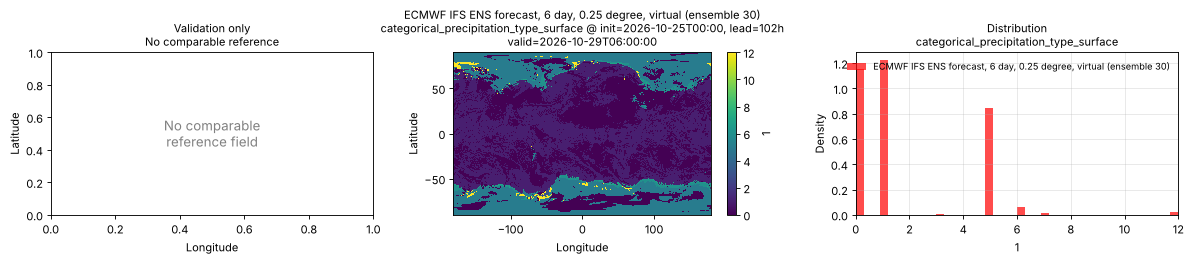
Spatial — init=2026-10-25T00:00, lead=102h, valid=2026-10-29T06:00:00, member=30 (reference not available)
| Source | min | mean | max |
|---|---|---|---|
| Validation | 0 | 1.874 | 12 |
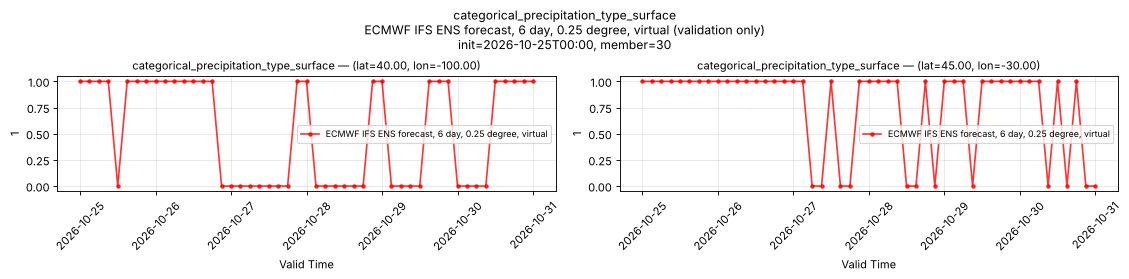
Temporal — init=2026-10-25T00:00, member=30
| Source | min | mean | max |
|---|---|---|---|
| P1 Validation | 0 | 0.5306 | 1 |
| P2 Validation | 0 | 0.7551 | 1 |
Availability — 2911 of 3812 positions complete (incomplete 2024-04-01T00:00 → 2024-11-12T00:00)
convective_available_potential_energy_surface
Metadata
| Field | Value |
|---|---|
| units | J kg-1 |
| long_name | Convective available potential energy |
| short_name | cape |
| standard_name | atmosphere_convective_available_potential_energy |
| step_type | instant |
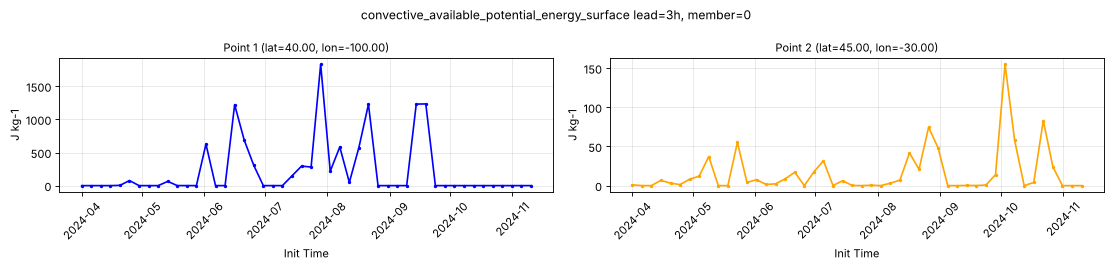
Point time series — 2024-04-01T00:00 - 2026-11-09T18:00, sampled lead=3h, member=0
| Point | min | mean | max |
|---|---|---|---|
| P1 | 0 | 222.1 | 1832 |
| P2 | 0 | 15.76 | 155 |
Spatial — init=2026-10-25T00:00, lead=102h, valid=2026-10-29T06:00:00, member=30 (reference not available)
| Source | min | mean | max |
|---|---|---|---|
| Validation | NaN | NaN | NaN |
Temporal — init=2026-10-25T00:00, member=30
| Source | min | mean | max |
|---|---|---|---|
| P1 Validation | n/a | n/a | n/a |
| P2 Validation | n/a | n/a | n/a |
Availability — 901 of 3812 positions complete (incomplete 2024-11-12T06:00 → 2026-11-09T18:00)
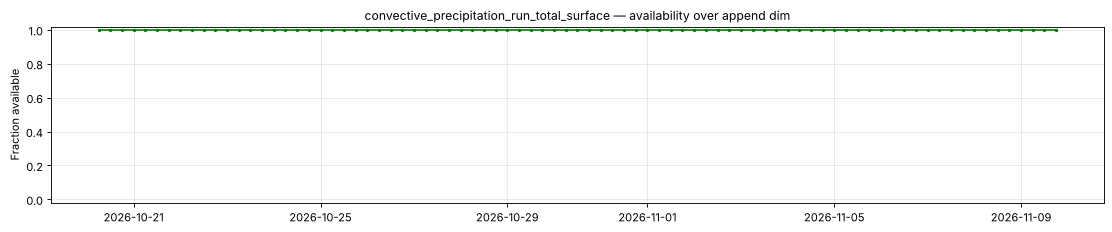
convective_precipitation_run_total_surface
Metadata
| Field | Value |
|---|---|
| units | kg m-2 |
| long_name | Convective precipitation |
| short_name | cp |
| standard_name | convective_precipitation_amount |
| step_type | accum |
| comment | Accumulated since forecast initialization. |
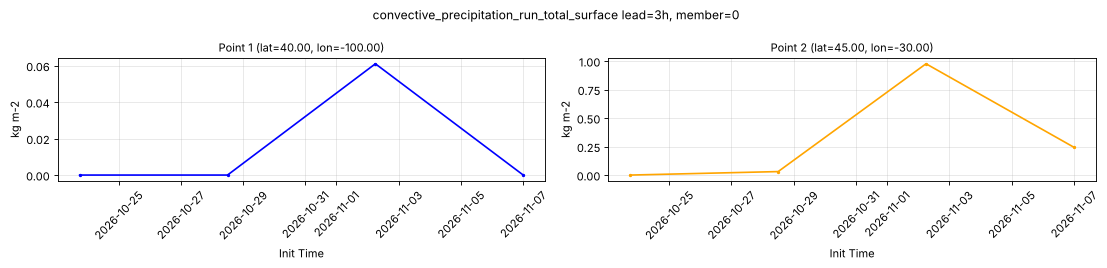
Point time series — 2024-04-01T00:00 - 2026-11-09T18:00, sampled lead=3h, member=0
| Point | min | mean | max |
|---|---|---|---|
| P1 | 0 | 0.01526 | 0.06104 |
| P2 | 0 | 0.3128 | 0.9766 |
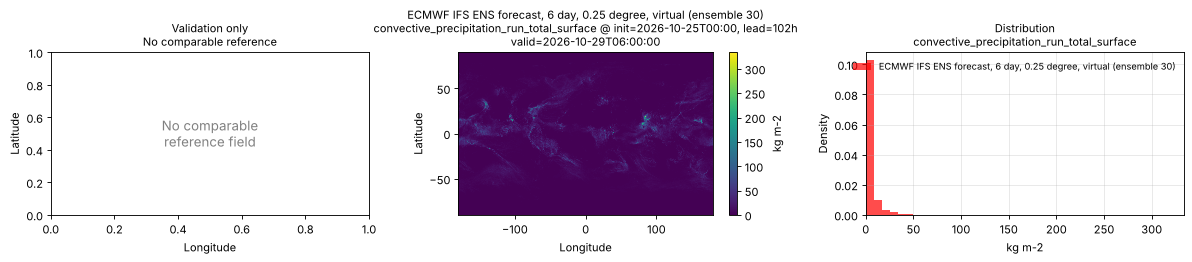
Spatial — init=2026-10-25T00:00, lead=102h, valid=2026-10-29T06:00:00, member=30 (reference not available)
| Source | min | mean | max |
|---|---|---|---|
| Validation | 0 | 3.996 | 333.9 |
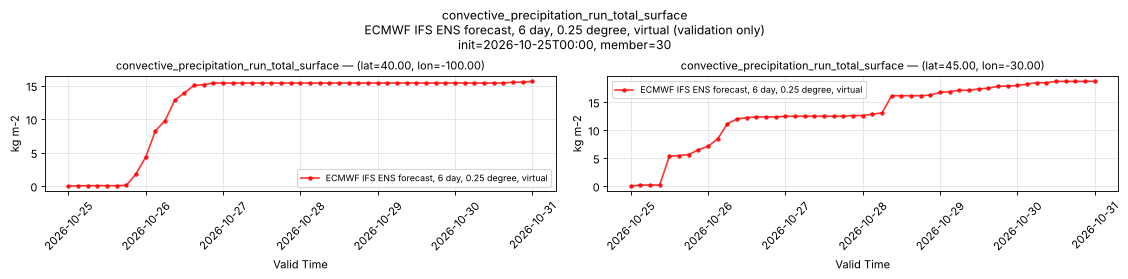
Temporal — init=2026-10-25T00:00, member=30
| Source | min | mean | max |
|---|---|---|---|
| P1 Validation | 0 | 12.34 | 15.62 |
| P2 Validation | 0 | 12.95 | 18.68 |
Availability — 83 of 3812 positions complete (incomplete 2024-04-01T00:00 → 2026-10-20T00:00)
dew_point_temperature_2m
Metadata
| Field | Value |
|---|---|
| units | degree_Celsius |
| long_name | 2 metre dewpoint temperature |
| short_name | 2d |
| standard_name | dew_point_temperature |
| step_type | instant |
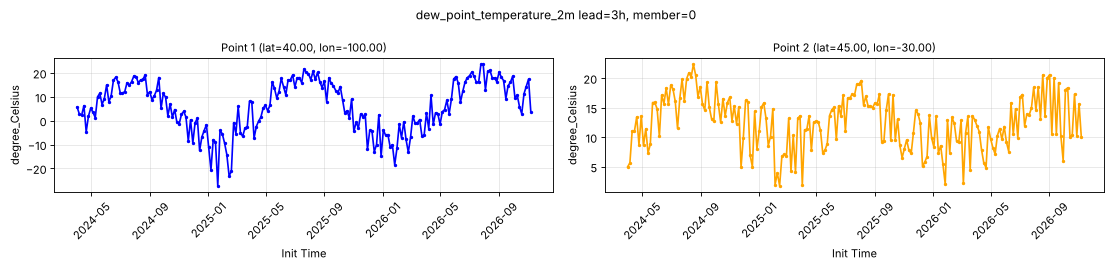
Point time series — 2024-04-01T00:00 - 2026-11-09T18:00, sampled lead=3h, member=0
| Point | min | mean | max |
|---|---|---|---|
| P1 | -27.28 | 5.985 | 23.65 |
| P2 | 1.776 | 12.46 | 22.37 |
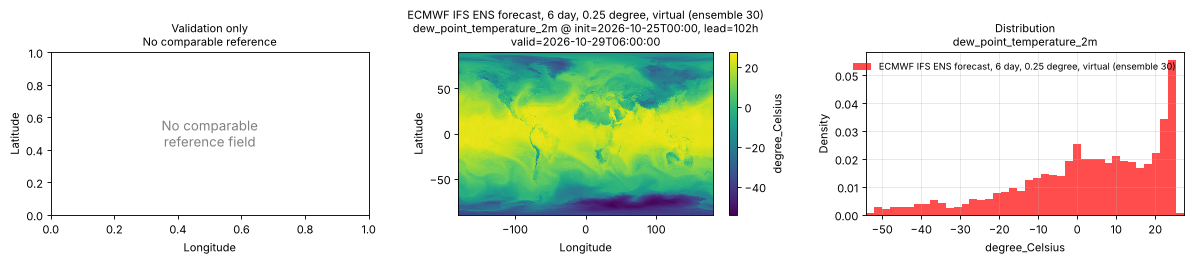
Spatial — init=2026-10-25T00:00, lead=102h, valid=2026-10-29T06:00:00, member=30 (reference not available)
| Source | min | mean | max |
|---|---|---|---|
| Validation | -54.12 | 2.162 | 27.38 |
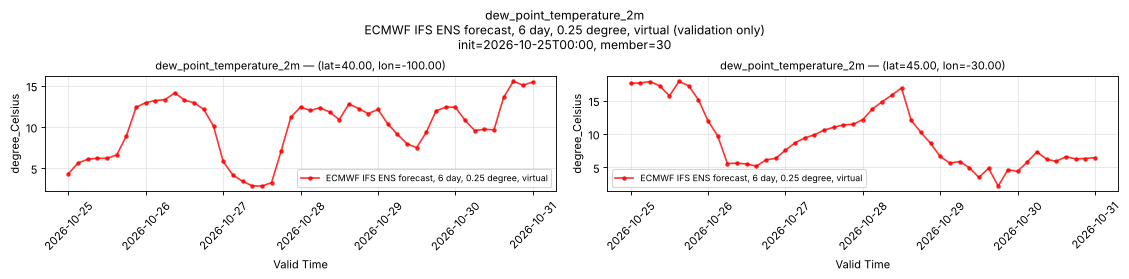
Temporal — init=2026-10-25T00:00, member=30
| Source | min | mean | max |
|---|---|---|---|
| P1 Validation | 2.845 | 9.963 | 15.54 |
| P2 Validation | 2.209 | 9.601 | 17.88 |
Availability — 3812 of 3812 positions complete
downward_long_wave_radiation_run_total_surface
Metadata
| Field | Value |
|---|---|
| units | W s m-2 |
| long_name | Surface long-wave (thermal) radiation downwards |
| short_name | strd |
| standard_name | integral_wrt_time_of_surface_downwelling_longwave_flux_in_air |
| step_type | accum |
| comment | Accumulated since forecast initialization. |
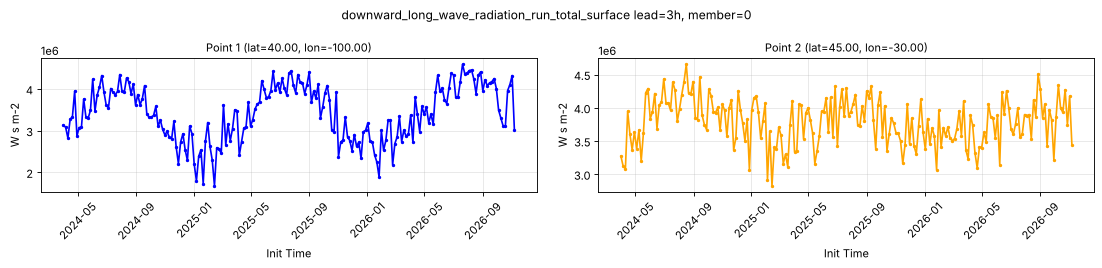
Point time series — 2024-04-01T00:00 - 2026-11-09T18:00, sampled lead=3h, member=0
| Point | min | mean | max |
|---|---|---|---|
| P1 | 1.679e+06 | 3.424e+06 | 4.591e+06 |
| P2 | 2.827e+06 | 3.787e+06 | 4.654e+06 |
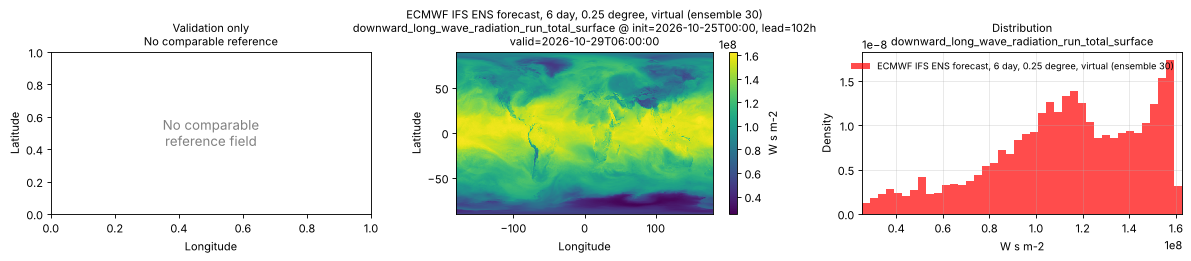
Spatial — init=2026-10-25T00:00, lead=102h, valid=2026-10-29T06:00:00, member=30 (reference not available)
| Source | min | mean | max |
|---|---|---|---|
| Validation | 2.536e+07 | 1.128e+08 | 1.627e+08 |
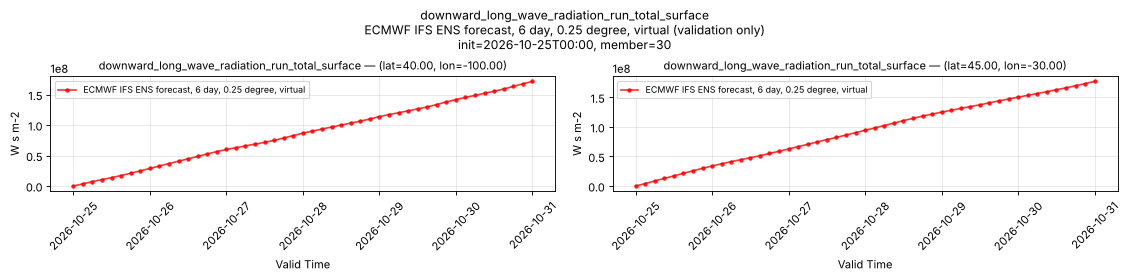
Temporal — init=2026-10-25T00:00, member=30
| Source | min | mean | max |
|---|---|---|---|
| P1 Validation | 0 | 8.58e+07 | 1.718e+08 |
| P2 Validation | 0 | 9.238e+07 | 1.77e+08 |
Availability — 3812 of 3812 positions complete
downward_short_wave_radiation_run_total_surface
Metadata
| Field | Value |
|---|---|
| units | W s m-2 |
| long_name | Surface short-wave (solar) radiation downwards |
| short_name | ssrd |
| standard_name | integral_wrt_time_of_surface_downwelling_shortwave_flux_in_air |
| step_type | accum |
| comment | Accumulated since forecast initialization. |
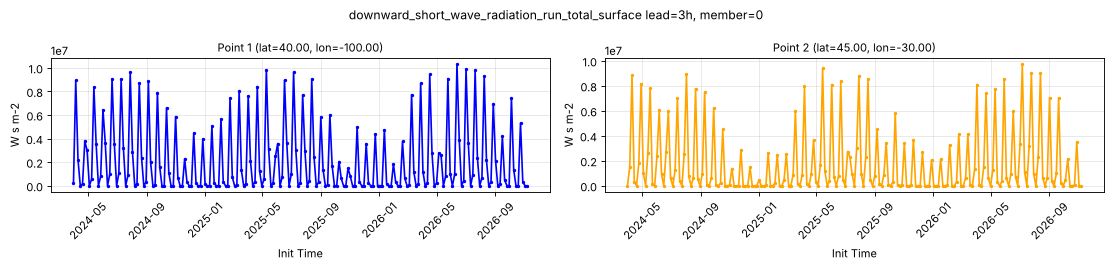
Point time series — 2024-04-01T00:00 - 2026-11-09T18:00, sampled lead=3h, member=0
| Point | min | mean | max |
|---|---|---|---|
| P1 | 0 | 2.164e+06 | 1.031e+07 |
| P2 | 0 | 1.731e+06 | 9.731e+06 |
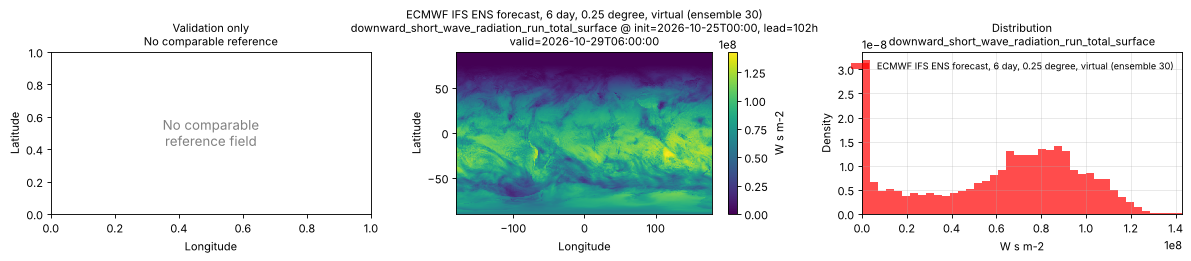
Spatial — init=2026-10-25T00:00, lead=102h, valid=2026-10-29T06:00:00, member=30 (reference not available)
| Source | min | mean | max |
|---|---|---|---|
| Validation | 0 | 6.147e+07 | 1.429e+08 |
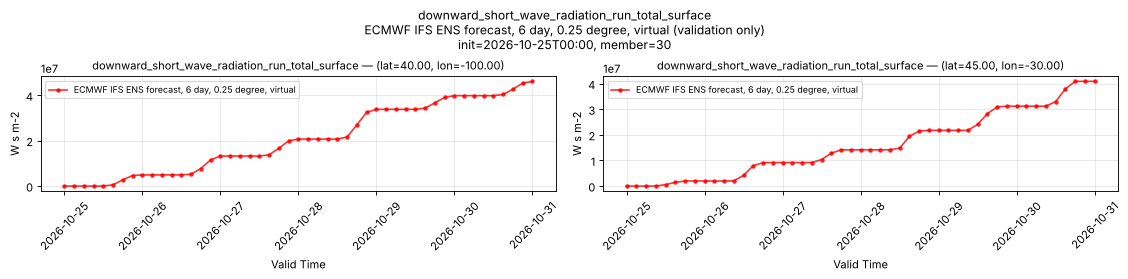
Temporal — init=2026-10-25T00:00, member=30
| Source | min | mean | max |
|---|---|---|---|
| P1 Validation | 0 | 2.064e+07 | 4.614e+07 |
| P2 Validation | 0 | 1.606e+07 | 4.089e+07 |
Availability — 3812 of 3812 positions complete
eastward_turbulent_surface_stress_run_total_surface
Metadata
| Field | Value |
|---|---|
| units | Pa s |
| long_name | Time-integrated eastward turbulent surface stress |
| short_name | ewss |
| standard_name | integral_wrt_time_of_surface_downward_eastward_stress |
| step_type | accum |
| comment | Accumulated since forecast initialization. |
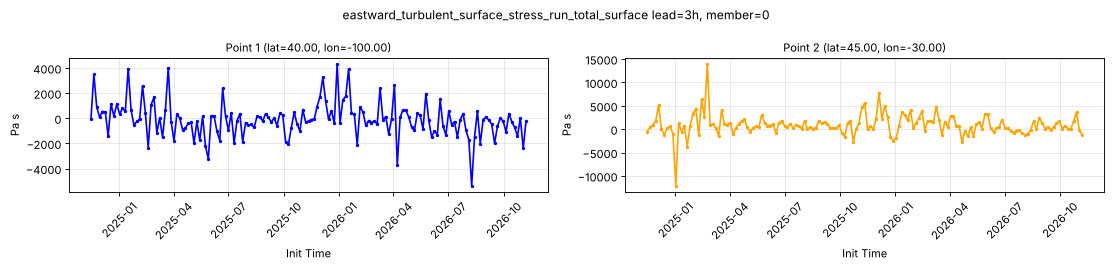
Point time series — 2024-04-01T00:00 - 2026-11-09T18:00, sampled lead=3h, member=0
| Point | min | mean | max |
|---|---|---|---|
| P1 | -5359 | -92.98 | 4306 |
| P2 | -1.207e+04 | 927.7 | 1.39e+04 |
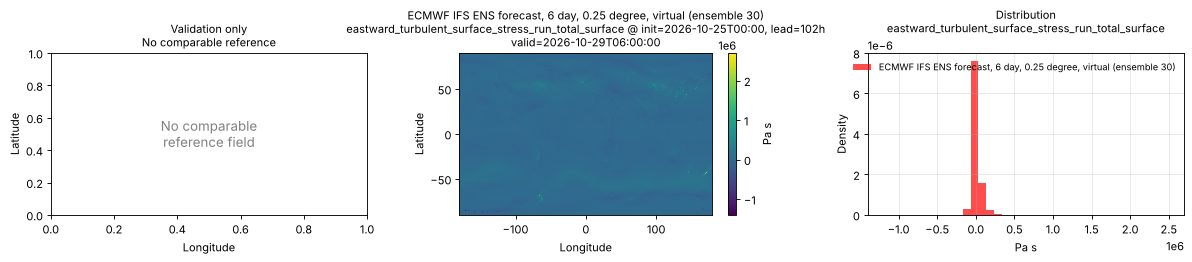
Spatial — init=2026-10-25T00:00, lead=102h, valid=2026-10-29T06:00:00, member=30 (reference not available)
| Source | min | mean | max |
|---|---|---|---|
| Validation | -1.401e+06 | 7965 | 2.697e+06 |
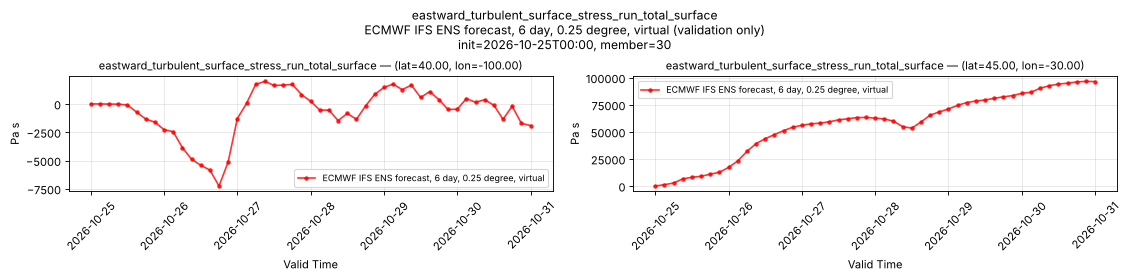
Temporal — init=2026-10-25T00:00, member=30
| Source | min | mean | max |
|---|---|---|---|
| P1 Validation | -7259 | -683.6 | 1996 |
| P2 Validation | 0 | 5.685e+04 | 9.66e+04 |
Availability — 2911 of 3812 positions complete (incomplete 2024-04-01T00:00 → 2024-11-12T00:00)
geopotential_height_surface
Metadata
| Field | Value |
|---|---|
| units | m |
| long_name | Geopotential height |
| short_name | gh |
| standard_name | geopotential_height |
| step_type | instant |
| comment | Surface (orography) geopotential height. Available for control member 0 only; members 1-50 are NaN. Time-invariant field published at lead time 0 only. |
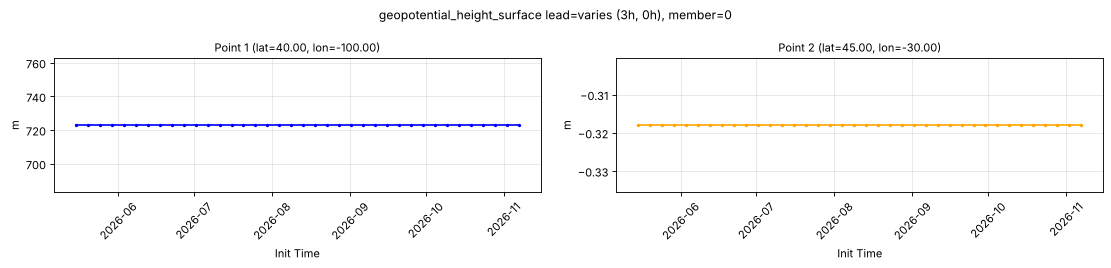
Point time series — 2024-04-01T00:00 - 2026-11-09T18:00, sampled lead=varies (3h, 0h), member=0
| Point | min | mean | max |
|---|---|---|---|
| P1 | 723 | 723 | 723 |
| P2 | -0.318 | -0.318 | -0.318 |
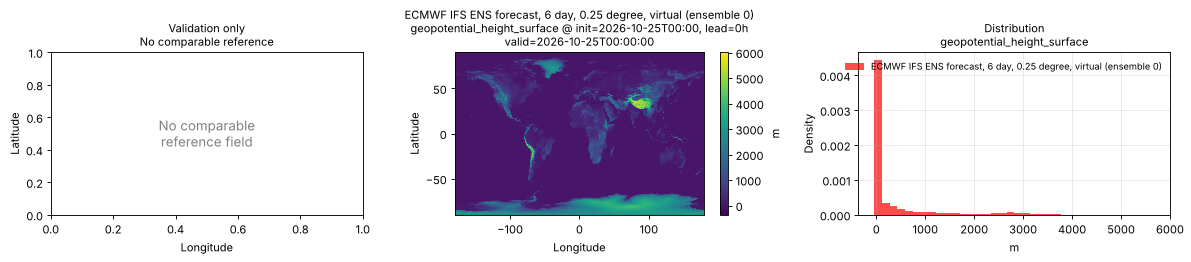
Spatial — init=2026-10-25T00:00, lead=0h, valid=2026-10-25T00:00:00, member=0 (reference not available)
| Source | min | mean | max |
|---|---|---|---|
| Validation | -367.8 | 379.7 | 6008 |
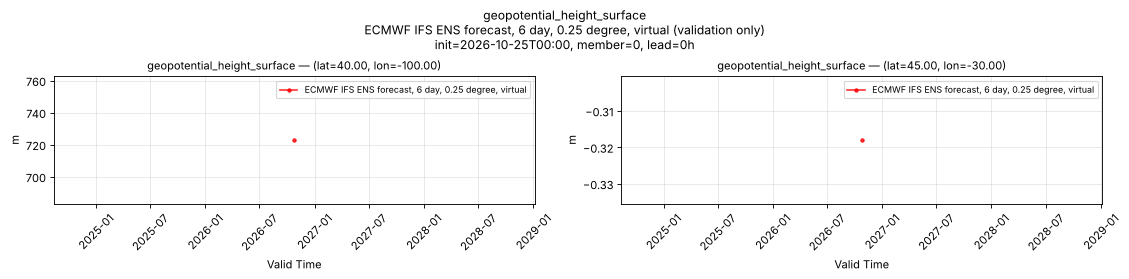
Temporal — init=2026-10-25T00:00, member=0, lead=0h
| Source | min | mean | max |
|---|---|---|---|
| P1 Validation | 723 | 723 | 723 |
| P2 Validation | -0.318 | -0.318 | -0.318 |
Availability — 727 of 3812 positions complete (incomplete 2024-04-01T00:00 → 2026-05-12T00:00)
high_cloud_cover
Metadata
| Field | Value |
|---|---|
| units | percent |
| long_name | High cloud cover |
| short_name | hcc |
| standard_name | cloud_area_fraction_in_atmosphere_layer |
| step_type | instant |
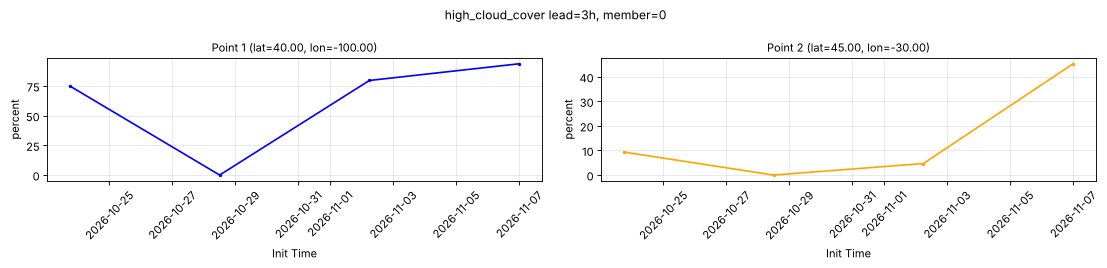
Point time series — 2024-04-01T00:00 - 2026-11-09T18:00, sampled lead=3h, member=0
| Point | min | mean | max |
|---|---|---|---|
| P1 | 0 | 62.11 | 93.75 |
| P2 | 0 | 14.84 | 45.31 |
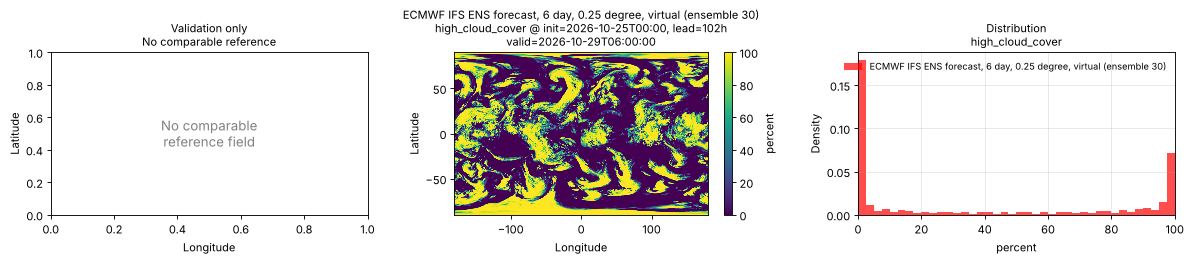
Spatial — init=2026-10-25T00:00, lead=102h, valid=2026-10-29T06:00:00, member=30 (reference not available)
| Source | min | mean | max |
|---|---|---|---|
| Validation | 0 | 37.74 | 100 |
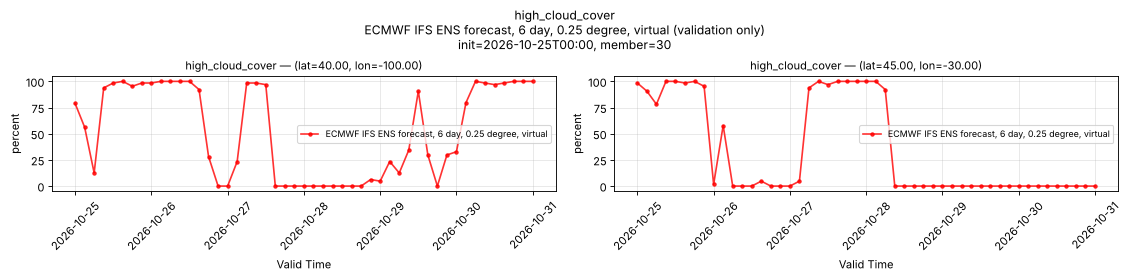
Temporal — init=2026-10-25T00:00, member=30
| Source | min | mean | max |
|---|---|---|---|
| P1 Validation | 0 | 53.2 | 100 |
| P2 Validation | 0 | 34.95 | 100 |
Availability — 83 of 3812 positions complete (incomplete 2024-04-01T00:00 → 2026-10-20T00:00)
land_sea_mask_surface
Metadata
| Field | Value |
|---|---|
| units | 1 |
| long_name | Land-sea mask |
| short_name | lsm |
| standard_name | land_area_fraction |
| step_type | instant |
| comment | Fraction (0-1) of the grid box that is land. |
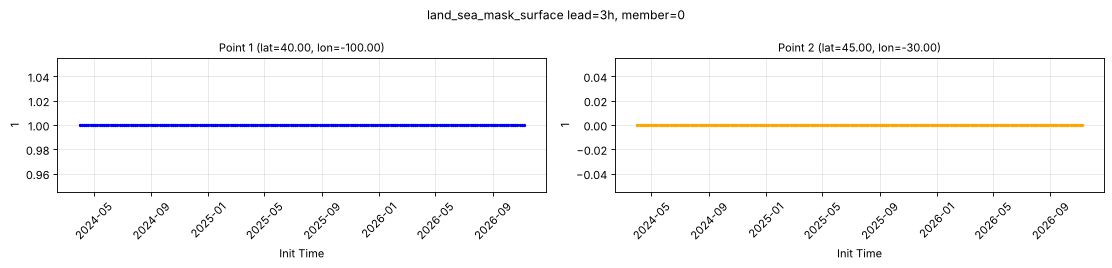
Point time series — 2024-04-01T00:00 - 2026-11-09T18:00, sampled lead=3h, member=0
| Point | min | mean | max |
|---|---|---|---|
| P1 | 1 | 1 | 1 |
| P2 | 0 | 0 | 0 |
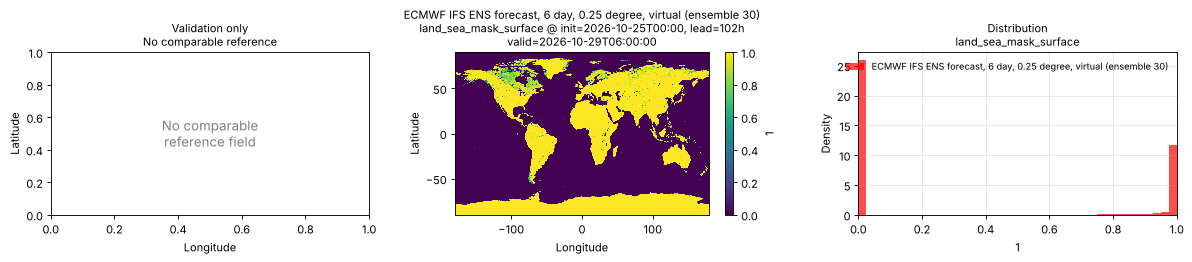
Spatial — init=2026-10-25T00:00, lead=102h, valid=2026-10-29T06:00:00, member=30 (reference not available)
| Source | min | mean | max |
|---|---|---|---|
| Validation | 0 | 0.3345 | 1 |
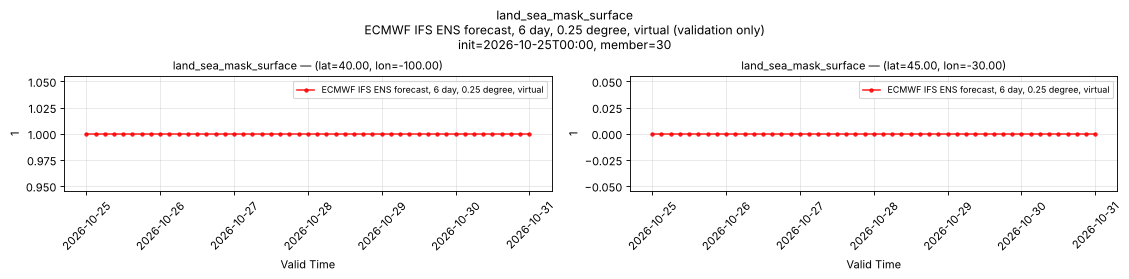
Temporal — init=2026-10-25T00:00, member=30
| Source | min | mean | max |
|---|---|---|---|
| P1 Validation | 1 | 1 | 1 |
| P2 Validation | 0 | 0 | 0 |
Availability — 3812 of 3812 positions complete
low_cloud_cover
Metadata
| Field | Value |
|---|---|
| units | percent |
| long_name | Low cloud cover |
| short_name | lcc |
| standard_name | cloud_area_fraction_in_atmosphere_layer |
| step_type | instant |
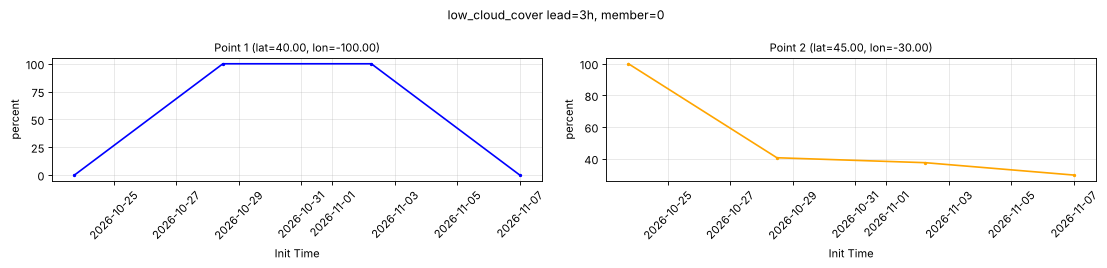
Point time series — 2024-04-01T00:00 - 2026-11-09T18:00, sampled lead=3h, member=0
| Point | min | mean | max |
|---|---|---|---|
| P1 | 0 | 50 | 100 |
| P2 | 29.69 | 51.95 | 100 |
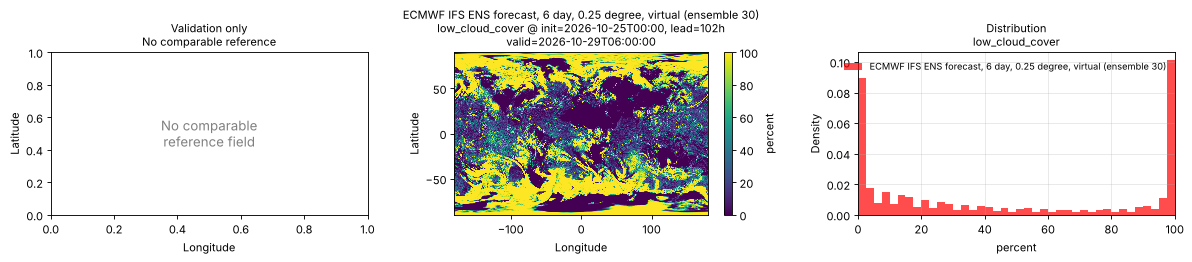
Spatial — init=2026-10-25T00:00, lead=102h, valid=2026-10-29T06:00:00, member=30 (reference not available)
| Source | min | mean | max |
|---|---|---|---|
| Validation | 0 | 45.82 | 100 |
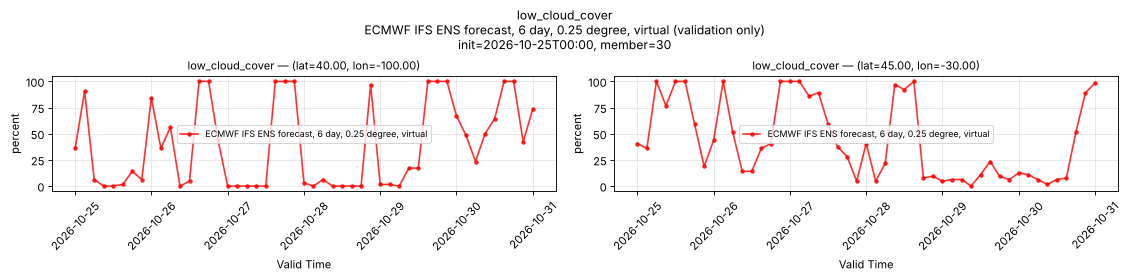
Temporal — init=2026-10-25T00:00, member=30
| Source | min | mean | max |
|---|---|---|---|
| P1 Validation | 0 | 38.62 | 100 |
| P2 Validation | 0 | 44.1 | 100 |
Availability — 83 of 3812 positions complete (incomplete 2024-04-01T00:00 → 2026-10-20T00:00)
maximum_temperature_2m
Metadata
| Field | Value |
|---|---|
| units | degree_Celsius |
| long_name | Maximum temperature |
| short_name | tmax |
| standard_name | air_temperature |
| step_type | max |
| comment | Maximum since the preceding forecast step. Not available at lead time 0. |
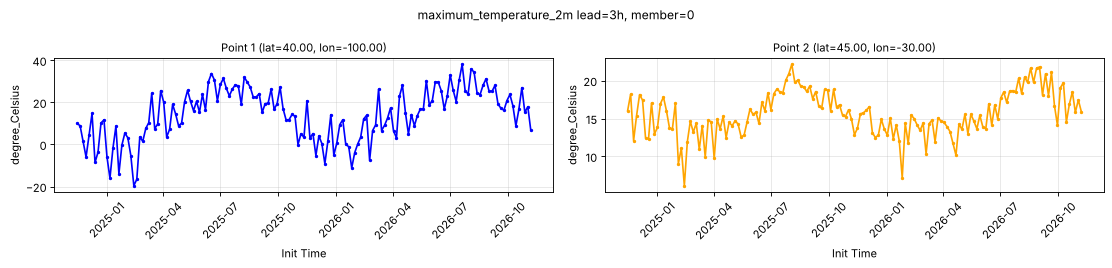
Point time series — 2024-04-01T00:00 - 2026-11-09T18:00, sampled lead=3h, member=0
| Point | min | mean | max |
|---|---|---|---|
| P1 | -19.61 | 14.2 | 38.14 |
| P2 | 6.141 | 15.61 | 22.15 |
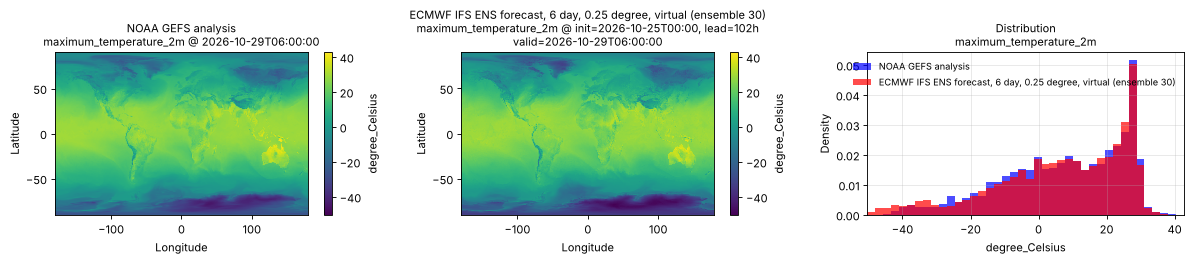
Spatial — init=2026-10-25T00:00, lead=102h, valid=2026-10-29T06:00:00, member=30 (reference at 2026-10-29T06:00:00)
| Source | min | mean | max |
|---|---|---|---|
| Validation | -50.29 | 6.817 | 39.96 |
| Reference | -44.75 | 7.621 | 42.75 |
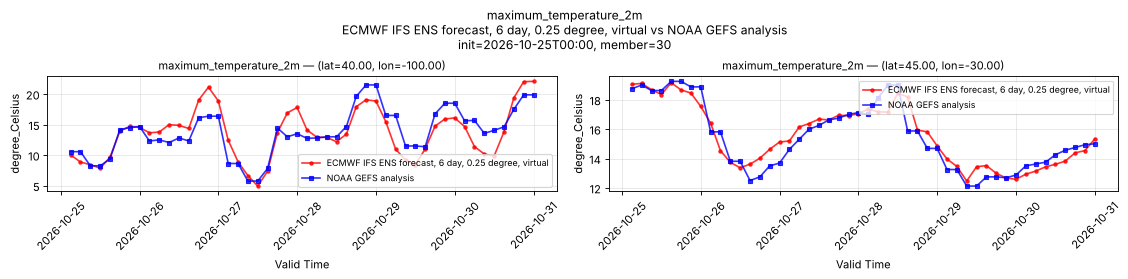
Temporal — init=2026-10-25T00:00, member=30
| Source | min | mean | max |
|---|---|---|---|
| P1 Validation | 4.93 | 13.63 | 22.08 |
| P1 Reference | 5.75 | 13.74 | 21.5 |
| P2 Validation | 12.47 | 15.58 | 19.16 |
| P2 Reference | 12.12 | 15.48 | 19.25 |
Availability — 2911 of 3812 positions complete (incomplete 2024-04-01T00:00 → 2024-11-12T00:00)
medium_cloud_cover
Metadata
| Field | Value |
|---|---|
| units | percent |
| long_name | Medium cloud cover |
| short_name | mcc |
| standard_name | cloud_area_fraction_in_atmosphere_layer |
| step_type | instant |
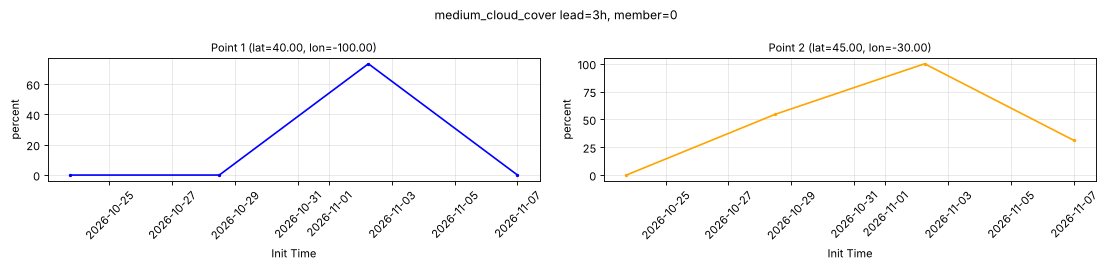
Point time series — 2024-04-01T00:00 - 2026-11-09T18:00, sampled lead=3h, member=0
| Point | min | mean | max |
|---|---|---|---|
| P1 | 0 | 18.36 | 73.44 |
| P2 | 0 | 46.48 | 100 |
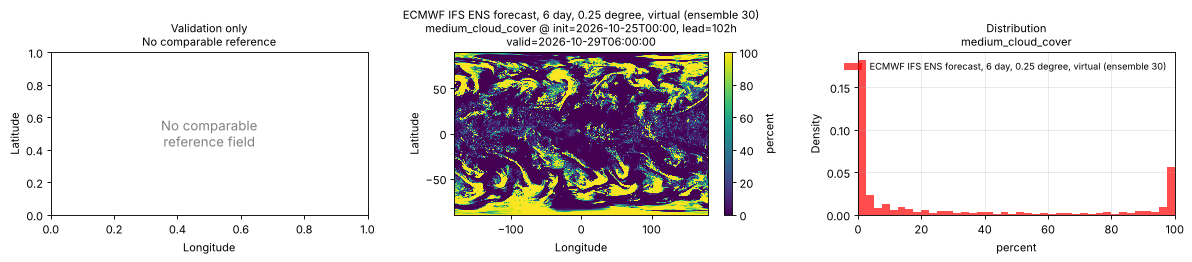
Spatial — init=2026-10-25T00:00, lead=102h, valid=2026-10-29T06:00:00, member=30 (reference not available)
| Source | min | mean | max |
|---|---|---|---|
| Validation | 0 | 29.37 | 100 |
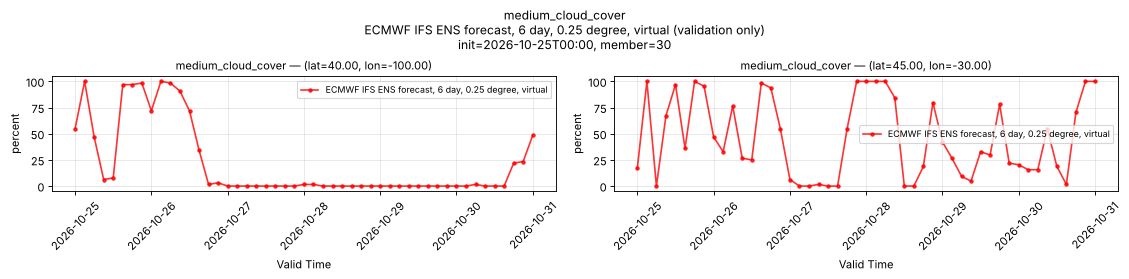
Temporal — init=2026-10-25T00:00, member=30
| Source | min | mean | max |
|---|---|---|---|
| P1 Validation | 0 | 22 | 100 |
| P2 Validation | 0 | 46.01 | 100 |
Availability — 83 of 3812 positions complete (incomplete 2024-04-01T00:00 → 2026-10-20T00:00)
minimum_temperature_2m
Metadata
| Field | Value |
|---|---|
| units | degree_Celsius |
| long_name | Minimum temperature |
| short_name | tmin |
| standard_name | air_temperature |
| step_type | min |
| comment | Minimum since the preceding forecast step. Not available at lead time 0. |
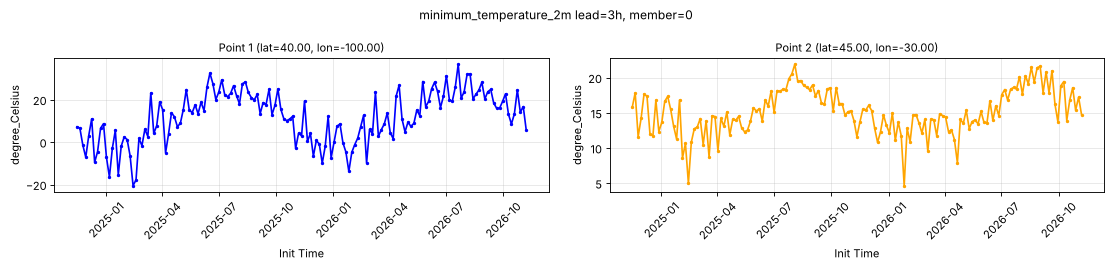
Point time series — 2024-04-01T00:00 - 2026-11-09T18:00, sampled lead=3h, member=0
| Point | min | mean | max |
|---|---|---|---|
| P1 | -20.56 | 11.73 | 36.66 |
| P2 | 4.635 | 15.12 | 21.89 |
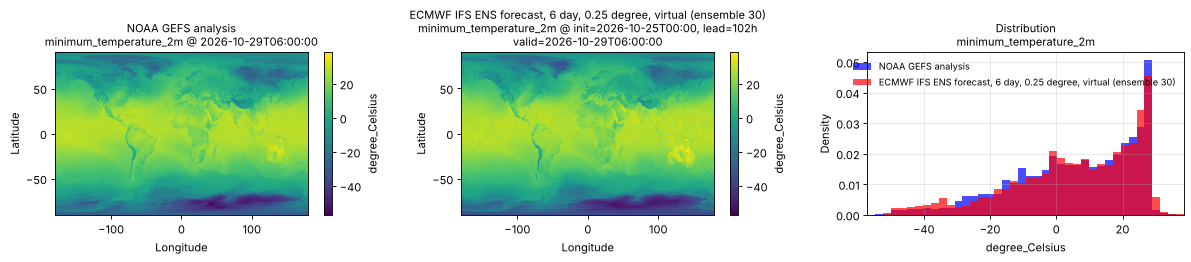
Spatial — init=2026-10-25T00:00, lead=102h, valid=2026-10-29T06:00:00, member=30 (reference at 2026-10-29T06:00:00)
| Source | min | mean | max |
|---|---|---|---|
| Validation | -52.69 | 5.871 | 38.56 |
| Reference | -57 | 5.841 | 36.25 |
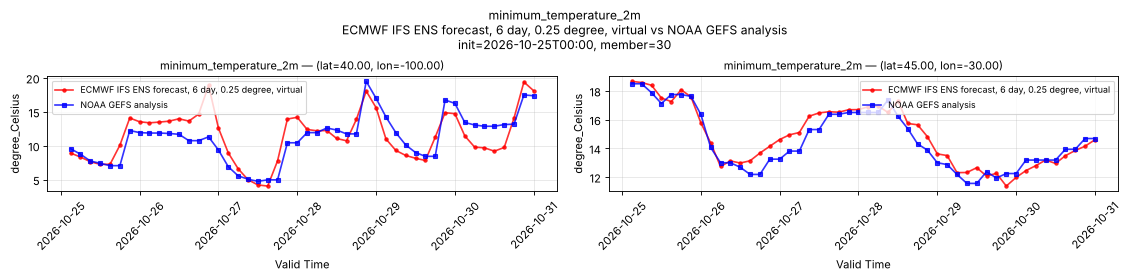
Temporal — init=2026-10-25T00:00, member=30
| Source | min | mean | max |
|---|---|---|---|
| P1 Validation | 4.051 | 11.45 | 19.41 |
| P1 Reference | 4.75 | 11.08 | 19.5 |
| P2 Validation | 11.38 | 14.86 | 18.67 |
| P2 Reference | 11.56 | 14.57 | 18.5 |
Availability — 2911 of 3812 positions complete (incomplete 2024-04-01T00:00 → 2024-11-12T00:00)
most_unstable_convective_available_potential_energy_surface
Metadata
| Field | Value |
|---|---|
| units | J kg-1 |
| long_name | Most-unstable CAPE |
| short_name | mucape |
| standard_name | atmosphere_convective_available_potential_energy |
| step_type | instant |
Point time series — 2024-04-01T00:00 - 2026-11-09T18:00, sampled lead=3h, member=0
| Point | min | mean | max |
|---|---|---|---|
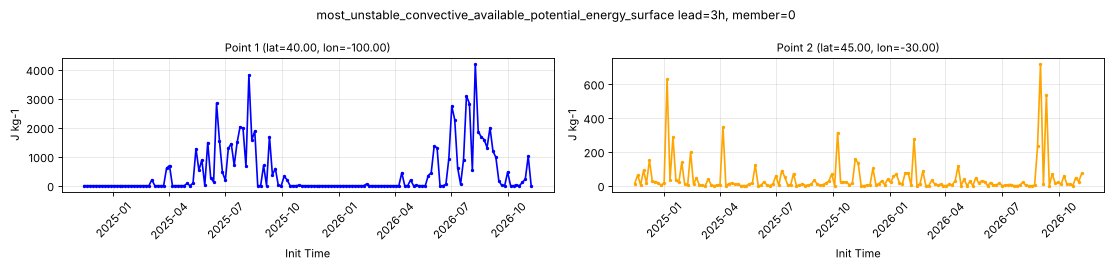
| P1 | 0 | 438.6 | 4184 |
| P2 | 0 | 44.52 | 716.8 |
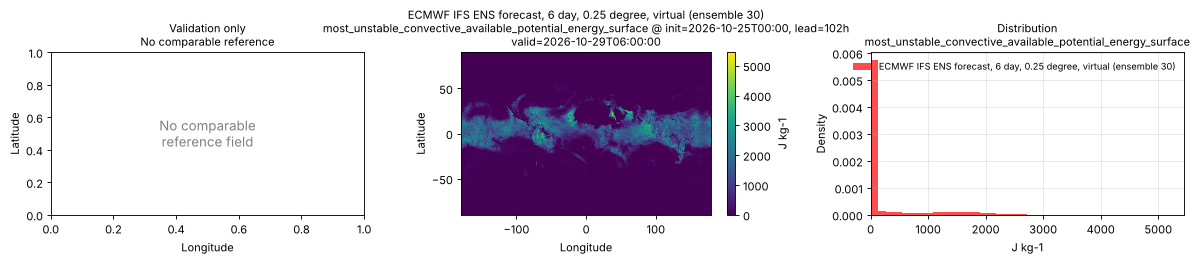
Spatial — init=2026-10-25T00:00, lead=102h, valid=2026-10-29T06:00:00, member=30 (reference not available)
| Source | min | mean | max |
|---|---|---|---|
| Validation | 0 | 283.6 | 5448 |
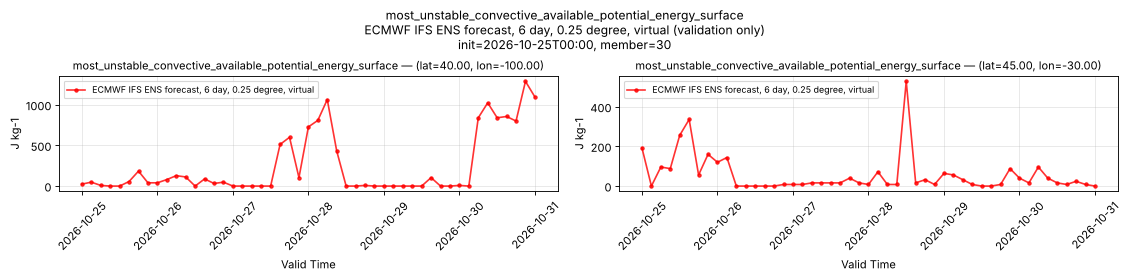
Temporal — init=2026-10-25T00:00, member=30
| Source | min | mean | max |
|---|---|---|---|
| P1 Validation | 0 | 244.9 | 1288 |
| P2 Validation | 0 | 56.65 | 528 |
Availability — 2911 of 3812 positions complete (incomplete 2024-04-01T00:00 → 2024-11-12T00:00)
net_long_wave_radiation_run_total_atmosphere_top
Metadata
| Field | Value |
|---|---|
| units | W s m-2 |
| long_name | Top net long-wave (thermal) radiation |
| short_name | ttr |
| standard_name | n/a |
| step_type | accum |
| comment | Positive downwards, the negative of outgoing long-wave radiation. Accumulated since forecast initialization. |
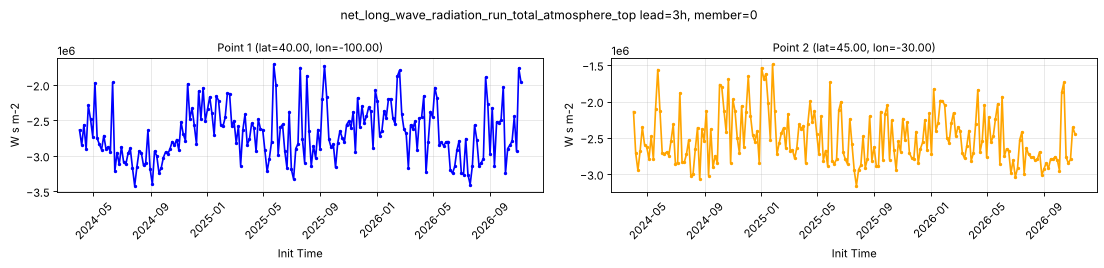
Point time series — 2024-04-01T00:00 - 2026-11-09T18:00, sampled lead=3h, member=0
| Point | min | mean | max |
|---|---|---|---|
| P1 | -3.422e+06 | -2.678e+06 | -1.708e+06 |
| P2 | -3.16e+06 | -2.509e+06 | -1.488e+06 |
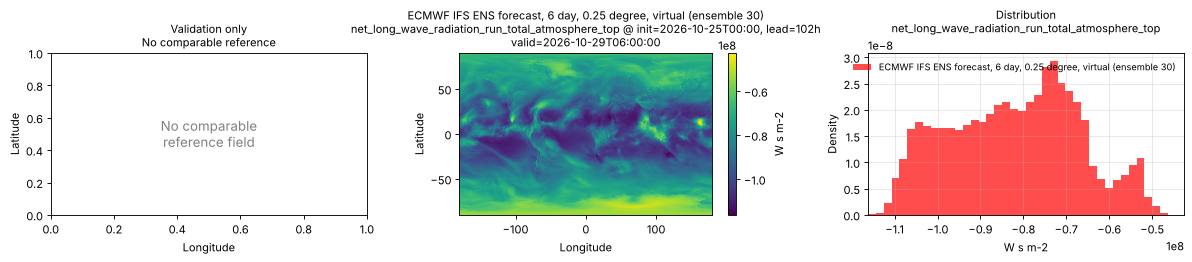
Spatial — init=2026-10-25T00:00, lead=102h, valid=2026-10-29T06:00:00, member=30 (reference not available)
| Source | min | mean | max |
|---|---|---|---|
| Validation | -1.162e+08 | -8.208e+07 | -4.258e+07 |
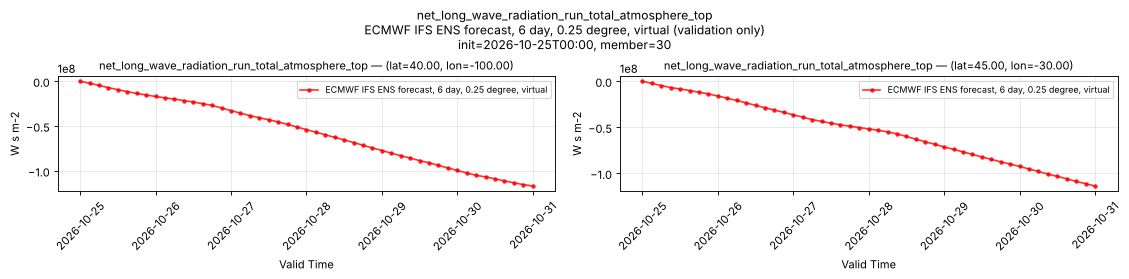
Temporal — init=2026-10-25T00:00, member=30
| Source | min | mean | max |
|---|---|---|---|
| P1 Validation | -1.167e+08 | -5.633e+07 | 0 |
| P2 Validation | -1.137e+08 | -5.414e+07 | 0 |
Availability — 3812 of 3812 positions complete
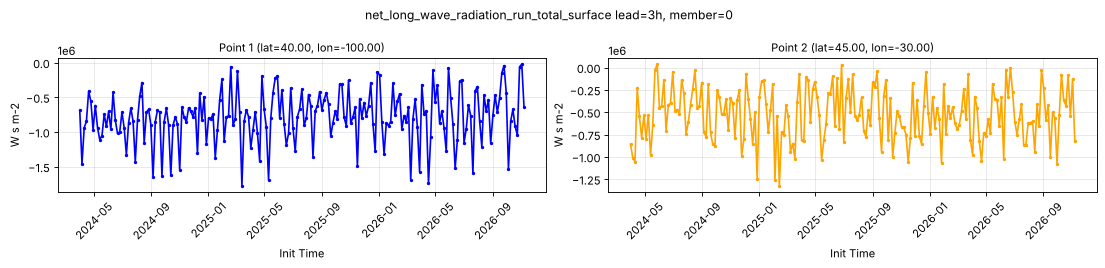
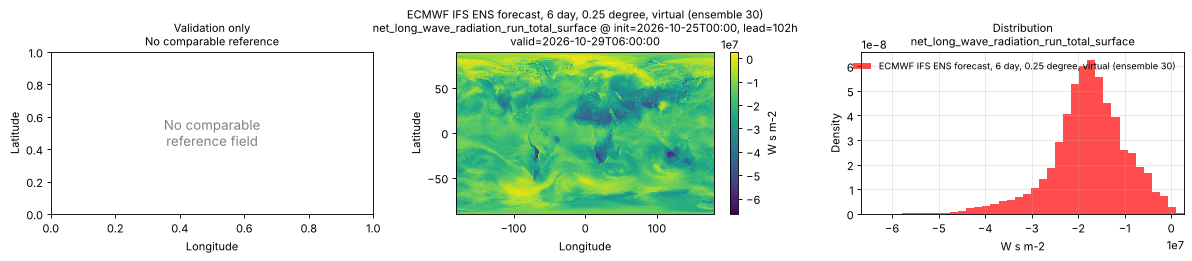
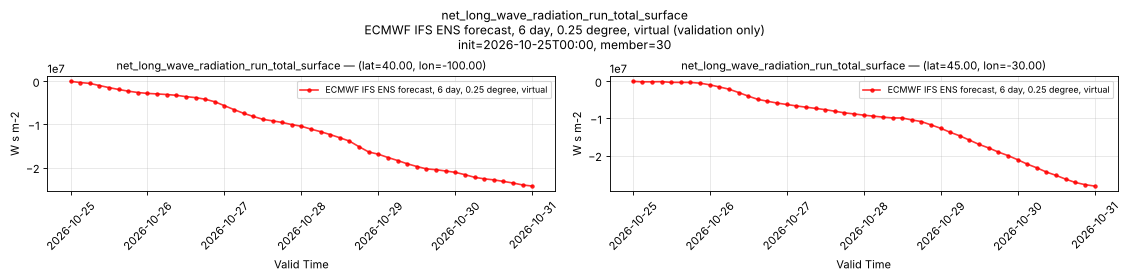
net_long_wave_radiation_run_total_surface
Metadata
| Field | Value |
|---|---|
| units | W s m-2 |
| long_name | Surface net long-wave (thermal) radiation |
| short_name | str |
| standard_name | integral_wrt_time_of_surface_net_downward_longwave_flux |
| step_type | accum |
| comment | Accumulated since forecast initialization. |
Point time series — 2024-04-01T00:00 - 2026-11-09T18:00, sampled lead=3h, member=0
| Point | min | mean | max |
|---|---|---|---|
| P1 | -1.776e+06 | -7.87e+05 | -2.34e+04 |
| P2 | -1.324e+06 | -5.265e+05 | 3.607e+04 |
Spatial — init=2026-10-25T00:00, lead=102h, valid=2026-10-29T06:00:00, member=30 (reference not available)
| Source | min | mean | max |
|---|---|---|---|
| Validation | -6.659e+07 | -1.792e+07 | 2.75e+06 |
Temporal — init=2026-10-25T00:00, member=30
| Source | min | mean | max |
|---|---|---|---|
| P1 Validation | -2.428e+07 | -1.155e+07 | 0 |
| P2 Validation | -2.821e+07 | -1.075e+07 | 0 |
Availability — 3812 of 3812 positions complete
net_short_wave_radiation_run_total_surface
Metadata
| Field | Value |
|---|---|
| units | W s m-2 |
| long_name | Surface net short-wave (solar) radiation |
| short_name | ssr |
| standard_name | integral_wrt_time_of_surface_net_downward_shortwave_flux |
| step_type | accum |
| comment | Accumulated since forecast initialization. |
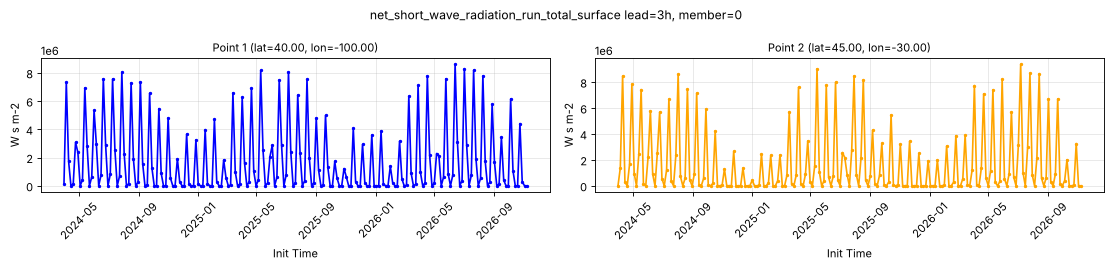
Point time series — 2024-04-01T00:00 - 2026-11-09T18:00, sampled lead=3h, member=0
| Point | min | mean | max |
|---|---|---|---|
| P1 | 0.1287 | 1.751e+06 | 8.604e+06 |
| P2 | 0.1287 | 1.639e+06 | 9.376e+06 |
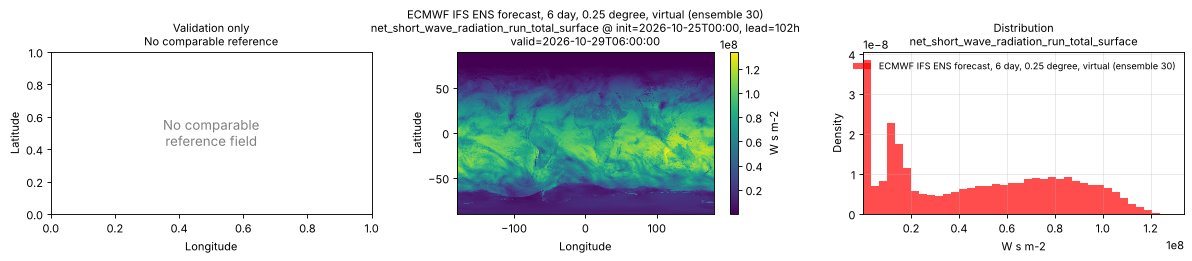
Spatial — init=2026-10-25T00:00, lead=102h, valid=2026-10-29T06:00:00, member=30 (reference not available)
| Source | min | mean | max |
|---|---|---|---|
| Validation | 4.377 | 4.749e+07 | 1.34e+08 |
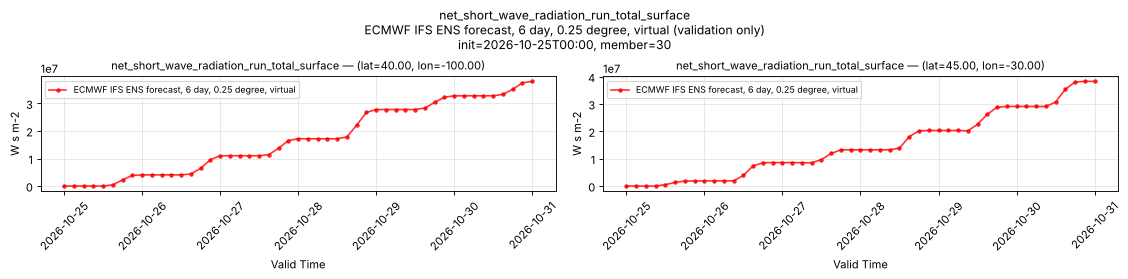
Temporal — init=2026-10-25T00:00, member=30
| Source | min | mean | max |
|---|---|---|---|
| P1 Validation | 0 | 1.703e+07 | 3.801e+07 |
| P2 Validation | 0 | 1.498e+07 | 3.827e+07 |
Availability — 3812 of 3812 positions complete
northward_turbulent_surface_stress_run_total_surface
Metadata
| Field | Value |
|---|---|
| units | Pa s |
| long_name | Time-integrated northward turbulent surface stress |
| short_name | nsss |
| standard_name | integral_wrt_time_of_surface_downward_northward_stress |
| step_type | accum |
| comment | Accumulated since forecast initialization. |
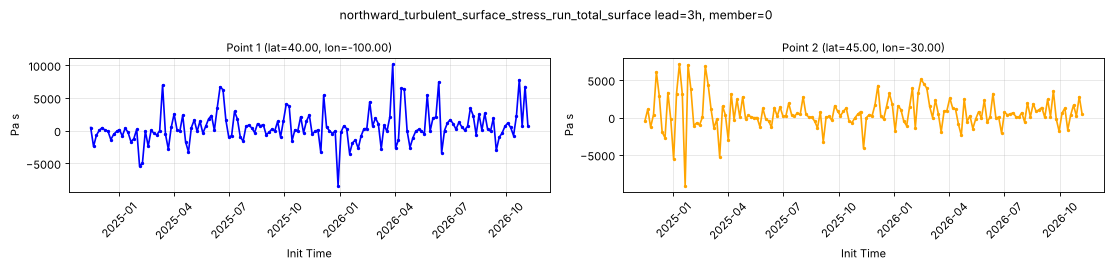
Point time series — 2024-04-01T00:00 - 2026-11-09T18:00, sampled lead=3h, member=0
| Point | min | mean | max |
|---|---|---|---|
| P1 | -8419 | 535.2 | 1.015e+04 |
| P2 | -9112 | 607.2 | 7121 |
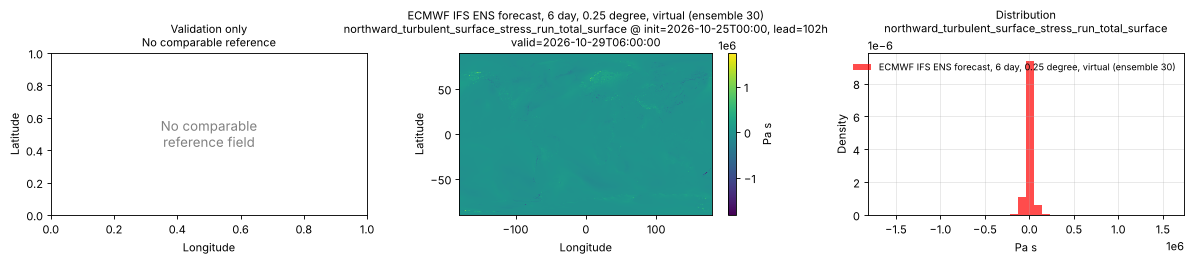
Spatial — init=2026-10-25T00:00, lead=102h, valid=2026-10-29T06:00:00, member=30 (reference not available)
| Source | min | mean | max |
|---|---|---|---|
| Validation | -1.817e+06 | 857.2 | 1.738e+06 |
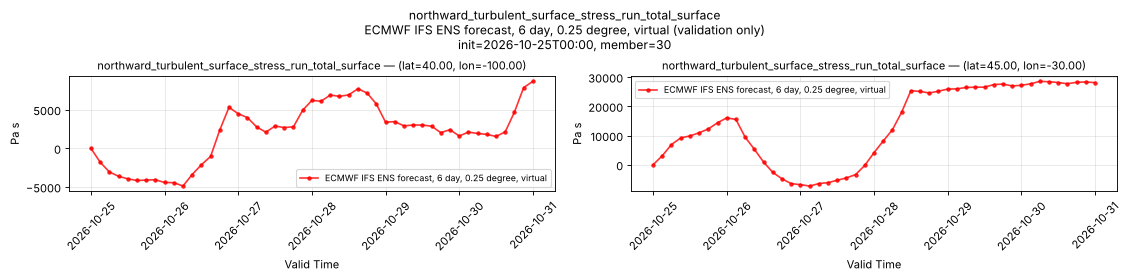
Temporal — init=2026-10-25T00:00, member=30
| Source | min | mean | max |
|---|---|---|---|
| P1 Validation | -4887 | 2000 | 8667 |
| P2 Validation | -7286 | 1.365e+04 | 2.855e+04 |
Availability — 2911 of 3812 positions complete (incomplete 2024-04-01T00:00 → 2024-11-12T00:00)
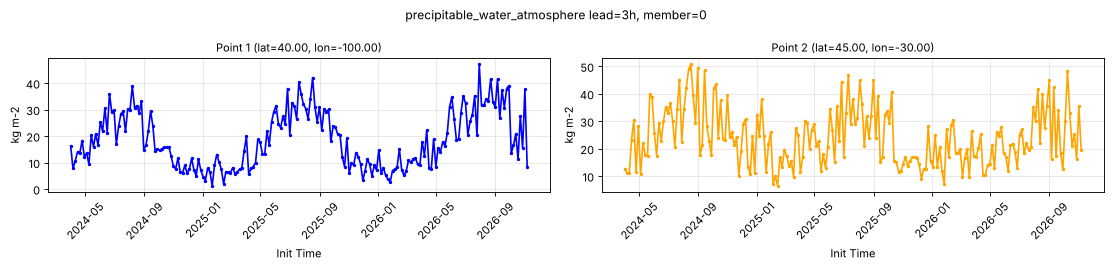
precipitable_water_atmosphere
Metadata
| Field | Value |
|---|---|
| units | kg m-2 |
| long_name | Precipitable water |
| short_name | pwat |
| standard_name | atmosphere_mass_content_of_water_vapor |
| step_type | instant |
Point time series — 2024-04-01T00:00 - 2026-11-09T18:00, sampled lead=3h, member=0
| Point | min | mean | max |
|---|---|---|---|
| P1 | 1.223 | 18.51 | 47.12 |
| P2 | 6.461 | 23.99 | 50.77 |
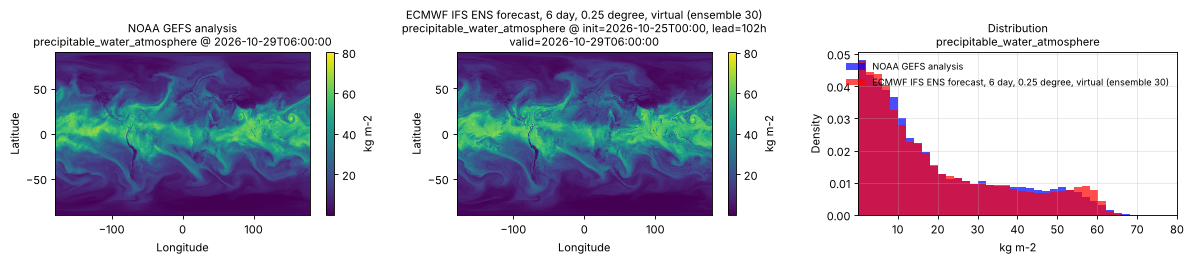
Spatial — init=2026-10-25T00:00, lead=102h, valid=2026-10-29T06:00:00, member=30 (reference at 2026-10-29T06:00:00)
| Source | min | mean | max |
|---|---|---|---|
| Validation | 0.1246 | 19.37 | 80.12 |
| Reference | 0.1001 | 19.09 | 78.5 |
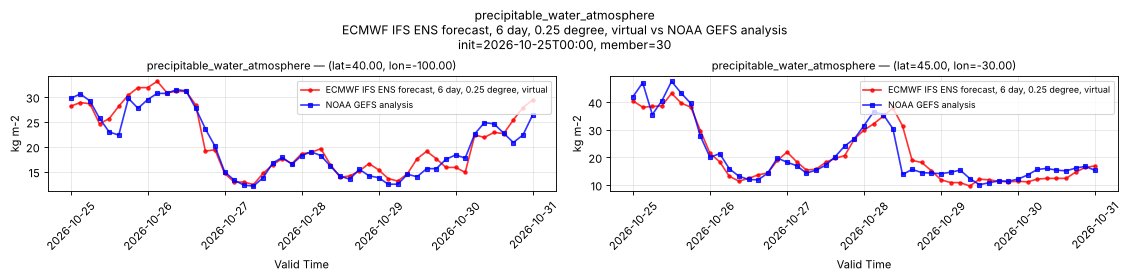
Temporal — init=2026-10-25T00:00, member=30
| Source | min | mean | max |
|---|---|---|---|
| P1 Validation | 12.43 | 21.1 | 33.16 |
| P1 Reference | 12.12 | 20.55 | 31.5 |
| P2 Validation | 9.62 | 20.71 | 43.16 |
| P2 Reference | 10.12 | 21.08 | 47.5 |
Availability — 3812 of 3812 positions complete
precipitation_rate_surface
Metadata
| Field | Value |
|---|---|
| units | kg m-2 s-1 |
| long_name | Precipitation rate |
| short_name | prate |
| standard_name | precipitation_flux |
| step_type | instant |
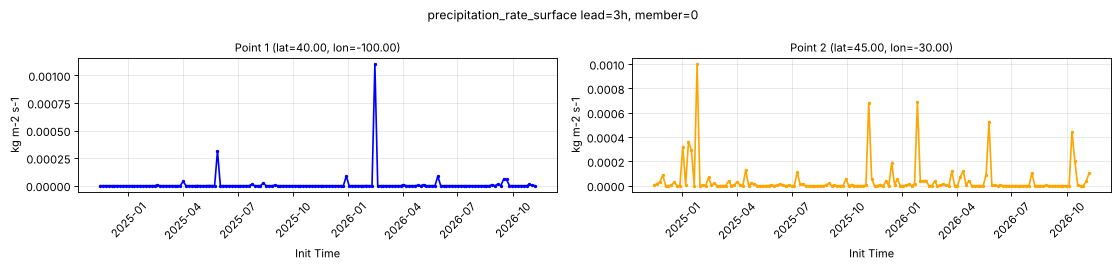
Point time series — 2024-04-01T00:00 - 2026-11-09T18:00, sampled lead=3h, member=0
| Point | min | mean | max |
|---|---|---|---|
| P1 | 0 | 1.215e-05 | 0.001101 |
| P2 | 0 | 4.314e-05 | 0.0009992 |
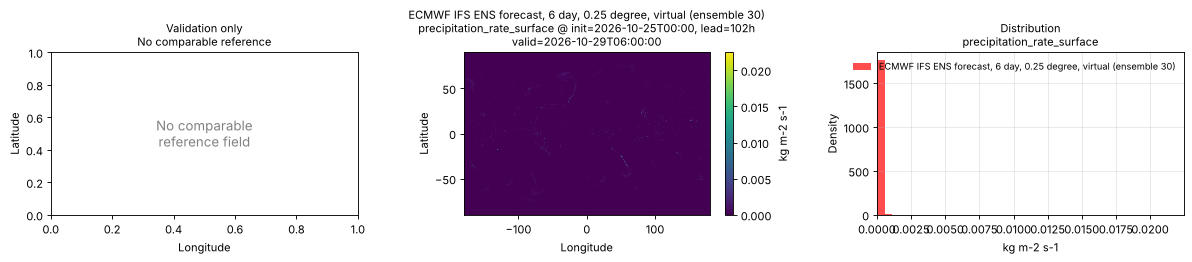
Spatial — init=2026-10-25T00:00, lead=102h, valid=2026-10-29T06:00:00, member=30 (reference not available)
| Source | min | mean | max |
|---|---|---|---|
| Validation | 0 | 2.877e-05 | 0.02248 |
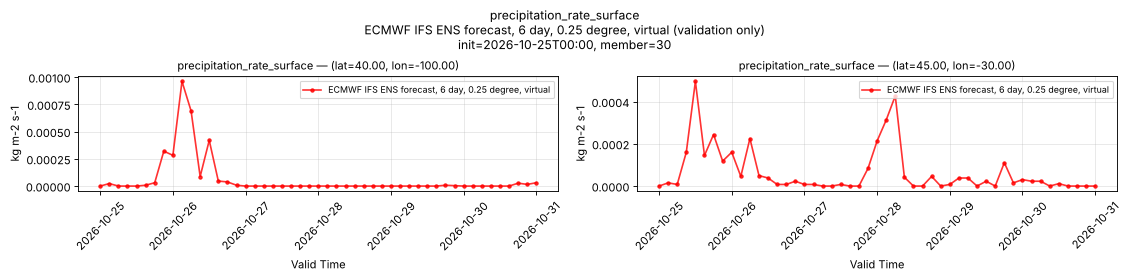
Temporal — init=2026-10-25T00:00, member=30
| Source | min | mean | max |
|---|---|---|---|
| P1 Validation | 0 | 6.119e-05 | 0.0009613 |
| P2 Validation | 0 | 6.555e-05 | 0.0004959 |
Availability — 2911 of 3812 positions complete (incomplete 2024-04-01T00:00 → 2024-11-12T00:00)
pressure_level/divergence [pressure_level=400]
Metadata
| Field | Value |
|---|---|
| units | s-1 |
| long_name | Divergence |
| short_name | d |
| standard_name | divergence_of_wind |
| step_type | instant |
| sampled level | pressure_level=400 |
Point time series — 2024-04-01T00:00 - 2026-11-09T18:00, sampled lead=3h, member=0, pressure_level=400
| Point | min | mean | max |
|---|---|---|---|
| P1 | -9.458e-05 | -1.116e-06 | 0.000113 |
| P2 | -9.042e-05 | 1.277e-06 | 0.0001316 |
Spatial — init=2026-10-25T00:00, lead=102h, valid=2026-10-29T06:00:00, member=30 (reference not available)
| Source | min | mean | max |
|---|---|---|---|
| Validation | -0.0005459 | 1.088e-07 | 0.0009309 |
Temporal — init=2026-10-25T00:00, member=30
| Source | min | mean | max |
|---|---|---|---|
| P1 Validation | -0.0001211 | -9.526e-06 | 0.0001058 |
| P2 Validation | -0.0001109 | -8.306e-09 | 0.000116 |
Availability — 3812 of 3812 positions complete
pressure_level/geopotential [pressure_level=400]
Metadata
| Field | Value |
|---|---|
| units | m2 s-2 |
| long_name | Geopotential |
| short_name | z |
| standard_name | geopotential |
| step_type | instant |
| sampled level | pressure_level=400 |
| comment | Available for control member 0 only; members 1-50 are NaN. |
Point time series — 2024-04-01T00:00 - 2026-11-09T18:00, sampled lead=3h, member=0, pressure_level=400
| Point | min | mean | max |
|---|---|---|---|
| P1 | 7.244e+04 | 7.407e+04 | 7.559e+04 |
| P2 | 6.903e+04 | 7.319e+04 | 7.544e+04 |
Spatial — init=2026-10-25T00:00, lead=102h, valid=2026-10-29T06:00:00, member=0 (reference not available)
| Source | min | mean | max |
|---|---|---|---|
| Validation | 6.093e+04 | 7.021e+04 | 7.538e+04 |
Temporal — init=2026-10-25T00:00, member=0
| Source | min | mean | max |
|---|---|---|---|
| P1 Validation | 7.259e+04 | 7.304e+04 | 7.374e+04 |
| P2 Validation | 6.816e+04 | 7.095e+04 | 7.346e+04 |
Availability — 727 of 3812 positions complete (incomplete 2024-04-01T00:00 → 2026-05-12T00:00)
pressure_level/geopotential_height [pressure_level=400]
Metadata
| Field | Value |
|---|---|
| units | m |
| long_name | Geopotential height |
| short_name | gh |
| standard_name | geopotential_height |
| step_type | instant |
| sampled level | pressure_level=400 |
Point time series — 2024-04-01T00:00 - 2026-11-09T18:00, sampled lead=3h, member=0, pressure_level=400
| Point | min | mean | max |
|---|---|---|---|
| P1 | 6825 | 7404 | 7708 |
| P2 | 6667 | 7348 | 7692 |
Spatial — init=2026-10-25T00:00, lead=102h, valid=2026-10-29T06:00:00, member=30 (reference not available)
| Source | min | mean | max |
|---|---|---|---|
| Validation | 6193 | 7155 | 7691 |
Temporal — init=2026-10-25T00:00, member=30
| Source | min | mean | max |
|---|---|---|---|
| P1 Validation | 7402 | 7444 | 7518 |
| P2 Validation | 6994 | 7235 | 7493 |
Availability — 3812 of 3812 positions complete
pressure_level/relative_humidity [pressure_level=400]
Metadata
| Field | Value |
|---|---|
| units | percent |
| long_name | Relative humidity |
| short_name | r |
| standard_name | relative_humidity |
| step_type | instant |
| sampled level | pressure_level=400 |
Point time series — 2024-04-01T00:00 - 2026-11-09T18:00, sampled lead=3h, member=0, pressure_level=400
| Point | min | mean | max |
|---|---|---|---|
| P1 | -3.48 | 42.61 | 102.7 |
| P2 | 2.147 | 53.83 | 102.7 |
Spatial — init=2026-10-25T00:00, lead=102h, valid=2026-10-29T06:00:00, member=30 (reference not available)
| Source | min | mean | max |
|---|---|---|---|
| Validation | -5.763 | 53.08 | 122.2 |
Temporal — init=2026-10-25T00:00, member=30
| Source | min | mean | max |
|---|---|---|---|
| P1 Validation | 6.014 | 47.7 | 104.3 |
| P2 Validation | 3.461 | 48.72 | 102.9 |
Availability — 3812 of 3812 positions complete
pressure_level/relative_vorticity [pressure_level=400]
Metadata
| Field | Value |
|---|---|
| units | s-1 |
| long_name | Vorticity (relative) |
| short_name | vo |
| standard_name | atmosphere_upward_relative_vorticity |
| step_type | instant |
| sampled level | pressure_level=400 |
Point time series — 2024-04-01T00:00 - 2026-11-09T18:00, sampled lead=3h, member=0, pressure_level=400
| Point | min | mean | max |
|---|---|---|---|
| P1 | -0.0001229 | 5.573e-07 | 0.0006023 |
| P2 | -0.0003797 | -1.652e-05 | 0.0004143 |
Spatial — init=2026-10-25T00:00, lead=102h, valid=2026-10-29T06:00:00, member=30 (reference not available)
| Source | min | mean | max |
|---|---|---|---|
| Validation | -0.0008933 | 3.003e-07 | 0.002115 |
Temporal — init=2026-10-25T00:00, member=30
| Source | min | mean | max |
|---|---|---|---|
| P1 Validation | -0.0001396 | -2.125e-05 | 9.361e-05 |
| P2 Validation | -0.0001393 | 1.049e-05 | 0.0003818 |
Availability — 3812 of 3812 positions complete
pressure_level/specific_humidity [pressure_level=400]
Metadata
| Field | Value |
|---|---|
| units | 1 |
| long_name | Specific humidity |
| short_name | q |
| standard_name | specific_humidity |
| step_type | instant |
| sampled level | pressure_level=400 |
Point time series — 2024-04-01T00:00 - 2026-11-09T18:00, sampled lead=3h, member=0, pressure_level=400
| Point | min | mean | max |
|---|---|---|---|
| P1 | 1.3e-08 | 0.0004852 | 0.002354 |
| P2 | 5.732e-06 | 0.0005275 | 0.00181 |
Spatial — init=2026-10-25T00:00, lead=102h, valid=2026-10-29T06:00:00, member=30 (reference not available)
| Source | min | mean | max |
|---|---|---|---|
| Validation | 4.218e-06 | 0.0004147 | 0.004841 |
Temporal — init=2026-10-25T00:00, member=30
| Source | min | mean | max |
|---|---|---|---|
| P1 Validation | 6.343e-05 | 0.0005023 | 0.001206 |
| P2 Validation | 1.583e-05 | 0.0005661 | 0.00177 |
Availability — 3812 of 3812 positions complete
pressure_level/temperature [pressure_level=400]
Metadata
| Field | Value |
|---|---|
| units | degree_Celsius |
| long_name | Temperature |
| short_name | t |
| standard_name | air_temperature |
| step_type | instant |
| sampled level | pressure_level=400 |
Point time series — 2024-04-01T00:00 - 2026-11-09T18:00, sampled lead=3h, member=0, pressure_level=400
| Point | min | mean | max |
|---|---|---|---|
| P1 | -48.66 | -25.23 | -13.17 |
| P2 | -46.73 | -26.41 | -16.16 |
Spatial — init=2026-10-25T00:00, lead=102h, valid=2026-10-29T06:00:00, member=30 (reference not available)
| Source | min | mean | max |
|---|---|---|---|
| Validation | -55.03 | -30.1 | -5.654 |
Temporal — init=2026-10-25T00:00, member=30
| Source | min | mean | max |
|---|---|---|---|
| P1 Validation | -27.25 | -24.92 | -22.26 |
| P2 Validation | -36.82 | -26.69 | -18.84 |
Availability — 3812 of 3812 positions complete
pressure_level/vertical_velocity [pressure_level=400]
Metadata
| Field | Value |
|---|---|
| units | Pa s-1 |
| long_name | Vertical velocity |
| short_name | w |
| standard_name | lagrangian_tendency_of_air_pressure |
| step_type | instant |
| sampled level | pressure_level=400 |
Point time series — 2024-04-01T00:00 - 2026-11-09T18:00, sampled lead=3h, member=0, pressure_level=400
| Point | min | mean | max |
|---|---|---|---|
| P1 | -1.147 | 0.03768 | 0.6211 |
| P2 | -2.49 | -0.03804 | 0.5118 |
Spatial — init=2026-10-25T00:00, lead=102h, valid=2026-10-29T06:00:00, member=30 (reference not available)
| Source | min | mean | max |
|---|---|---|---|
| Validation | -9.938 | -0.002775 | 4.25 |
Temporal — init=2026-10-25T00:00, member=30
| Source | min | mean | max |
|---|---|---|---|
| P1 Validation | -1.929 | -0.07562 | 0.7104 |
| P2 Validation | -0.8134 | 0.03089 | 0.8253 |
Availability — 3812 of 3812 positions complete
pressure_level/wind_u [pressure_level=400]
Metadata
| Field | Value |
|---|---|
| units | m s-1 |
| long_name | U component of wind |
| short_name | u |
| standard_name | eastward_wind |
| step_type | instant |
| sampled level | pressure_level=400 |
Point time series — 2024-04-01T00:00 - 2026-11-09T18:00, sampled lead=3h, member=0, pressure_level=400
| Point | min | mean | max |
|---|---|---|---|
| P1 | -13.2 | 15.13 | 58.74 |
| P2 | -34.92 | 18.28 | 66.75 |
Spatial — init=2026-10-25T00:00, lead=102h, valid=2026-10-29T06:00:00, member=30 (reference not available)
| Source | min | mean | max |
|---|---|---|---|
| Validation | -46.46 | 8.033 | 65.35 |
Temporal — init=2026-10-25T00:00, member=30
| Source | min | mean | max |
|---|---|---|---|
| P1 Validation | 3.739 | 13.33 | 21.66 |
| P2 Validation | 7.887 | 27.01 | 45.9 |
Availability — 3812 of 3812 positions complete
pressure_level/wind_v [pressure_level=400]
Metadata
| Field | Value |
|---|---|
| units | m s-1 |
| long_name | V component of wind |
| short_name | v |
| standard_name | northward_wind |
| step_type | instant |
| sampled level | pressure_level=400 |
Point time series — 2024-04-01T00:00 - 2026-11-09T18:00, sampled lead=3h, member=0, pressure_level=400
| Point | min | mean | max |
|---|---|---|---|
| P1 | -37.36 | -1.797 | 27.24 |
| P2 | -63.45 | 1.096 | 37.37 |
Spatial — init=2026-10-25T00:00, lead=102h, valid=2026-10-29T06:00:00, member=30 (reference not available)
| Source | min | mean | max |
|---|---|---|---|
| Validation | -60.64 | 0.09529 | 62.73 |
Temporal — init=2026-10-25T00:00, member=30
| Source | min | mean | max |
|---|---|---|---|
| P1 Validation | 0.6003 | 10.93 | 23.45 |
| P2 Validation | -34.32 | 10.52 | 50.19 |
Availability — 3812 of 3812 positions complete
pressure_reduced_to_mean_sea_level
Metadata
| Field | Value |
|---|---|
| units | Pa |
| long_name | Pressure reduced to MSL |
| short_name | prmsl |
| standard_name | air_pressure_at_mean_sea_level |
| step_type | instant |
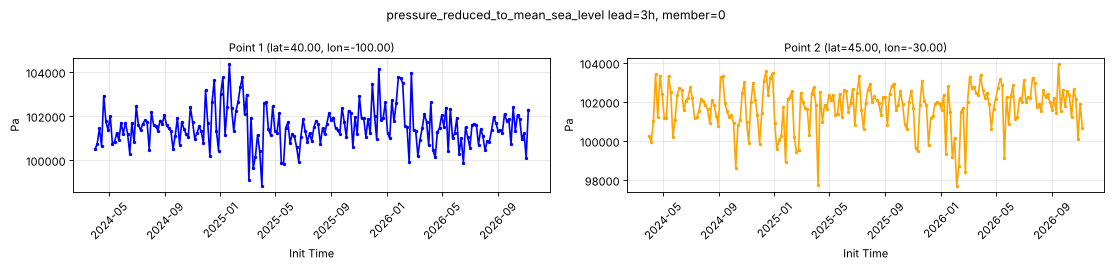
Point time series — 2024-04-01T00:00 - 2026-11-09T18:00, sampled lead=3h, member=0
| Point | min | mean | max |
|---|---|---|---|
| P1 | 9.884e+04 | 1.015e+05 | 1.044e+05 |
| P2 | 9.771e+04 | 1.017e+05 | 1.039e+05 |
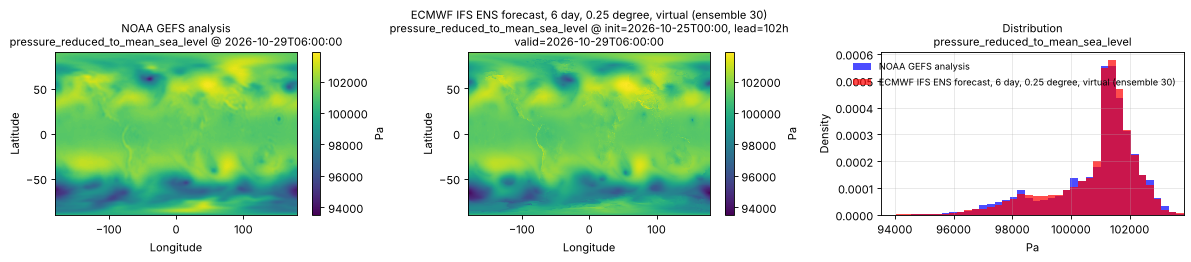
Spatial — init=2026-10-25T00:00, lead=102h, valid=2026-10-29T06:00:00, member=30 (reference at 2026-10-29T06:00:00)
| Source | min | mean | max |
|---|---|---|---|
| Validation | 9.353e+04 | 1.009e+05 | 1.039e+05 |
| Reference | 9.427e+04 | 1.008e+05 | 1.037e+05 |
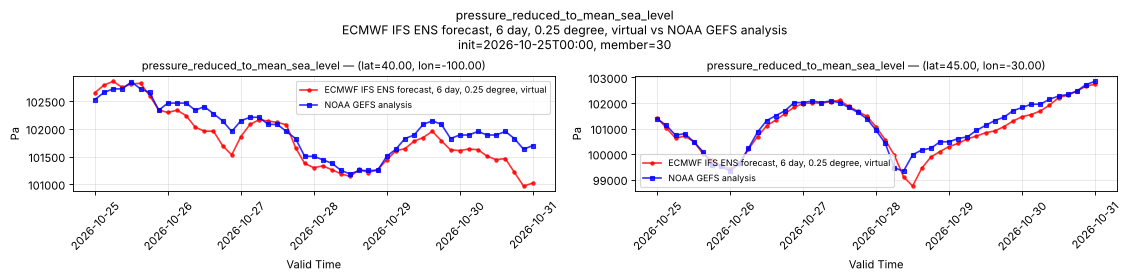
Temporal — init=2026-10-25T00:00, member=30
| Source | min | mean | max |
|---|---|---|---|
| P1 Validation | 1.01e+05 | 1.018e+05 | 1.029e+05 |
| P1 Reference | 1.012e+05 | 1.02e+05 | 1.028e+05 |
| P2 Validation | 9.874e+04 | 1.01e+05 | 1.027e+05 |
| P2 Reference | 9.933e+04 | 1.011e+05 | 1.028e+05 |
Availability — 3812 of 3812 positions complete
pressure_surface
Metadata
| Field | Value |
|---|---|
| units | Pa |
| long_name | Surface pressure |
| short_name | sp |
| standard_name | surface_air_pressure |
| step_type | instant |
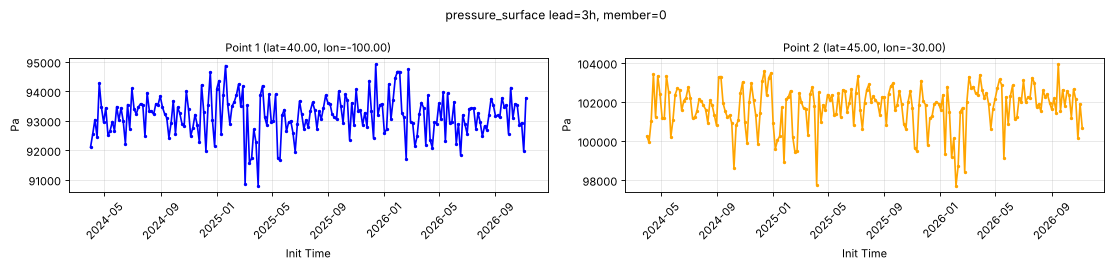
Point time series — 2024-04-01T00:00 - 2026-11-09T18:00, sampled lead=3h, member=0
| Point | min | mean | max |
|---|---|---|---|
| P1 | 9.08e+04 | 9.318e+04 | 9.492e+04 |
| P2 | 9.771e+04 | 1.017e+05 | 1.039e+05 |
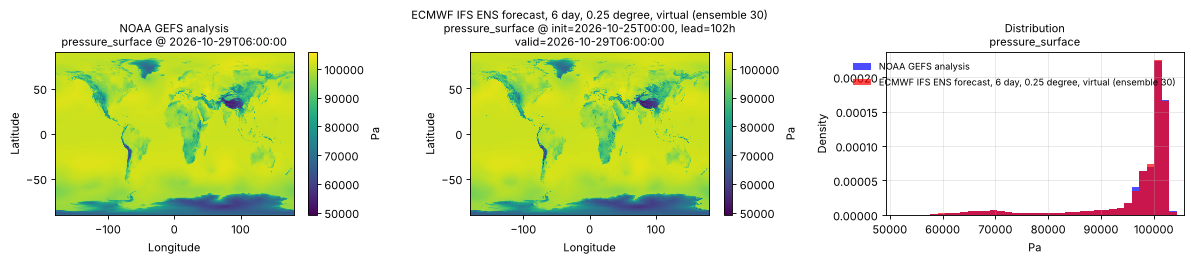
Spatial — init=2026-10-25T00:00, lead=102h, valid=2026-10-29T06:00:00, member=30 (reference at 2026-10-29T06:00:00)
| Source | min | mean | max |
|---|---|---|---|
| Validation | 4.92e+04 | 9.658e+04 | 1.057e+05 |
| Reference | 5.043e+04 | 9.655e+04 | 1.038e+05 |
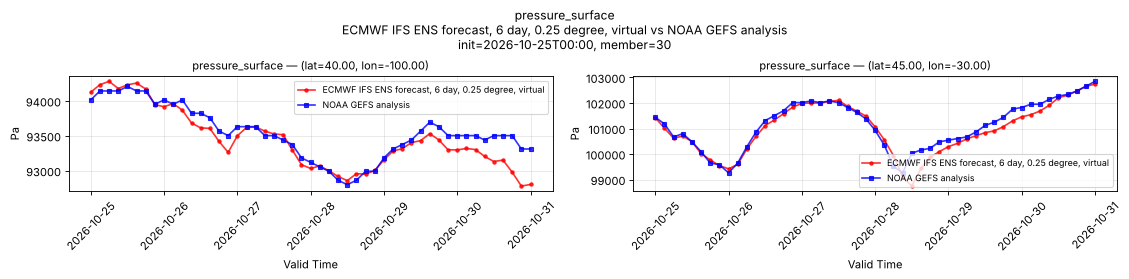
Temporal — init=2026-10-25T00:00, member=30
| Source | min | mean | max |
|---|---|---|---|
| P1 Validation | 9.278e+04 | 9.345e+04 | 9.428e+04 |
| P1 Reference | 9.28e+04 | 9.355e+04 | 9.421e+04 |
| P2 Validation | 9.875e+04 | 1.01e+05 | 1.027e+05 |
| P2 Reference | 9.926e+04 | 1.011e+05 | 1.028e+05 |
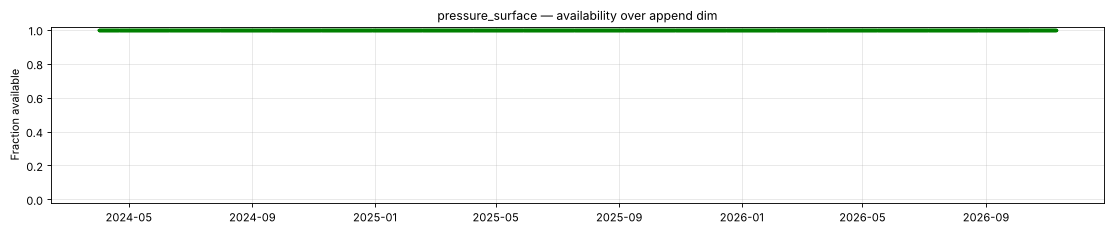
Availability — 3812 of 3812 positions complete
runoff_water_equivalent_run_total_surface
Metadata
| Field | Value |
|---|---|
| units | kg m-2 |
| long_name | Runoff water equivalent (surface plus subsurface) |
| short_name | rowe |
| standard_name | runoff_amount |
| step_type | accum |
| comment | Accumulated since forecast initialization. |
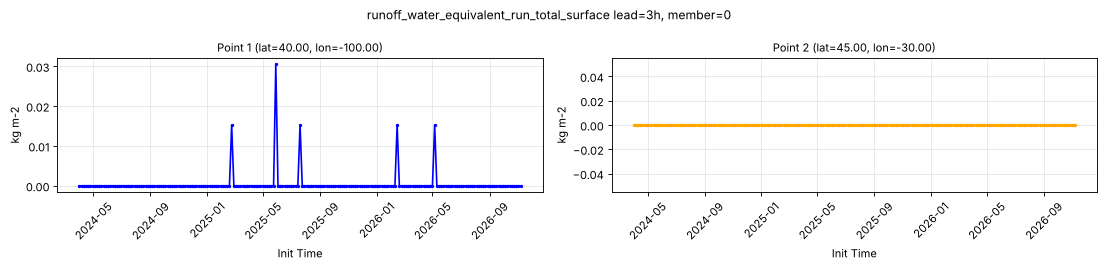
Point time series — 2024-04-01T00:00 - 2026-11-09T18:00, sampled lead=3h, member=0
| Point | min | mean | max |
|---|---|---|---|
| P1 | 0 | 0.0004555 | 0.03052 |
| P2 | 0 | 0 | 0 |
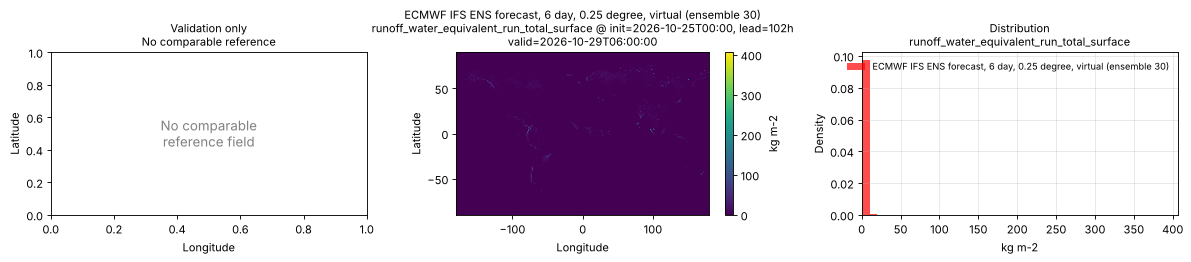
Spatial — init=2026-10-25T00:00, lead=102h, valid=2026-10-29T06:00:00, member=30 (reference not available)
| Source | min | mean | max |
|---|---|---|---|
| Validation | 0 | 0.5468 | 406.2 |
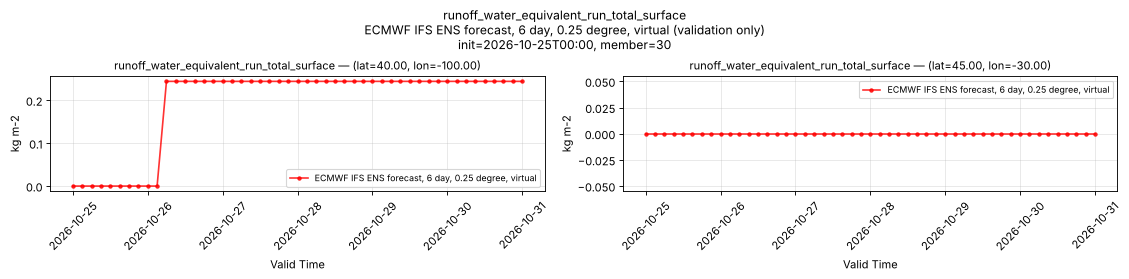
Temporal — init=2026-10-25T00:00, member=30
| Source | min | mean | max |
|---|---|---|---|
| P1 Validation | 0 | 0.1943 | 0.2441 |
| P2 Validation | 0 | 0 | 0 |
Availability — 3812 of 3812 positions complete
sea_ice_thickness_surface
Metadata
| Field | Value |
|---|---|
| units | m |
| long_name | Sea ice thickness |
| short_name | sithick |
| standard_name | sea_ice_thickness |
| step_type | instant |
| comment | NaN where there is no ocean model value, including over land. |
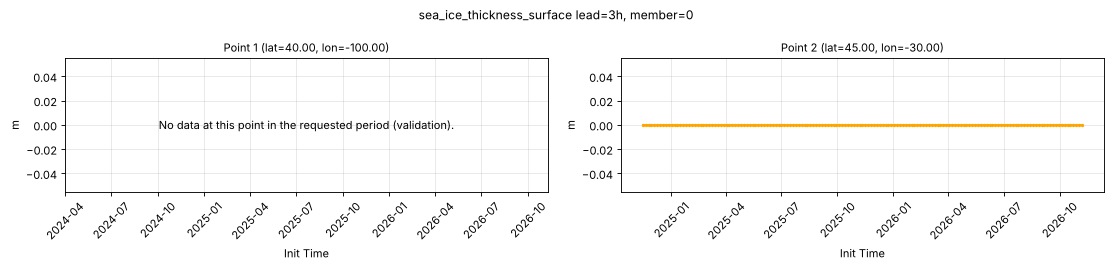
Point time series — 2024-04-01T00:00 - 2026-11-09T18:00, sampled lead=3h, member=0
| Point | min | mean | max |
|---|---|---|---|
| P1 | n/a | n/a | n/a |
| P2 | 0 | 0 | 0 |
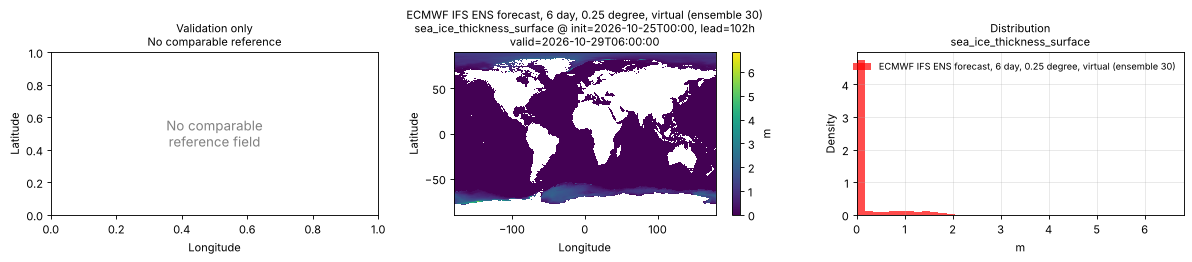
Spatial — init=2026-10-25T00:00, lead=102h, valid=2026-10-29T06:00:00, member=30 (reference not available)
| Source | min | mean | max |
|---|---|---|---|
| Validation | 0 | 0.2059 | 6.82 |
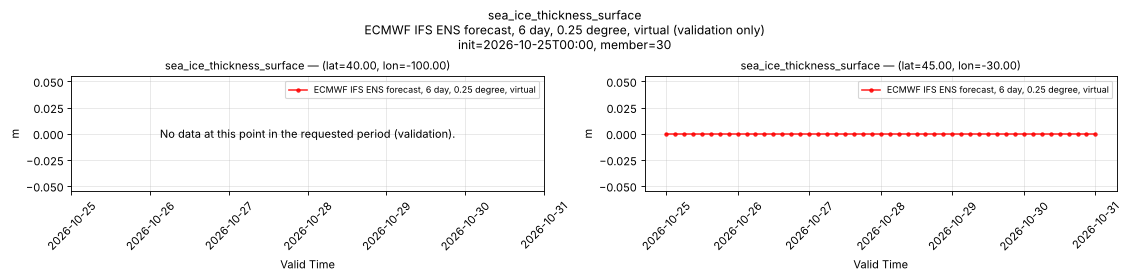
Temporal — init=2026-10-25T00:00, member=30
| Source | min | mean | max |
|---|---|---|---|
| P1 Validation | n/a | n/a | n/a |
| P2 Validation | 0 | 0 | 0 |
Availability — 2911 of 3812 positions complete (incomplete 2024-04-01T00:00 → 2024-11-12T00:00)
sea_surface_height
Metadata
| Field | Value |
|---|---|
| units | m |
| long_name | Sea surface height |
| short_name | zos |
| standard_name | n/a |
| step_type | instant |
| comment | NaN where there is no ocean model value, including over land. |
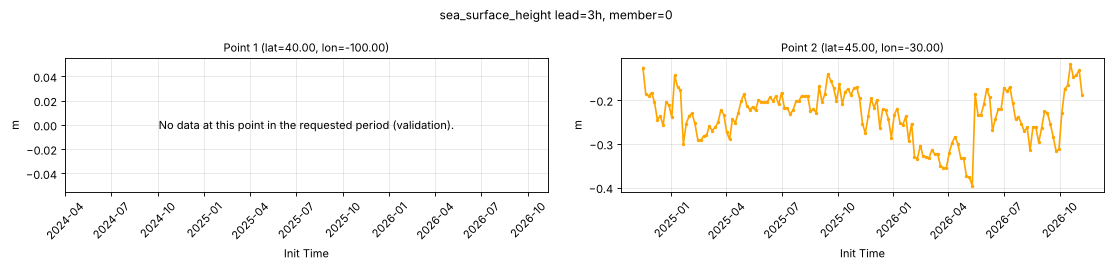
Point time series — 2024-04-01T00:00 - 2026-11-09T18:00, sampled lead=3h, member=0
| Point | min | mean | max |
|---|---|---|---|
| P1 | n/a | n/a | n/a |
| P2 | -0.3955 | -0.2358 | -0.1176 |
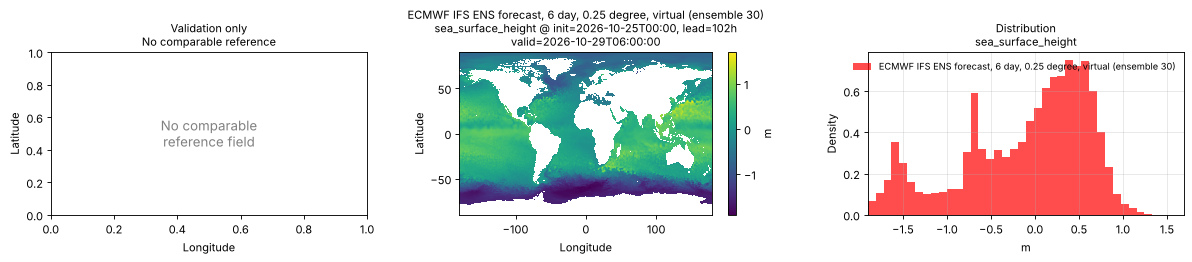
Spatial — init=2026-10-25T00:00, lead=102h, valid=2026-10-29T06:00:00, member=30 (reference not available)
| Source | min | mean | max |
|---|---|---|---|
| Validation | -1.9 | -0.1122 | 1.694 |
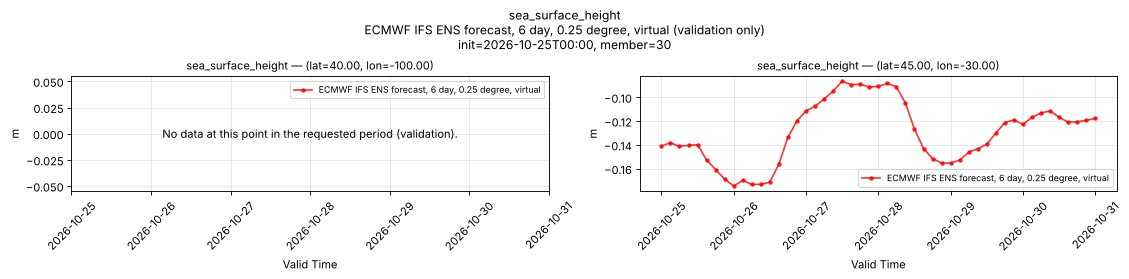
Temporal — init=2026-10-25T00:00, member=30
| Source | min | mean | max |
|---|---|---|---|
| P1 Validation | n/a | n/a | n/a |
| P2 Validation | -0.1746 | -0.1295 | -0.08661 |
Availability — 2911 of 3812 positions complete (incomplete 2024-04-01T00:00 → 2024-11-12T00:00)
sea_water_velocity_u_surface
Metadata
| Field | Value |
|---|---|
| units | m s-1 |
| long_name | Eastward surface sea water velocity |
| short_name | sve |
| standard_name | eastward_sea_water_velocity |
| step_type | instant |
| comment | Applies over the ocean only; over land the values are NaN or near zero, so mask with land_sea_mask_surface. |
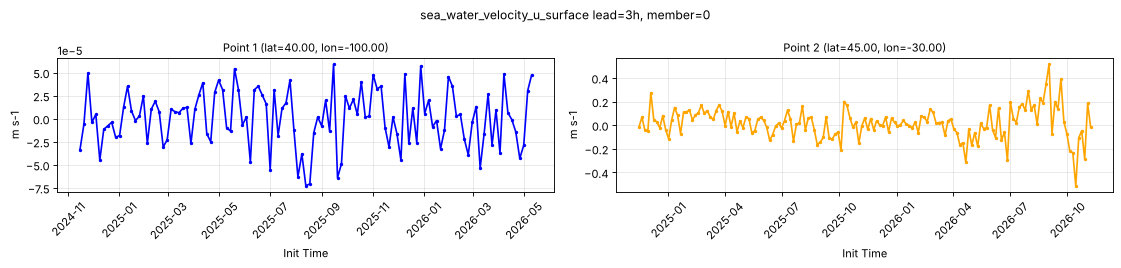
Point time series — 2024-04-01T00:00 - 2026-11-09T18:00, sampled lead=3h, member=0
| Point | min | mean | max |
|---|---|---|---|
| P1 | -7.248e-05 | 6.137e-07 | 5.913e-05 |
| P2 | -0.5119 | 0.01894 | 0.5167 |
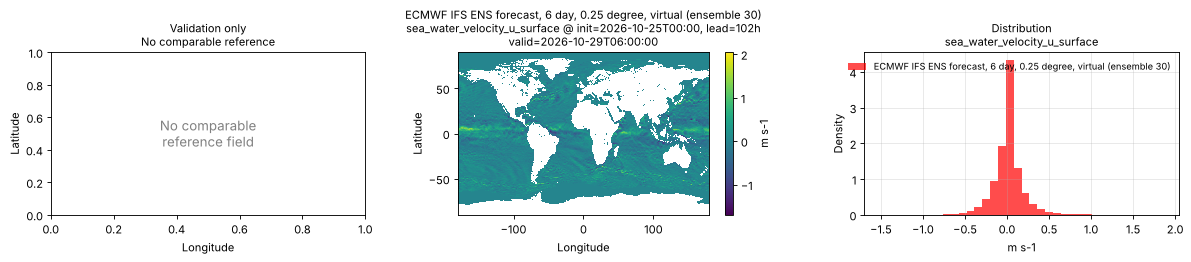
Spatial — init=2026-10-25T00:00, lead=102h, valid=2026-10-29T06:00:00, member=30 (reference not available)
| Source | min | mean | max |
|---|---|---|---|
| Validation | -1.698 | 0.01492 | 2.045 |
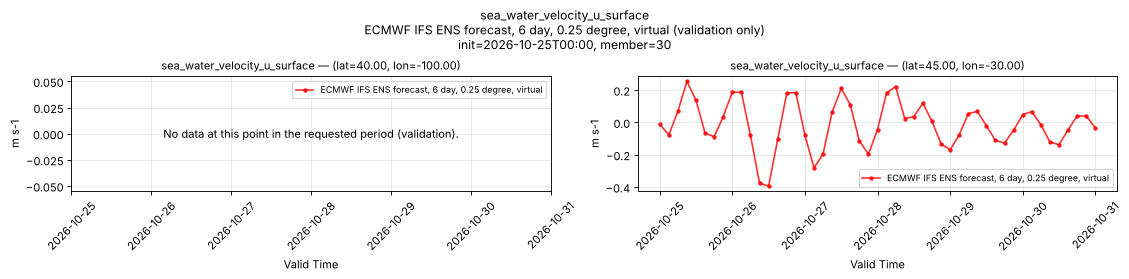
Temporal — init=2026-10-25T00:00, member=30
| Source | min | mean | max |
|---|---|---|---|
| P1 Validation | n/a | n/a | n/a |
| P2 Validation | -0.3938 | -0.01238 | 0.2544 |
Availability — 2911 of 3812 positions complete (incomplete 2024-04-01T00:00 → 2024-11-12T00:00)
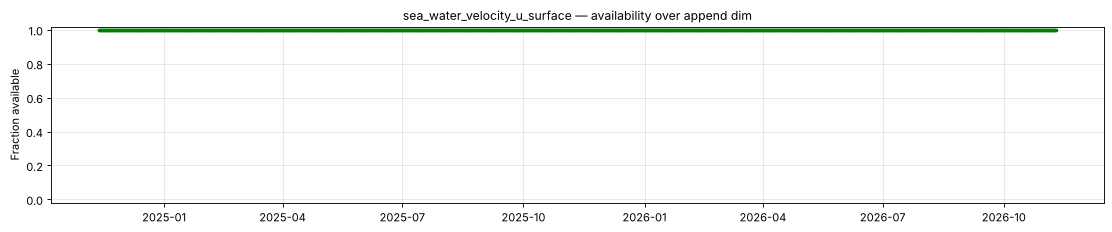
sea_water_velocity_v_surface
Metadata
| Field | Value |
|---|---|
| units | m s-1 |
| long_name | Northward surface sea water velocity |
| short_name | svn |
| standard_name | northward_sea_water_velocity |
| step_type | instant |
| comment | Applies over the ocean only; over land the values are NaN or near zero, so mask with land_sea_mask_surface. |
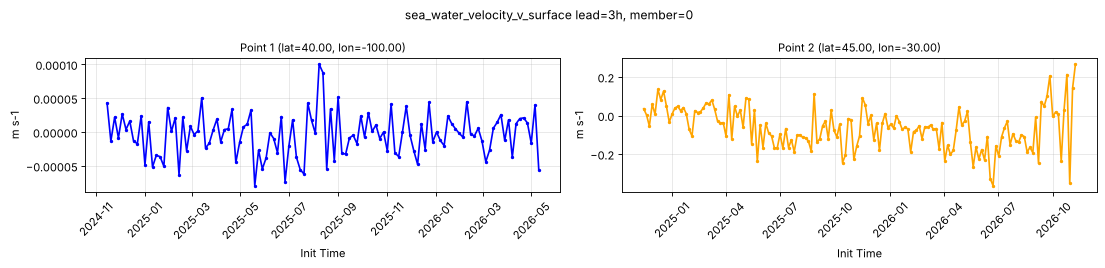
Point time series — 2024-04-01T00:00 - 2026-11-09T18:00, sampled lead=3h, member=0
| Point | min | mean | max |
|---|---|---|---|
| P1 | -7.915e-05 | -3.549e-06 | 0.0001001 |
| P2 | -0.3637 | -0.06351 | 0.2657 |
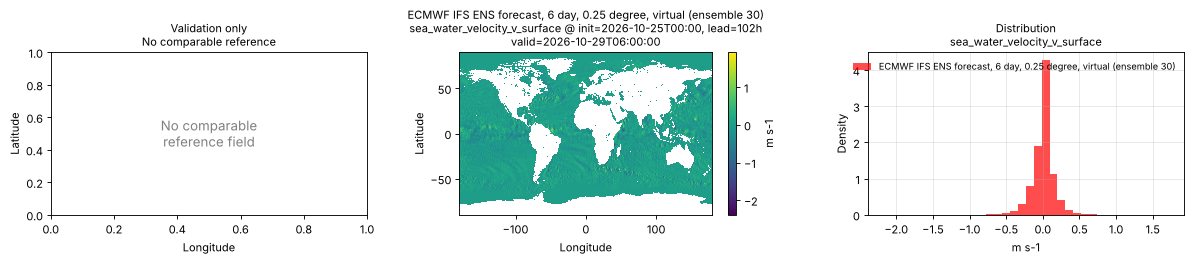
Spatial — init=2026-10-25T00:00, lead=102h, valid=2026-10-29T06:00:00, member=30 (reference not available)
| Source | min | mean | max |
|---|---|---|---|
| Validation | -2.39 | 0.001028 | 1.926 |
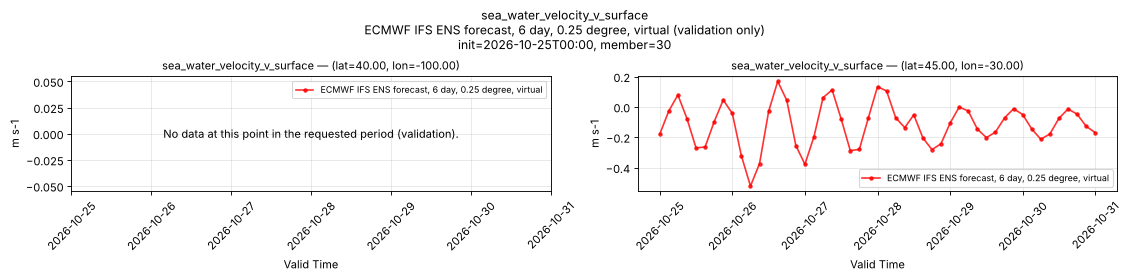
Temporal — init=2026-10-25T00:00, member=30
| Source | min | mean | max |
|---|---|---|---|
| P1 Validation | n/a | n/a | n/a |
| P2 Validation | -0.5221 | -0.1175 | 0.1683 |
Availability — 2911 of 3812 positions complete (incomplete 2024-04-01T00:00 → 2024-11-12T00:00)
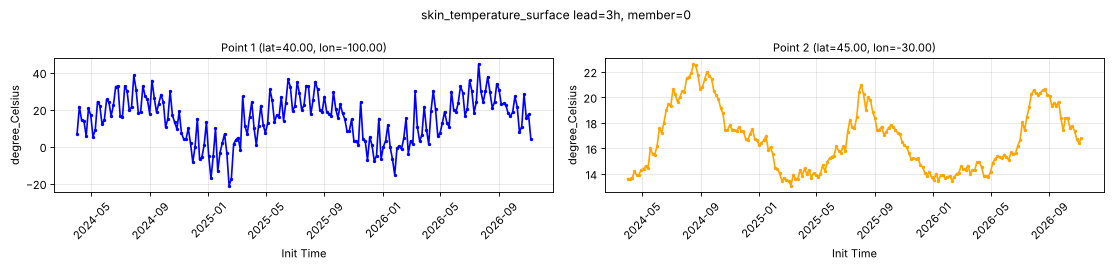
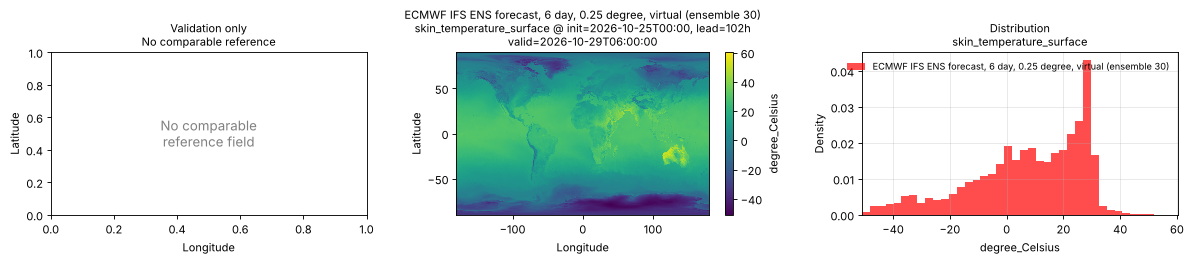
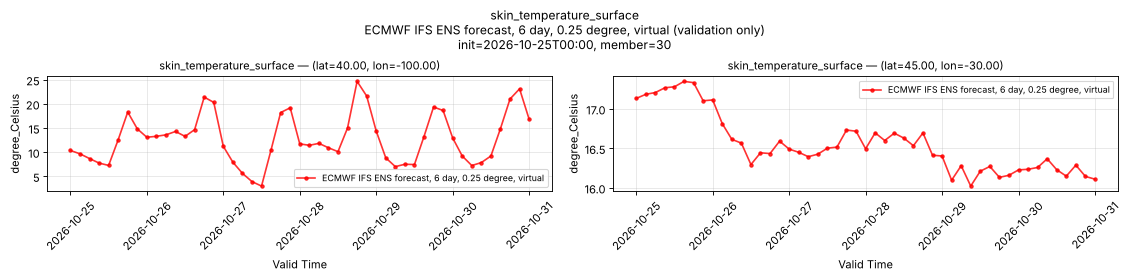
skin_temperature_surface
Metadata
| Field | Value |
|---|---|
| units | degree_Celsius |
| long_name | Skin temperature |
| short_name | skt |
| standard_name | surface_temperature |
| step_type | instant |
Point time series — 2024-04-01T00:00 - 2026-11-09T18:00, sampled lead=3h, member=0
| Point | min | mean | max |
|---|---|---|---|
| P1 | -21.19 | 15.14 | 44.49 |
| P2 | 13.07 | 16.68 | 22.58 |
Spatial — init=2026-10-25T00:00, lead=102h, valid=2026-10-29T06:00:00, member=30 (reference not available)
| Source | min | mean | max |
|---|---|---|---|
| Validation | -50.97 | 7.121 | 60.28 |
Temporal — init=2026-10-25T00:00, member=30
| Source | min | mean | max |
|---|---|---|---|
| P1 Validation | 3.004 | 12.86 | 24.7 |
| P2 Validation | 16.02 | 16.56 | 17.35 |
Availability — 3812 of 3812 positions complete
slope_of_sub_gridscale_orography_surface
Metadata
| Field | Value |
|---|---|
| units | 1 |
| long_name | Slope of sub-gridscale orography |
| short_name | slor |
| standard_name | n/a |
| step_type | instant |
| comment | Available for control member 0 only; members 1-50 are NaN. Time-invariant field published at lead time 0 only. |
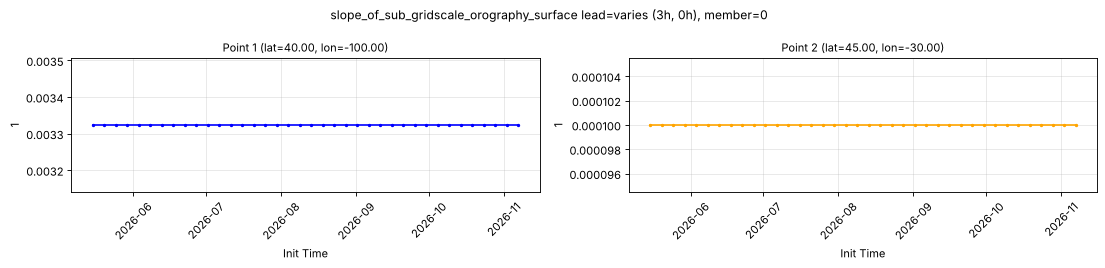
Point time series — 2024-04-01T00:00 - 2026-11-09T18:00, sampled lead=varies (3h, 0h), member=0
| Point | min | mean | max |
|---|---|---|---|
| P1 | 0.003323 | 0.003323 | 0.003323 |
| P2 | 9.999e-05 | 9.999e-05 | 9.999e-05 |
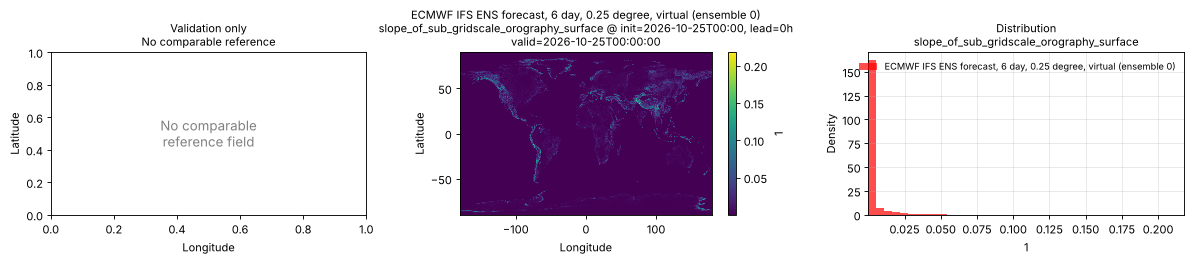
Spatial — init=2026-10-25T00:00, lead=0h, valid=2026-10-25T00:00:00, member=0 (reference not available)
| Source | min | mean | max |
|---|---|---|---|
| Validation | 9.999e-05 | 0.003158 | 0.2179 |
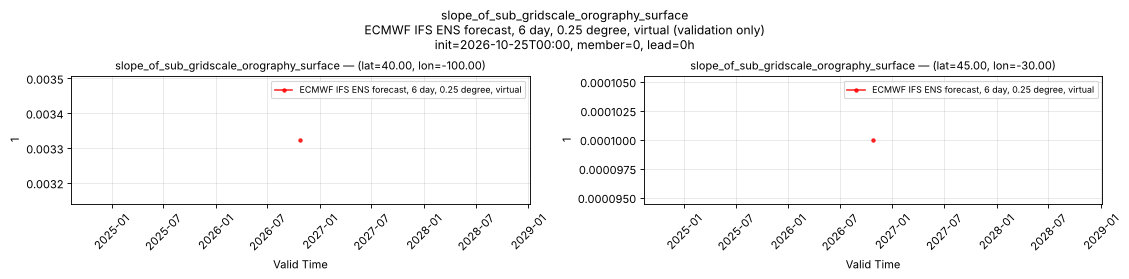
Temporal — init=2026-10-25T00:00, member=0, lead=0h
| Source | min | mean | max |
|---|---|---|---|
| P1 Validation | 0.003323 | 0.003323 | 0.003323 |
| P2 Validation | 9.999e-05 | 9.999e-05 | 9.999e-05 |
Availability — 727 of 3812 positions complete (incomplete 2024-04-01T00:00 → 2026-05-12T00:00)
snow_albedo_surface
Metadata
| Field | Value |
|---|---|
| units | percent |
| long_name | Snow albedo |
| short_name | asn |
| standard_name | n/a |
| step_type | instant |
| comment | Applies only where snow is present (snow_water_equivalent_surface > 0); snow-free cells hold placeholder values that also occur over snow. |
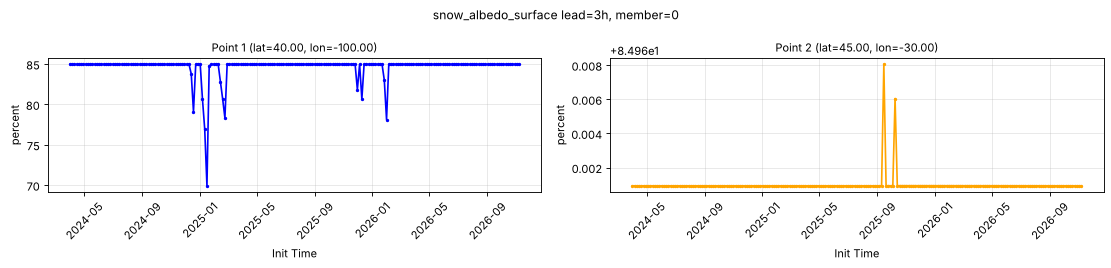
Point time series — 2024-04-01T00:00 - 2026-11-09T18:00, sampled lead=3h, member=0
| Point | min | mean | max |
|---|---|---|---|
| P1 | 69.92 | 84.64 | 84.97 |
| P2 | 84.96 | 84.96 | 84.97 |
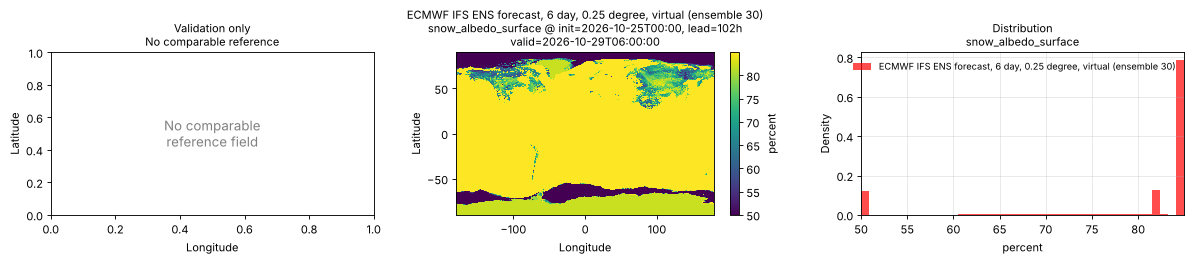
Spatial — init=2026-10-25T00:00, lead=102h, valid=2026-10-29T06:00:00, member=30 (reference not available)
| Source | min | mean | max |
|---|---|---|---|
| Validation | 50 | 79.58 | 84.96 |
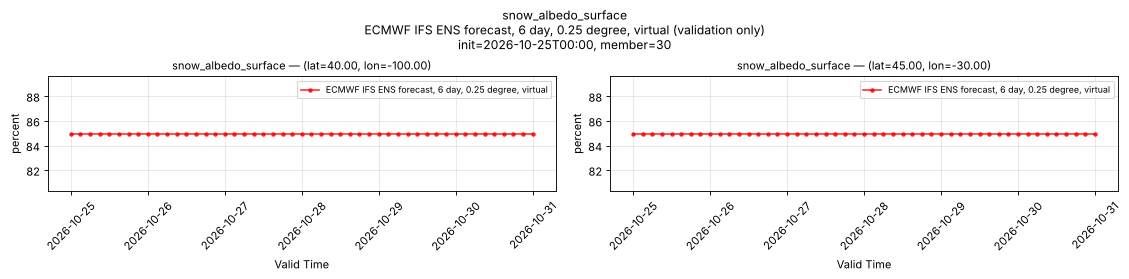
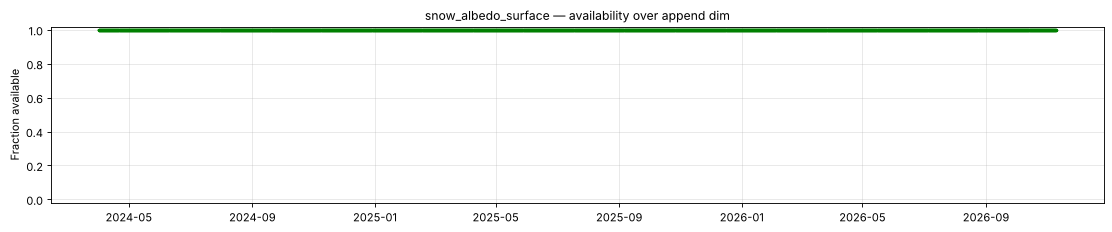
Temporal — init=2026-10-25T00:00, member=30
| Source | min | mean | max |
|---|---|---|---|
| P1 Validation | 84.96 | 84.96 | 84.96 |
| P2 Validation | 84.96 | 84.96 | 84.96 |
Availability — 3812 of 3812 positions complete
snow_density_surface
Metadata
| Field | Value |
|---|---|
| units | kg m-3 |
| long_name | Snow density |
| short_name | rsn |
| standard_name | surface_snow_density |
| step_type | instant |
| comment | Applies only where snow is present (snow_water_equivalent_surface > 0); snow-free cells hold placeholder values that also occur over snow. |
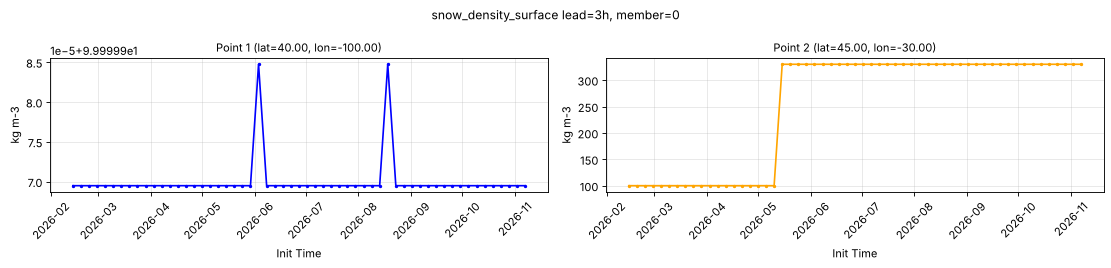
Point time series — 2024-04-01T00:00 - 2026-11-09T18:00, sampled lead=3h, member=0
| Point | min | mean | max |
|---|---|---|---|
| P1 | 100 | 100 | 100 |
| P2 | 100 | 253.3 | 330 |
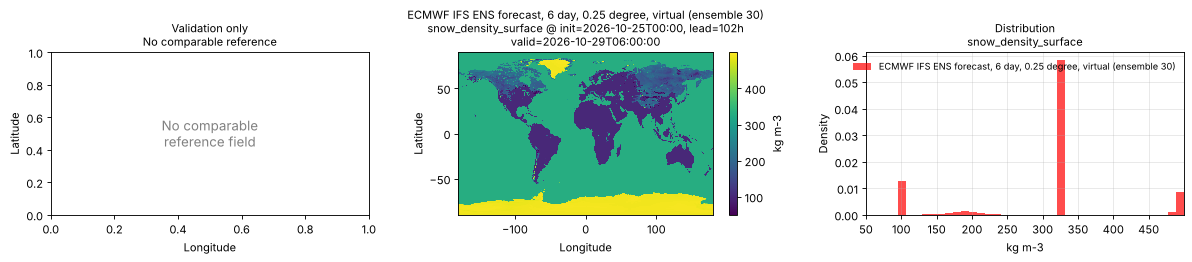
Spatial — init=2026-10-25T00:00, lead=102h, valid=2026-10-29T06:00:00, member=30 (reference not available)
| Source | min | mean | max |
|---|---|---|---|
| Validation | 50 | 302.7 | 500 |
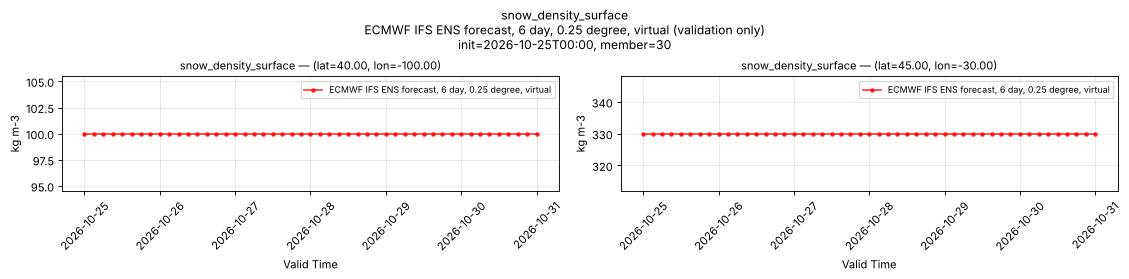
Temporal — init=2026-10-25T00:00, member=30
| Source | min | mean | max |
|---|---|---|---|
| P1 Validation | 100 | 100 | 100 |
| P2 Validation | 330 | 330 | 330 |
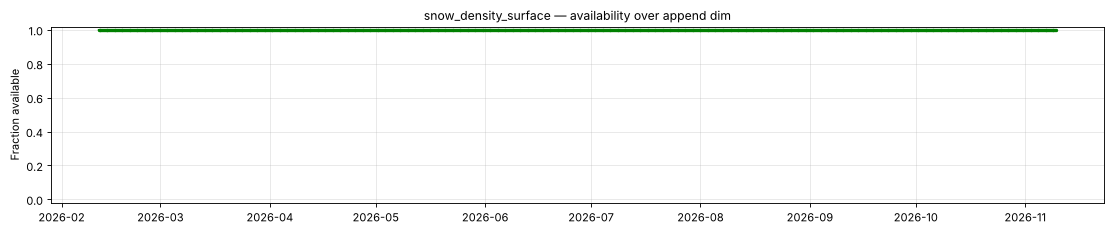
Availability — 1086 of 3812 positions complete (incomplete 2024-04-01T00:00 → 2026-02-11T06:00)
snow_water_equivalent_surface
Metadata
| Field | Value |
|---|---|
| units | m |
| long_name | Snow depth water equivalent |
| short_name | sd |
| standard_name | lwe_thickness_of_surface_snow_amount |
| step_type | instant |
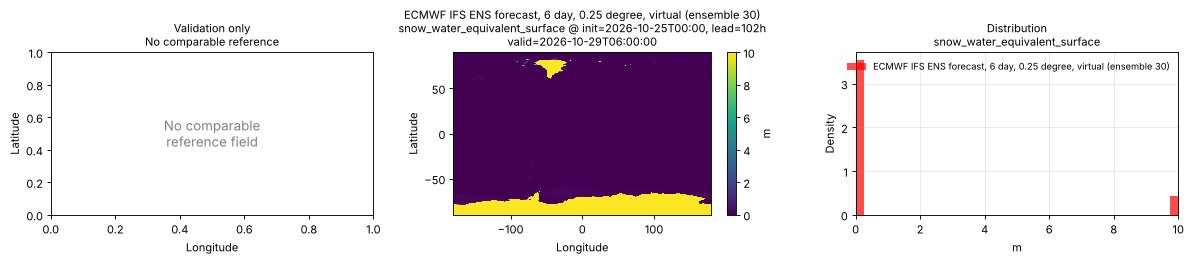
| comment | Capped at 10 m; most of the Antarctic and Greenland ice sheets sit at this cap. |
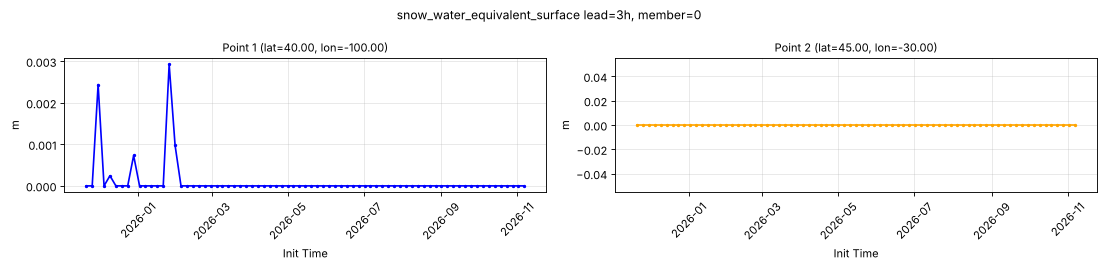
Point time series — 2024-04-01T00:00 - 2026-11-09T18:00, sampled lead=3h, member=0
| Point | min | mean | max |
|---|---|---|---|
| P1 | 0 | 9.766e-05 | 0.00293 |
| P2 | 0 | 0 | 0 |
Spatial — init=2026-10-25T00:00, lead=102h, valid=2026-10-29T06:00:00, member=30 (reference not available)
| Source | min | mean | max |
|---|---|---|---|
| Validation | 0 | 1.113 | 10 |
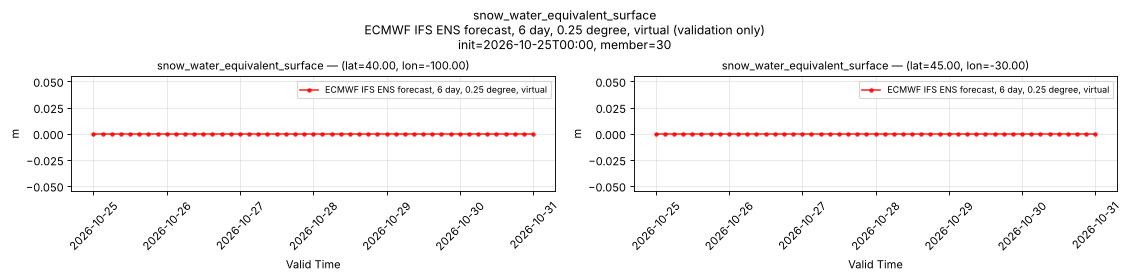
Temporal — init=2026-10-25T00:00, member=30
| Source | min | mean | max |
|---|---|---|---|
| P1 Validation | 0 | 0 | 0 |
| P2 Validation | 0 | 0 | 0 |
Availability — 1418 of 3812 positions complete (incomplete 2024-04-01T00:00 → 2025-11-20T06:00)
snowfall_water_equivalent_run_total_surface
Metadata
| Field | Value |
|---|---|
| units | kg m-2 |
| long_name | Snowfall water equivalent |
| short_name | sf |
| standard_name | snowfall_amount |
| step_type | accum |
| comment | Accumulated since forecast initialization. |
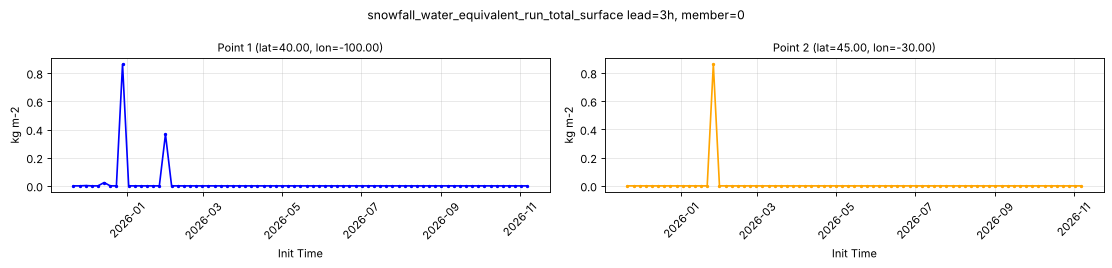
Point time series — 2024-04-01T00:00 - 2026-11-09T18:00, sampled lead=3h, member=0
| Point | min | mean | max |
|---|---|---|---|
| P1 | 0 | 0.01673 | 0.8631 |
| P2 | 0 | 0.01148 | 0.8612 |
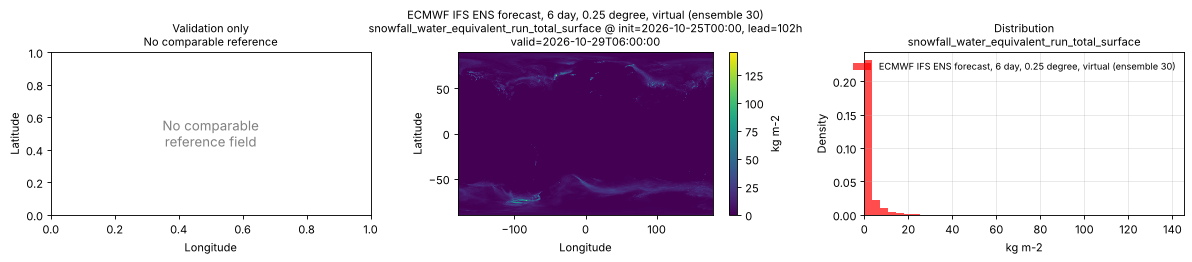
Spatial — init=2026-10-25T00:00, lead=102h, valid=2026-10-29T06:00:00, member=30 (reference not available)
| Source | min | mean | max |
|---|---|---|---|
| Validation | 0 | 1.861 | 145.3 |
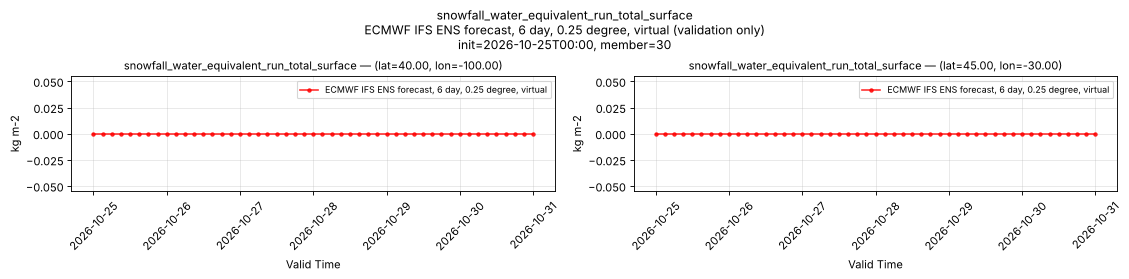
Temporal — init=2026-10-25T00:00, member=30
| Source | min | mean | max |
|---|---|---|---|
| P1 Validation | 0 | 0 | 0 |
| P2 Validation | 0 | 0 | 0 |
Availability — 1418 of 3812 positions complete (incomplete 2024-04-01T00:00 → 2025-11-20T06:00)
soil_temperature_layer_1
Metadata
| Field | Value |
|---|---|
| units | degree_Celsius |
| long_name | Soil temperature |
| short_name | sot |
| standard_name | soil_temperature |
| step_type | instant |
| comment | ECMWF soil level 1, the uppermost soil layer. Over water this is the sea surface temperature, not a soil temperature. |
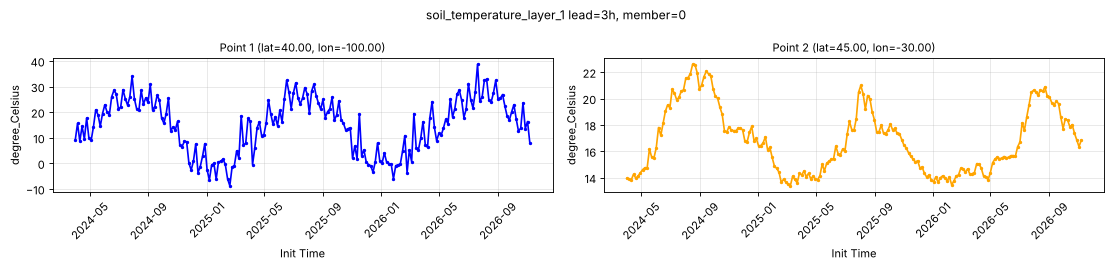
Point time series — 2024-04-01T00:00 - 2026-11-09T18:00, sampled lead=3h, member=0
| Point | min | mean | max |
|---|---|---|---|
| P1 | -8.762 | 15 | 38.72 |
| P2 | 13.38 | 16.83 | 22.61 |
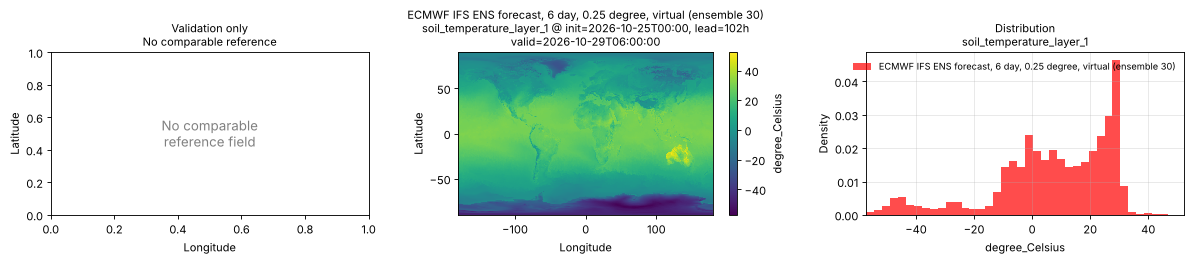
Spatial — init=2026-10-25T00:00, lead=102h, valid=2026-10-29T06:00:00, member=30 (reference not available)
| Source | min | mean | max |
|---|---|---|---|
| Validation | -57.18 | 7.186 | 52.32 |
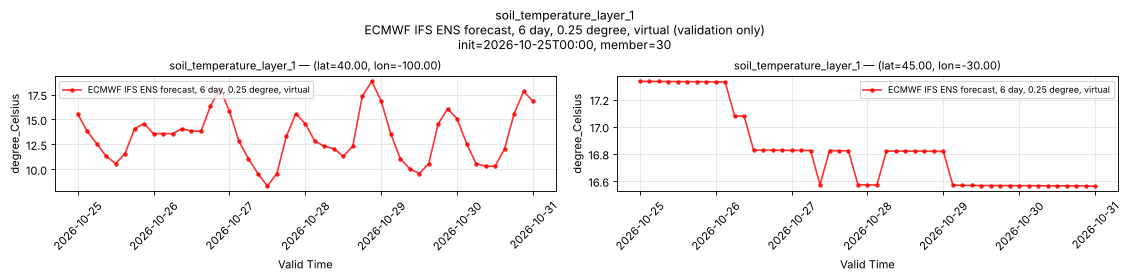
Temporal — init=2026-10-25T00:00, member=30
| Source | min | mean | max |
|---|---|---|---|
| P1 Validation | 8.325 | 13.31 | 18.82 |
| P2 Validation | 16.56 | 16.83 | 17.33 |
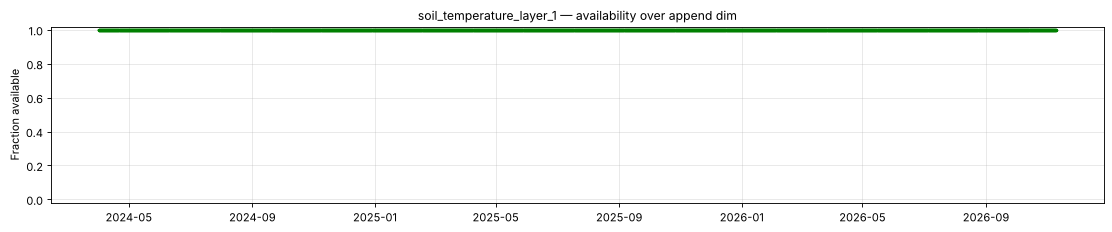
Availability — 3812 of 3812 positions complete
soil_temperature_layer_2
Metadata
| Field | Value |
|---|---|
| units | degree_Celsius |
| long_name | Soil temperature |
| short_name | sot |
| standard_name | soil_temperature |
| step_type | instant |
| comment | ECMWF soil level 2, the second soil layer from the surface. Over water this is the sea surface temperature, not a soil temperature. |
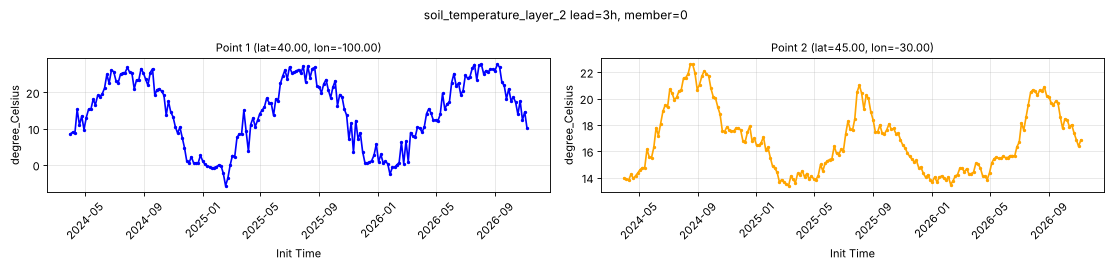
Point time series — 2024-04-01T00:00 - 2026-11-09T18:00, sampled lead=3h, member=0
| Point | min | mean | max |
|---|---|---|---|
| P1 | -5.749 | 14.65 | 27.75 |
| P2 | 13.38 | 16.83 | 22.6 |
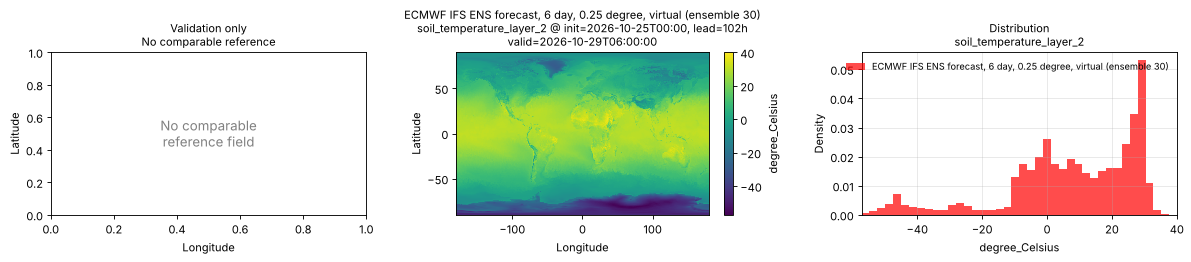
Spatial — init=2026-10-25T00:00, lead=102h, valid=2026-10-29T06:00:00, member=30 (reference not available)
| Source | min | mean | max |
|---|---|---|---|
| Validation | -57.17 | 7.512 | 40.08 |
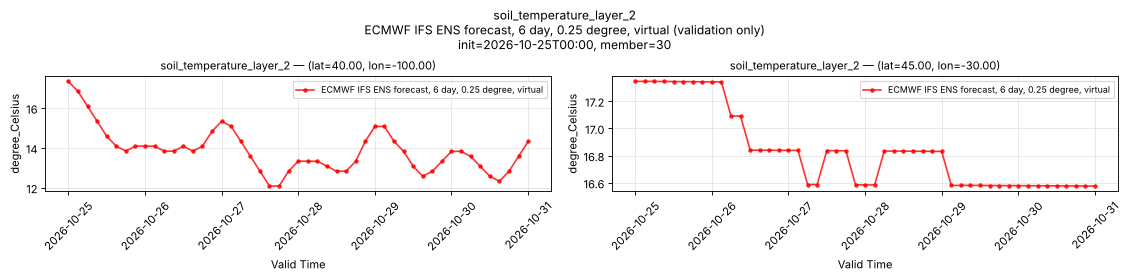
Temporal — init=2026-10-25T00:00, member=30
| Source | min | mean | max |
|---|---|---|---|
| P1 Validation | 12.09 | 13.87 | 17.35 |
| P2 Validation | 16.58 | 16.84 | 17.35 |
Availability — 3812 of 3812 positions complete
soil_temperature_layer_3
Metadata
| Field | Value |
|---|---|
| units | degree_Celsius |
| long_name | Soil temperature |
| short_name | sot |
| standard_name | soil_temperature |
| step_type | instant |
| comment | ECMWF soil level 3. Over water this is the sea surface temperature, not a soil temperature. |
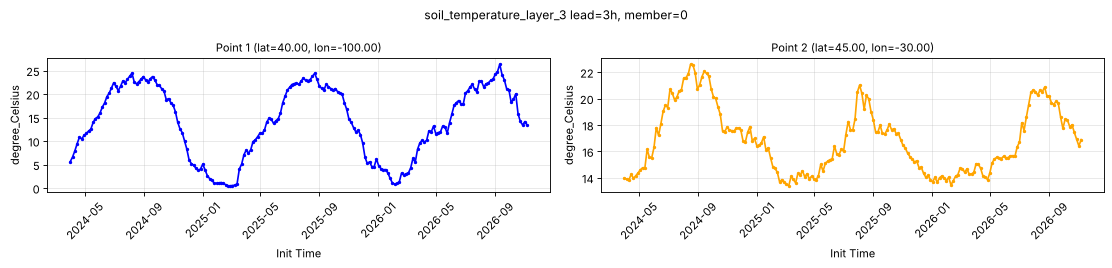
Point time series — 2024-04-01T00:00 - 2026-11-09T18:00, sampled lead=3h, member=0
| Point | min | mean | max |
|---|---|---|---|
| P1 | 0.4855 | 14.08 | 26.33 |
| P2 | 13.39 | 16.83 | 22.6 |
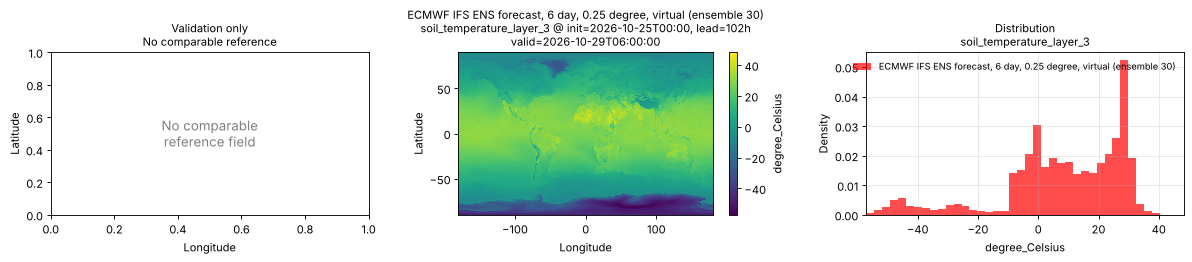
Spatial — init=2026-10-25T00:00, lead=102h, valid=2026-10-29T06:00:00, member=30 (reference not available)
| Source | min | mean | max |
|---|---|---|---|
| Validation | -57.13 | 8.164 | 48.37 |
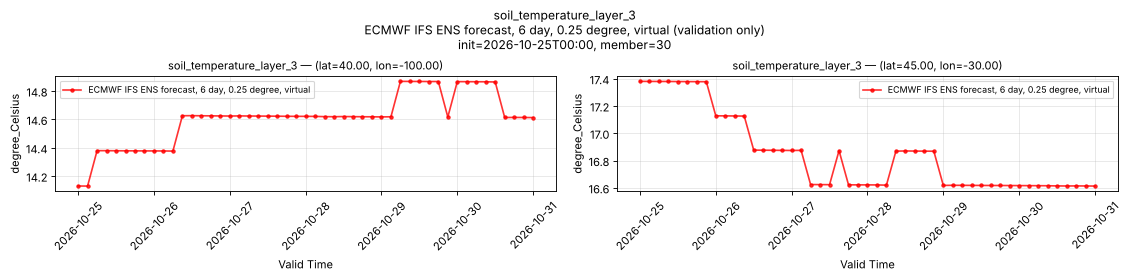
Temporal — init=2026-10-25T00:00, member=30
| Source | min | mean | max |
|---|---|---|---|
| P1 Validation | 14.13 | 14.61 | 14.87 |
| P2 Validation | 16.61 | 16.85 | 17.38 |
Availability — 3812 of 3812 positions complete
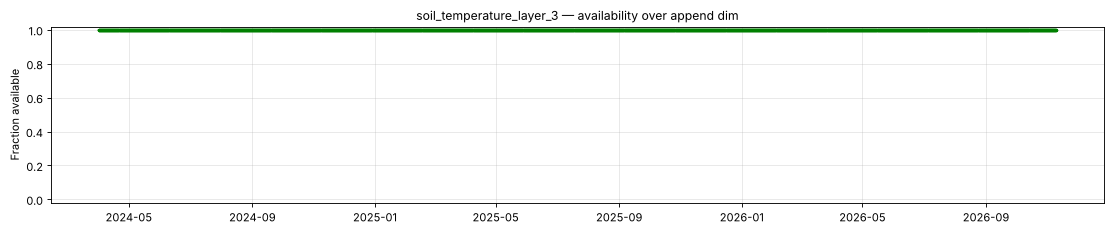
soil_temperature_layer_4
Metadata
| Field | Value |
|---|---|
| units | degree_Celsius |
| long_name | Soil temperature |
| short_name | sot |
| standard_name | soil_temperature |
| step_type | instant |
| comment | ECMWF soil level 4. Over water this is the sea surface temperature, not a soil temperature. |
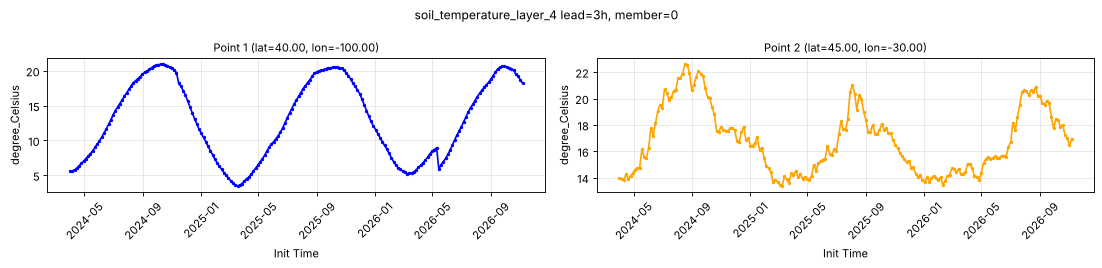
Point time series — 2024-04-01T00:00 - 2026-11-09T18:00, sampled lead=3h, member=0
| Point | min | mean | max |
|---|---|---|---|
| P1 | 3.489 | 13.01 | 20.95 |
| P2 | 13.39 | 16.83 | 22.6 |
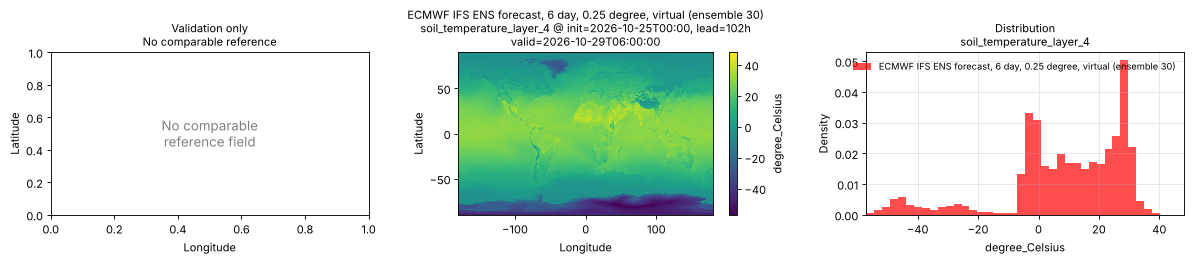
Spatial — init=2026-10-25T00:00, lead=102h, valid=2026-10-29T06:00:00, member=30 (reference not available)
| Source | min | mean | max |
|---|---|---|---|
| Validation | -57.07 | 8.686 | 48.18 |
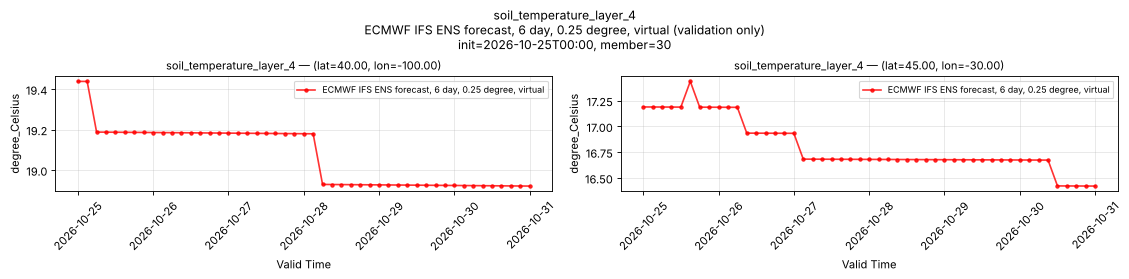
Temporal — init=2026-10-25T00:00, member=30
| Source | min | mean | max |
|---|---|---|---|
| P1 Validation | 18.92 | 19.07 | 19.44 |
| P2 Validation | 16.42 | 16.8 | 17.44 |
Availability — 3812 of 3812 positions complete
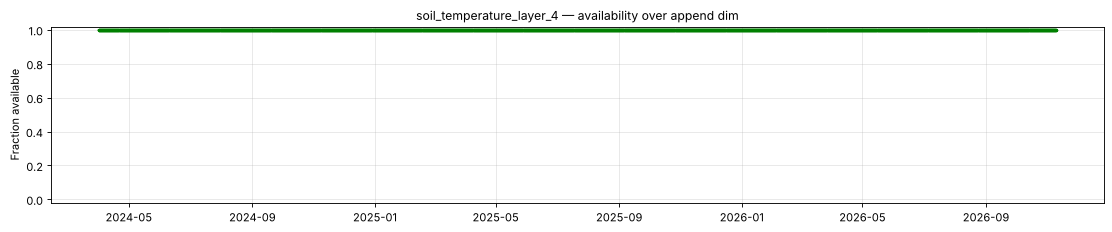
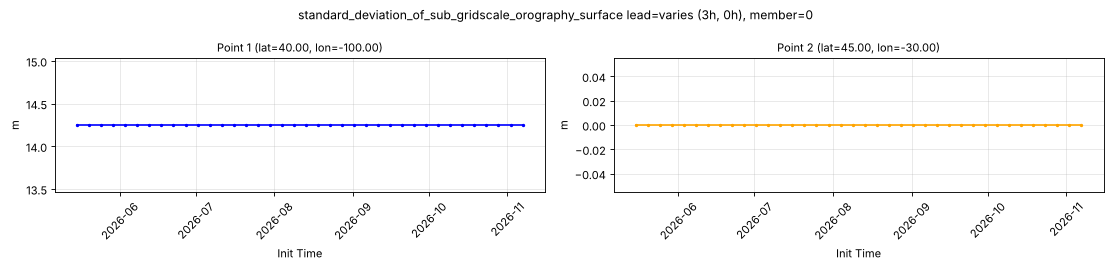
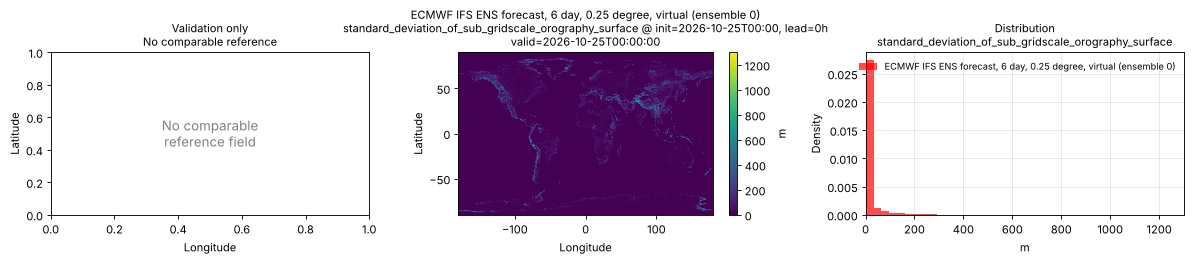
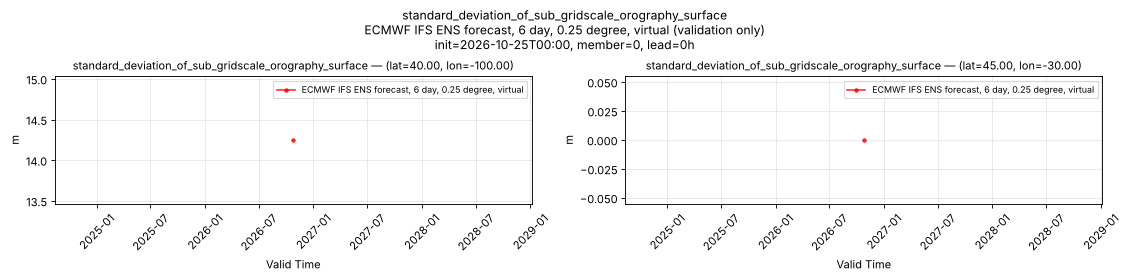
standard_deviation_of_sub_gridscale_orography_surface
Metadata
| Field | Value |
|---|---|
| units | m |
| long_name | Standard deviation of sub-gridscale orography |
| short_name | sdor |
| standard_name | n/a |
| step_type | instant |
| comment | Available for control member 0 only; members 1-50 are NaN. Time-invariant field published at lead time 0 only. |
Point time series — 2024-04-01T00:00 - 2026-11-09T18:00, sampled lead=varies (3h, 0h), member=0
| Point | min | mean | max |
|---|---|---|---|
| P1 | 14.25 | 14.25 | 14.25 |
| P2 | 0 | 0 | 0 |
Spatial — init=2026-10-25T00:00, lead=0h, valid=2026-10-25T00:00:00, member=0 (reference not available)
| Source | min | mean | max |
|---|---|---|---|
| Validation | 0 | 15.13 | 1301 |
Temporal — init=2026-10-25T00:00, member=0, lead=0h
| Source | min | mean | max |
|---|---|---|---|
| P1 Validation | 14.25 | 14.25 | 14.25 |
| P2 Validation | 0 | 0 | 0 |
Availability — 727 of 3812 positions complete (incomplete 2024-04-01T00:00 → 2026-05-12T00:00)
temperature_2m
Metadata
| Field | Value |
|---|---|
| units | degree_Celsius |
| long_name | 2 metre temperature |
| short_name | 2t |
| standard_name | air_temperature |
| step_type | instant |
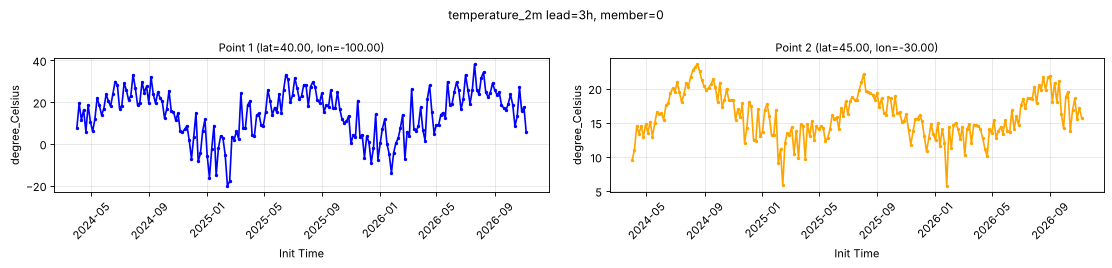
Point time series — 2024-04-01T00:00 - 2026-11-09T18:00, sampled lead=3h, member=0
| Point | min | mean | max |
|---|---|---|---|
| P1 | -20.08 | 14.51 | 38.13 |
| P2 | 5.774 | 16.03 | 23.56 |
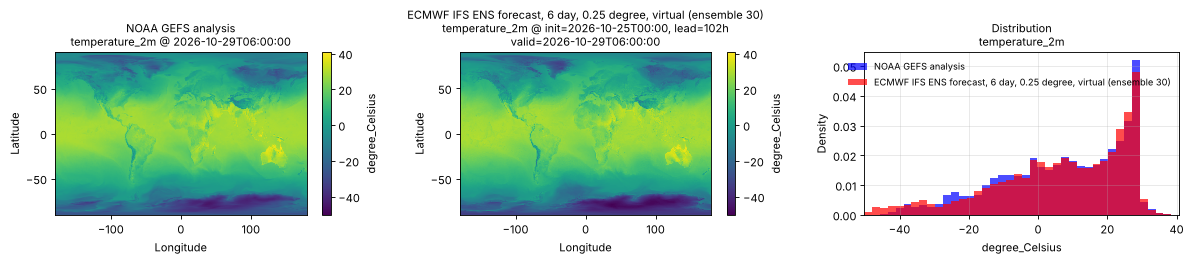
Spatial — init=2026-10-25T00:00, lead=102h, valid=2026-10-29T06:00:00, member=30 (reference at 2026-10-29T06:00:00)
| Source | min | mean | max |
|---|---|---|---|
| Validation | -50.18 | 6.515 | 39.57 |
| Reference | -45.25 | 6.917 | 40.75 |
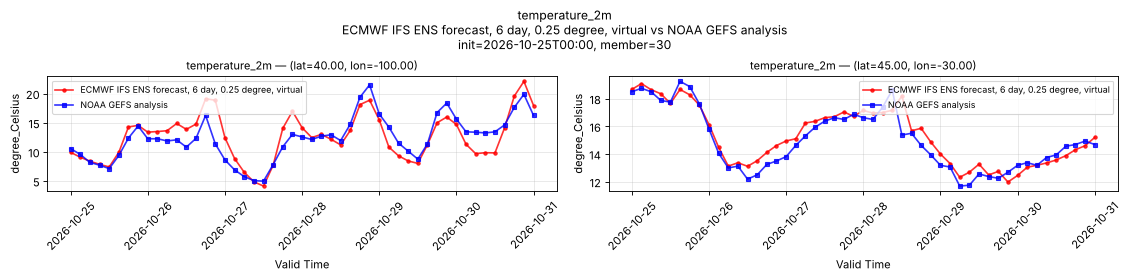
Temporal — init=2026-10-25T00:00, member=30
| Source | min | mean | max |
|---|---|---|---|
| P1 Validation | 4.127 | 12.57 | 22.1 |
| P1 Reference | 4.969 | 12.34 | 21.5 |
| P2 Validation | 11.98 | 15.27 | 19.09 |
| P2 Reference | 11.69 | 15 | 19.25 |
Availability — 3812 of 3812 positions complete
total_cloud_cover_atmosphere
Metadata
| Field | Value |
|---|---|
| units | percent |
| long_name | Total cloud cover |
| short_name | tcc |
| standard_name | cloud_area_fraction |
| step_type | instant |
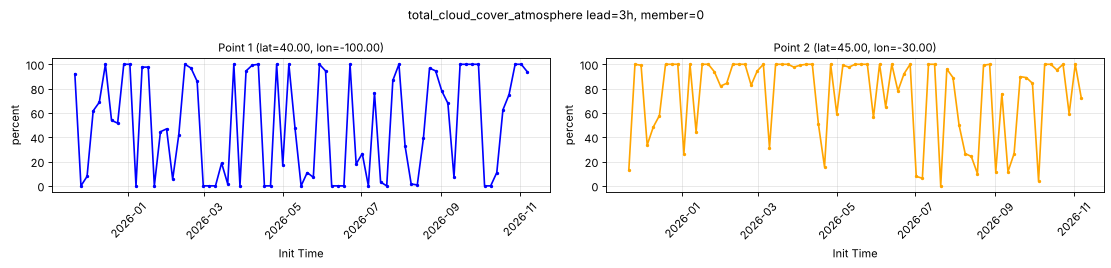
Point time series — 2024-04-01T00:00 - 2026-11-09T18:00, sampled lead=3h, member=0
| Point | min | mean | max |
|---|---|---|---|
| P1 | 0 | 50.89 | 100 |
| P2 | 0 | 75.09 | 100 |
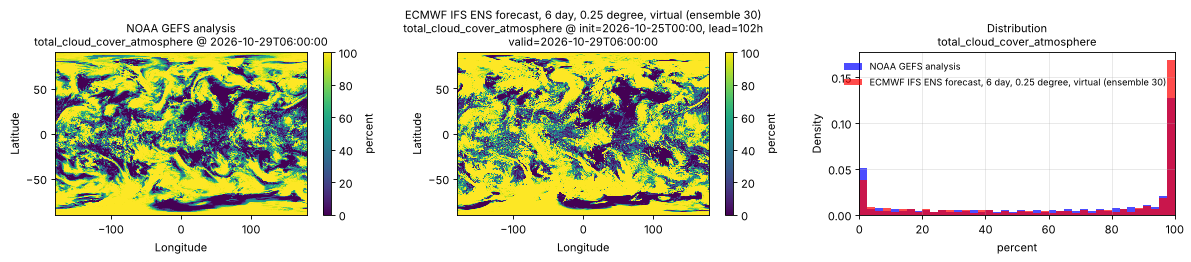
Spatial — init=2026-10-25T00:00, lead=102h, valid=2026-10-29T06:00:00, member=30 (reference at 2026-10-29T06:00:00)
| Source | min | mean | max |
|---|---|---|---|
| Validation | 0 | 67.78 | 100 |
| Reference | 0 | 62.73 | 100 |
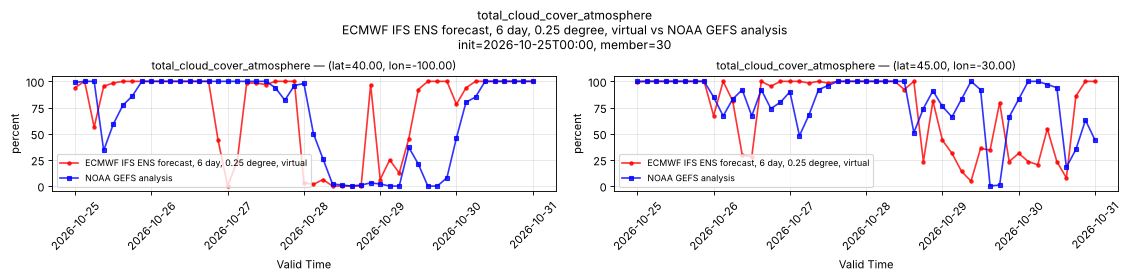
Temporal — init=2026-10-25T00:00, member=30
| Source | min | mean | max |
|---|---|---|---|
| P1 Validation | 0 | 72.78 | 100 |
| P1 Reference | 0 | 67.08 | 100 |
| P2 Validation | 4.688 | 73.65 | 100 |
| P2 Reference | 0 | 80.98 | 100 |
Availability — 1418 of 3812 positions complete (incomplete 2024-04-01T00:00 → 2025-11-20T06:00)
total_column_cloud_ice_water_atmosphere
Metadata
| Field | Value |
|---|---|
| units | kg m-2 |
| long_name | Total column cloud ice water |
| short_name | tciw |
| standard_name | atmosphere_mass_content_of_cloud_ice |
| step_type | instant |
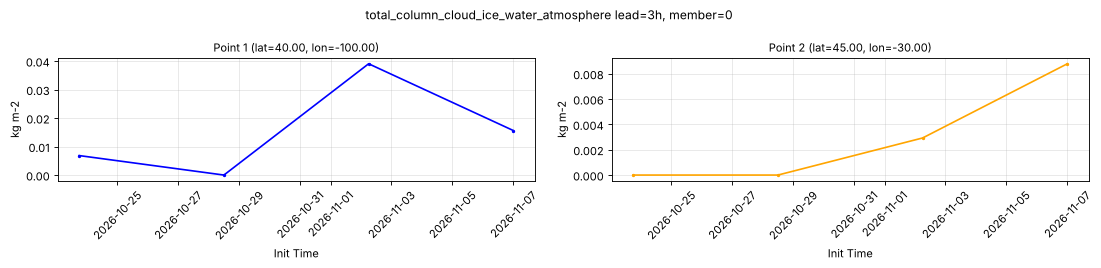
Point time series — 2024-04-01T00:00 - 2026-11-09T18:00, sampled lead=3h, member=0
| Point | min | mean | max |
|---|---|---|---|
| P1 | 0 | 0.01538 | 0.03906 |
| P2 | 0 | 0.00293 | 0.008789 |
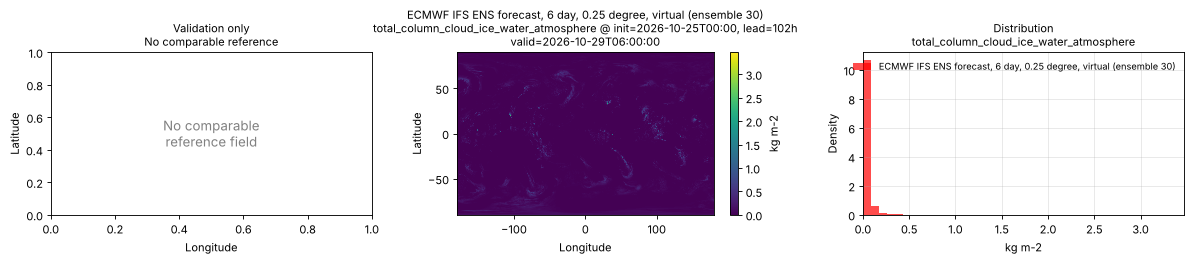
Spatial — init=2026-10-25T00:00, lead=102h, valid=2026-10-29T06:00:00, member=30 (reference not available)
| Source | min | mean | max |
|---|---|---|---|
| Validation | 0 | 0.02258 | 3.469 |
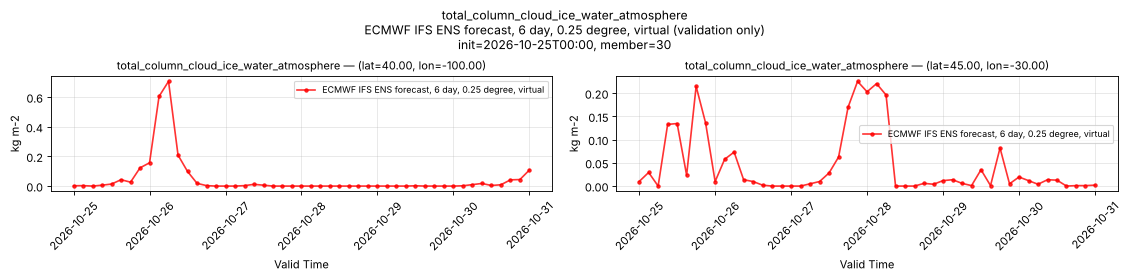
Temporal — init=2026-10-25T00:00, member=30
| Source | min | mean | max |
|---|---|---|---|
| P1 Validation | 0 | 0.04642 | 0.707 |
| P2 Validation | 0 | 0.04486 | 0.2256 |
Availability — 83 of 3812 positions complete (incomplete 2024-04-01T00:00 → 2026-10-20T00:00)
total_column_cloud_liquid_water_atmosphere
Metadata
| Field | Value |
|---|---|
| units | kg m-2 |
| long_name | Total column cloud liquid water |
| short_name | tclw |
| standard_name | atmosphere_mass_content_of_cloud_liquid_water |
| step_type | instant |
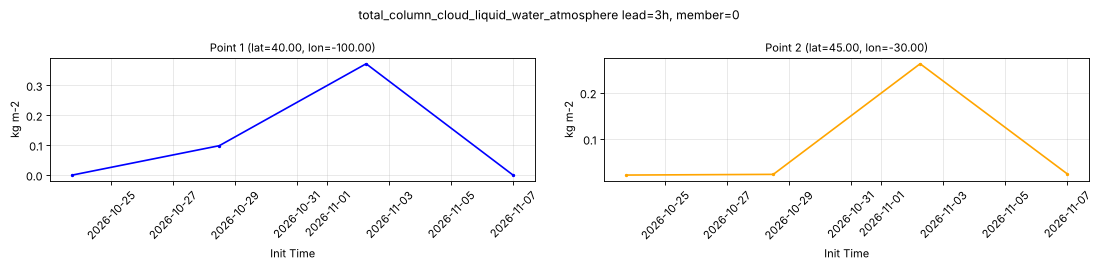
Point time series — 2024-04-01T00:00 - 2026-11-09T18:00, sampled lead=3h, member=0
| Point | min | mean | max |
|---|---|---|---|
| P1 | 0 | 0.1176 | 0.3721 |
| P2 | 0.02246 | 0.08362 | 0.2627 |
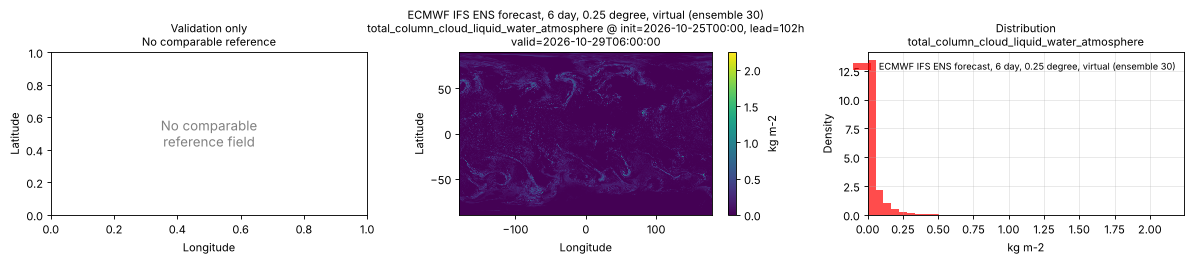
Spatial — init=2026-10-25T00:00, lead=102h, valid=2026-10-29T06:00:00, member=30 (reference not available)
| Source | min | mean | max |
|---|---|---|---|
| Validation | 0 | 0.04459 | 2.242 |
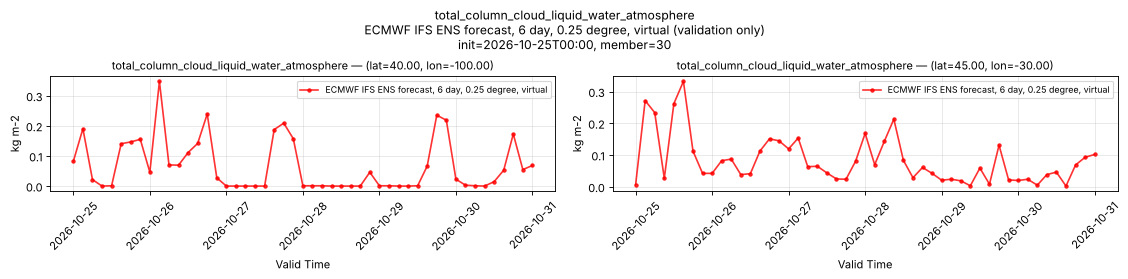
Temporal — init=2026-10-25T00:00, member=30
| Source | min | mean | max |
|---|---|---|---|
| P1 Validation | 0 | 0.06747 | 0.3477 |
| P2 Validation | 0.001953 | 0.08248 | 0.332 |
Availability — 83 of 3812 positions complete (incomplete 2024-04-01T00:00 → 2026-10-20T00:00)
total_column_rain_water_atmosphere
Metadata
| Field | Value |
|---|---|
| units | kg m-2 |
| long_name | Total column rain water |
| short_name | tcrw |
| standard_name | n/a |
| step_type | instant |
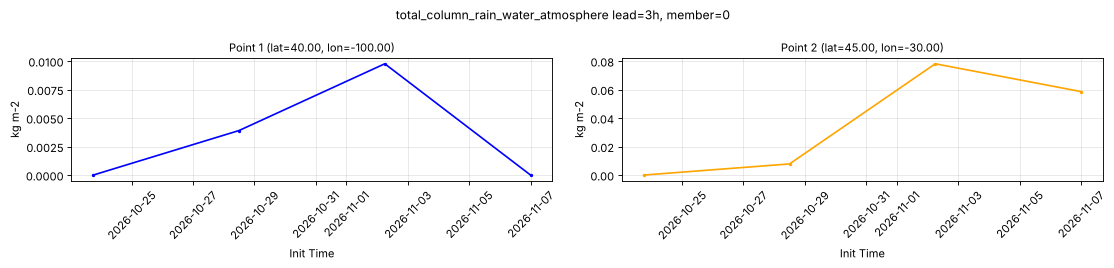
Point time series — 2024-04-01T00:00 - 2026-11-09T18:00, sampled lead=3h, member=0
| Point | min | mean | max |
|---|---|---|---|
| P1 | 0 | 0.003418 | 0.009766 |
| P2 | 0 | 0.03613 | 0.07812 |
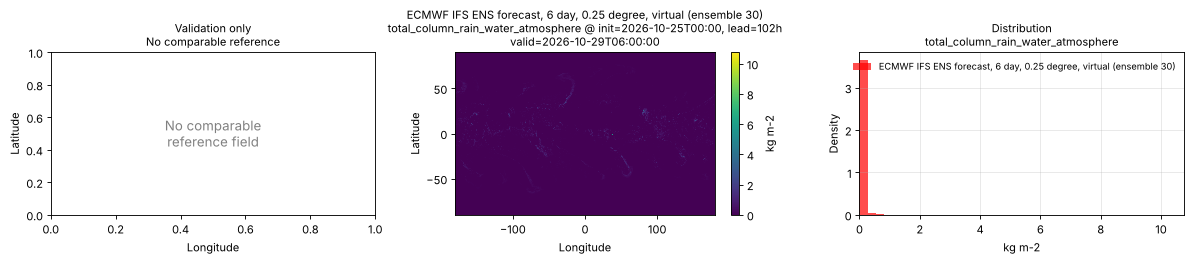
Spatial — init=2026-10-25T00:00, lead=102h, valid=2026-10-29T06:00:00, member=30 (reference not available)
| Source | min | mean | max |
|---|---|---|---|
| Validation | 0 | 0.01987 | 10.76 |
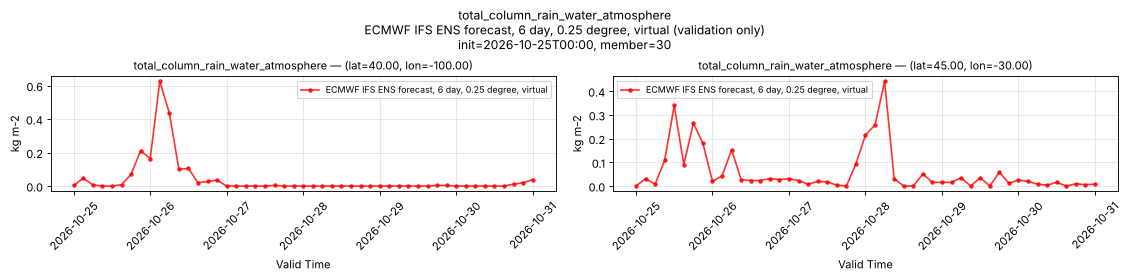
Temporal — init=2026-10-25T00:00, member=30
| Source | min | mean | max |
|---|---|---|---|
| P1 Validation | 0 | 0.03962 | 0.625 |
| P2 Validation | 0 | 0.05812 | 0.4414 |
Availability — 83 of 3812 positions complete (incomplete 2024-04-01T00:00 → 2026-10-20T00:00)
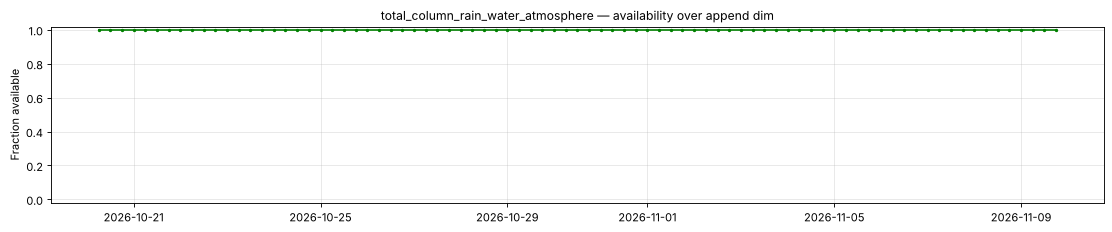
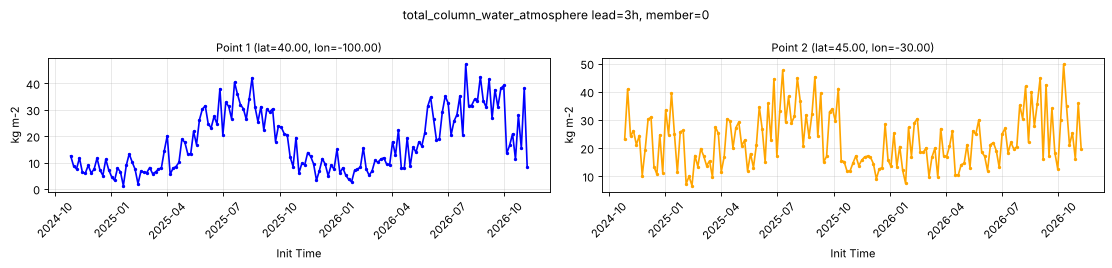
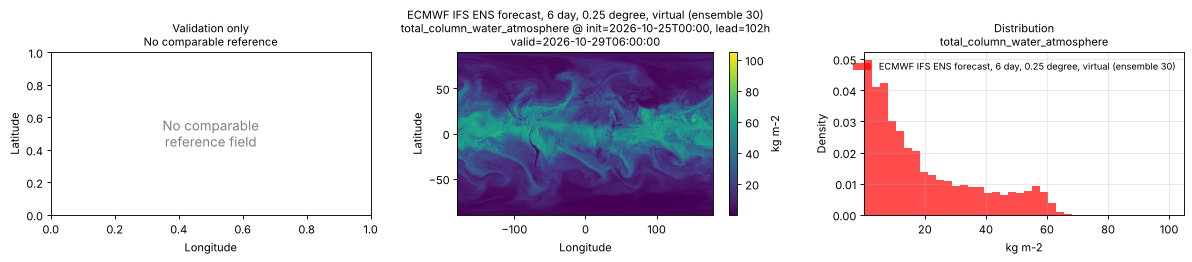
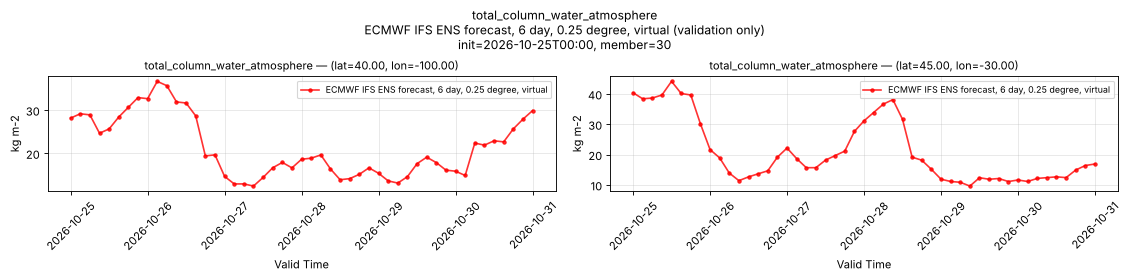
total_column_water_atmosphere
Metadata
| Field | Value |
|---|---|
| units | kg m-2 |
| long_name | Total column water |
| short_name | tcw |
| standard_name | atmosphere_mass_content_of_water |
| step_type | instant |
Point time series — 2024-04-01T00:00 - 2026-11-09T18:00, sampled lead=3h, member=0
| Point | min | mean | max |
|---|---|---|---|
| P1 | 1.223 | 17.78 | 47.21 |
| P2 | 6.617 | 22.76 | 49.74 |
Spatial — init=2026-10-25T00:00, lead=102h, valid=2026-10-29T06:00:00, member=30 (reference not available)
| Source | min | mean | max |
|---|---|---|---|
| Validation | 0.1246 | 19.51 | 104.9 |
Temporal — init=2026-10-25T00:00, member=30
| Source | min | mean | max |
|---|---|---|---|
| P1 Validation | 12.43 | 21.4 | 36.66 |
| P2 Validation | 9.62 | 21.05 | 44.16 |
Availability — 2986 of 3812 positions complete (incomplete 2024-04-01T00:00 → 2024-10-24T06:00)
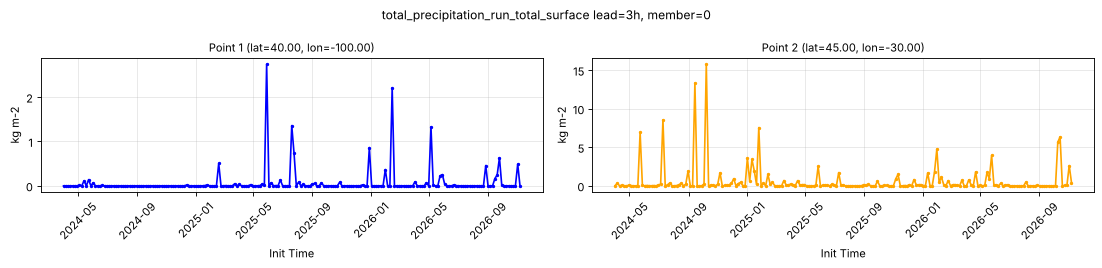
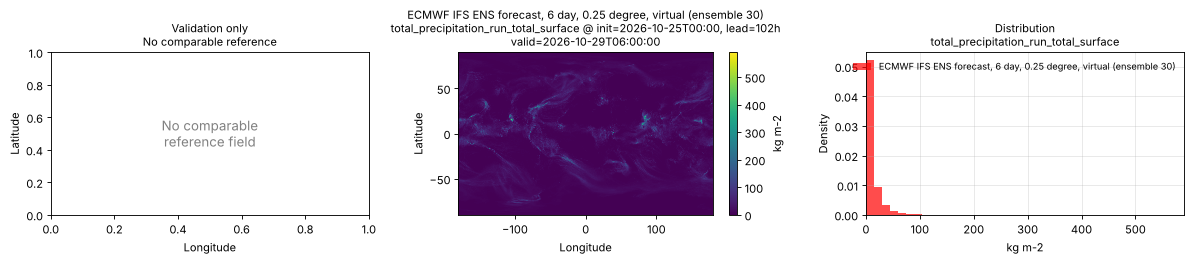
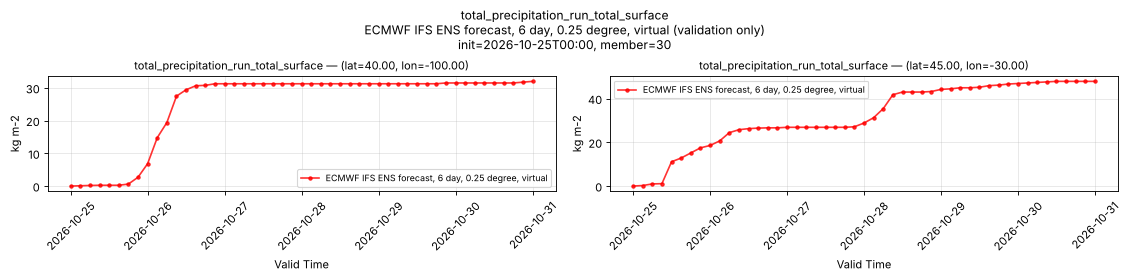
total_precipitation_run_total_surface
Metadata
| Field | Value |
|---|---|
| units | kg m-2 |
| long_name | Total precipitation |
| short_name | tp |
| standard_name | precipitation_amount |
| step_type | accum |
| comment | Accumulated since forecast initialization. |
Point time series — 2024-04-01T00:00 - 2026-11-09T18:00, sampled lead=3h, member=0
| Point | min | mean | max |
|---|---|---|---|
| P1 | 0 | 0.0695 | 2.741 |
| P2 | 0 | 0.6126 | 15.77 |
Spatial — init=2026-10-25T00:00, lead=102h, valid=2026-10-29T06:00:00, member=30 (reference not available)
| Source | min | mean | max |
|---|---|---|---|
| Validation | 0 | 10.78 | 590.1 |
Temporal — init=2026-10-25T00:00, member=30
| Source | min | mean | max |
|---|---|---|---|
| P1 Validation | 0 | 25.09 | 31.98 |
| P2 Validation | 0 | 32.02 | 47.85 |
Availability — 3812 of 3812 positions complete
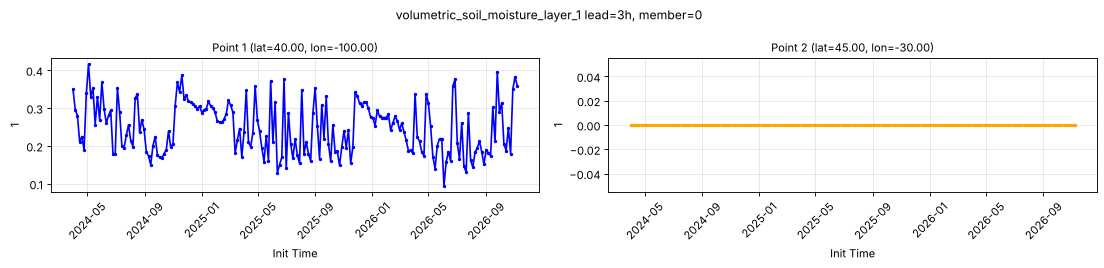
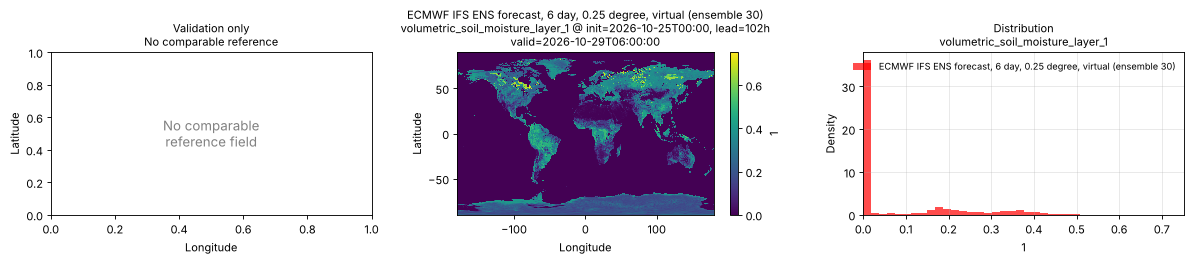
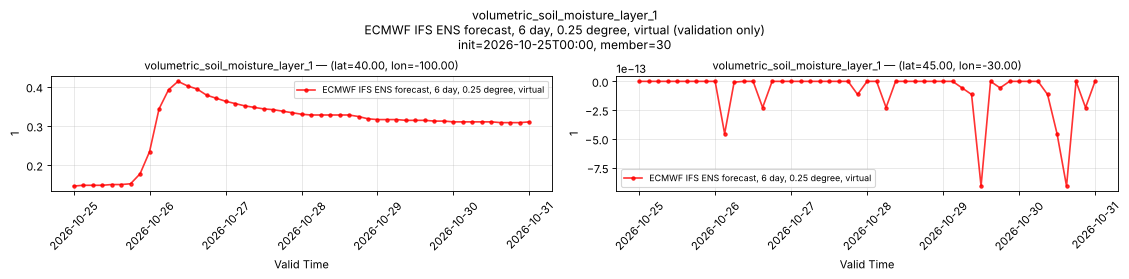
volumetric_soil_moisture_layer_1
Metadata
| Field | Value |
|---|---|
| units | 1 |
| long_name | Volumetric soil moisture |
| short_name | vsw |
| standard_name | volume_fraction_of_condensed_water_in_soil |
| step_type | instant |
| comment | ECMWF soil level 1, the uppermost soil layer. Applies over land only; over water the values are near zero, so mask with land_sea_mask_surface. |
Point time series — 2024-04-01T00:00 - 2026-11-09T18:00, sampled lead=3h, member=0
| Point | min | mean | max |
|---|---|---|---|
| P1 | 0.09473 | 0.2481 | 0.416 |
| P2 | 0 | 0 | 0 |
Spatial — init=2026-10-25T00:00, lead=102h, valid=2026-10-29T06:00:00, member=30 (reference not available)
| Source | min | mean | max |
|---|---|---|---|
| Validation | -5.684e-14 | 0.08377 | 0.752 |
Temporal — init=2026-10-25T00:00, member=30
| Source | min | mean | max |
|---|---|---|---|
| P1 Validation | 0.1465 | 0.3031 | 0.4141 |
| P2 Validation | -9.095e-13 | -7.903e-14 | 0 |
Availability — 3812 of 3812 positions complete
volumetric_soil_moisture_layer_2
Metadata
| Field | Value |
|---|---|
| units | 1 |
| long_name | Volumetric soil moisture |
| short_name | vsw |
| standard_name | volume_fraction_of_condensed_water_in_soil |
| step_type | instant |
| comment | ECMWF soil level 2, the second soil layer from the surface. Applies over land only; over water the values are near zero, so mask with land_sea_mask_surface. |
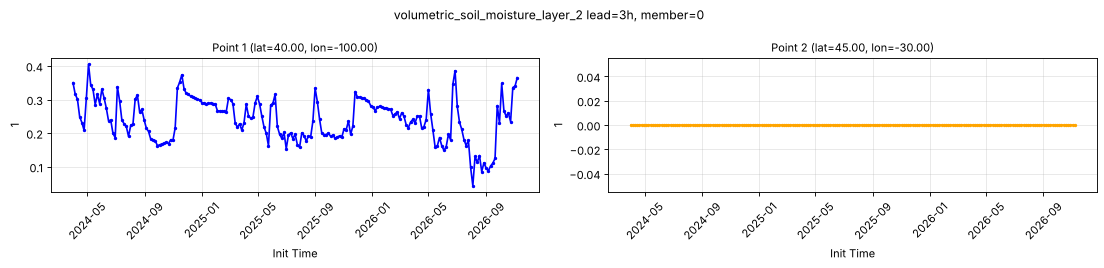
Point time series — 2024-04-01T00:00 - 2026-11-09T18:00, sampled lead=3h, member=0
| Point | min | mean | max |
|---|---|---|---|
| P1 | 0.04346 | 0.2402 | 0.405 |
| P2 | 0 | 0 | 0 |
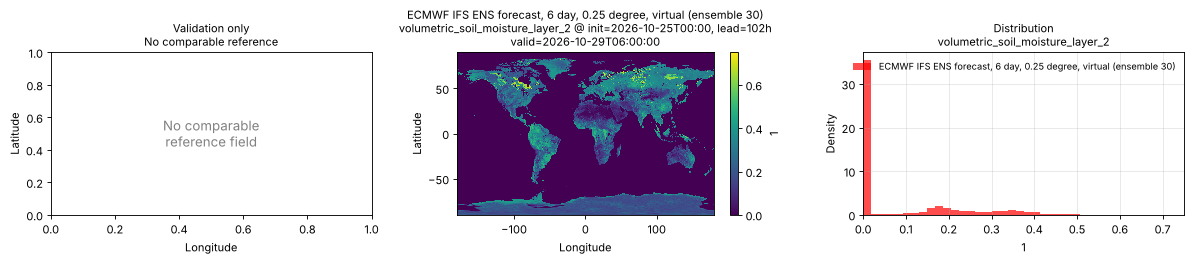
Spatial — init=2026-10-25T00:00, lead=102h, valid=2026-10-29T06:00:00, member=30 (reference not available)
| Source | min | mean | max |
|---|---|---|---|
| Validation | 0 | 0.08545 | 0.75 |
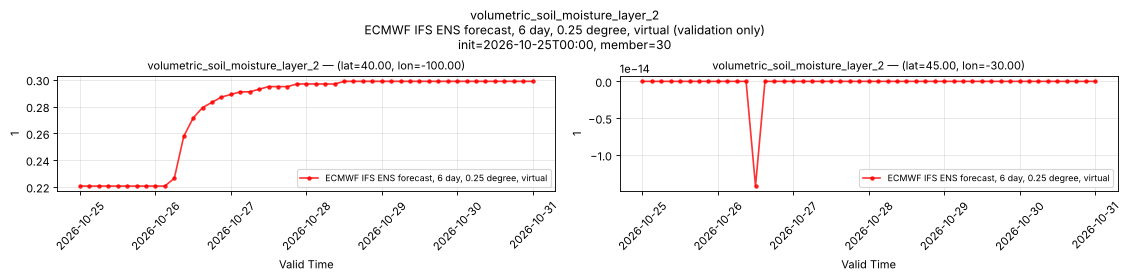
Temporal — init=2026-10-25T00:00, member=30
| Source | min | mean | max |
|---|---|---|---|
| P1 Validation | 0.2207 | 0.278 | 0.2988 |
| P2 Validation | -1.421e-14 | -2.9e-16 | 0 |
Availability — 3812 of 3812 positions complete
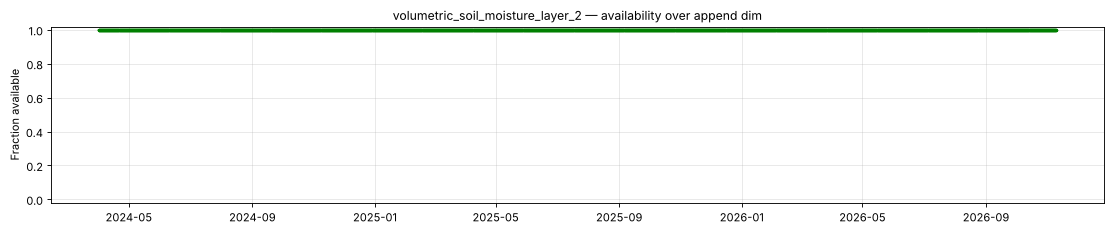
volumetric_soil_moisture_layer_3
Metadata
| Field | Value |
|---|---|
| units | 1 |
| long_name | Volumetric soil moisture |
| short_name | vsw |
| standard_name | volume_fraction_of_condensed_water_in_soil |
| step_type | instant |
| comment | ECMWF soil level 3. Applies over land only; over water the values are near zero, so mask with land_sea_mask_surface. |
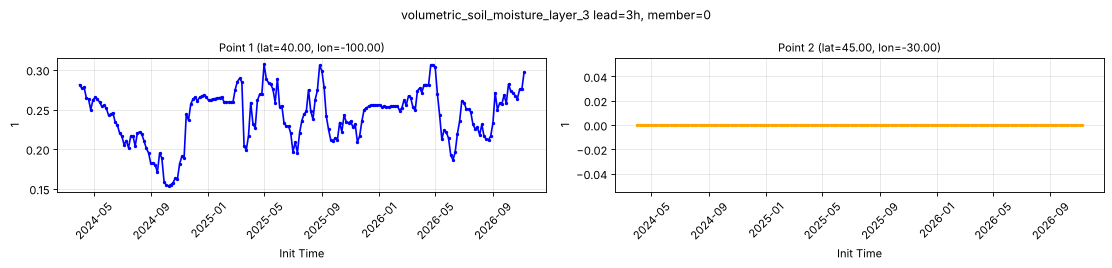
Point time series — 2024-04-01T00:00 - 2026-11-09T18:00, sampled lead=3h, member=0
| Point | min | mean | max |
|---|---|---|---|
| P1 | 0.1538 | 0.2423 | 0.3071 |
| P2 | 0 | 0 | 0 |
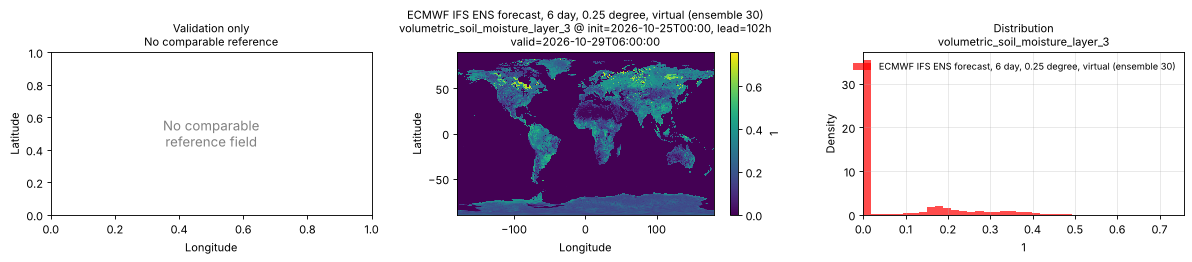
Spatial — init=2026-10-25T00:00, lead=102h, valid=2026-10-29T06:00:00, member=30 (reference not available)
| Source | min | mean | max |
|---|---|---|---|
| Validation | 0 | 0.08214 | 0.7578 |
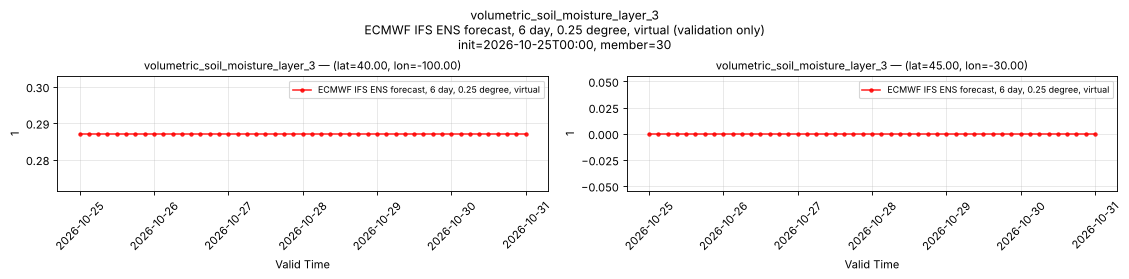
Temporal — init=2026-10-25T00:00, member=30
| Source | min | mean | max |
|---|---|---|---|
| P1 Validation | 0.2871 | 0.2871 | 0.2871 |
| P2 Validation | 0 | 0 | 0 |
Availability — 3812 of 3812 positions complete
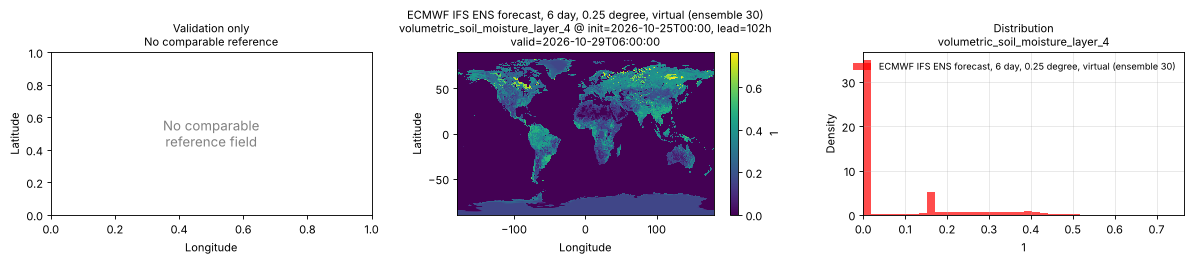
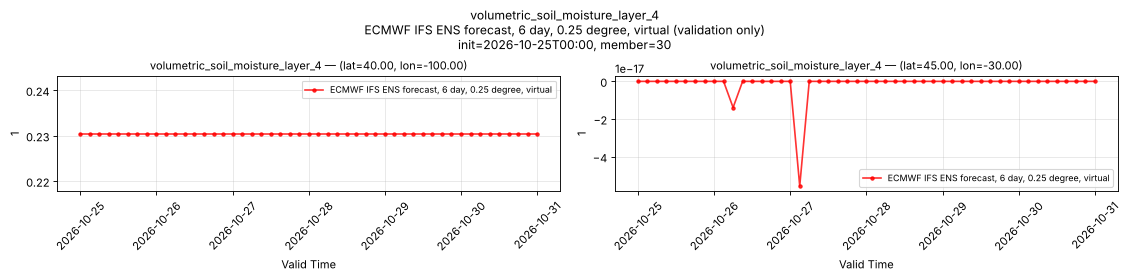
volumetric_soil_moisture_layer_4
Metadata
| Field | Value |
|---|---|
| units | 1 |
| long_name | Volumetric soil moisture |
| short_name | vsw |
| standard_name | volume_fraction_of_condensed_water_in_soil |
| step_type | instant |
| comment | ECMWF soil level 4. Applies over land only; over water the values are near zero, so mask with land_sea_mask_surface. |
Point time series — 2024-04-01T00:00 - 2026-11-09T18:00, sampled lead=3h, member=0
| Point | min | mean | max |
|---|---|---|---|
| P1 | 0.1968 | 0.2447 | 0.2786 |
| P2 | -5.551e-17 | -4.046e-19 | 0 |
Spatial — init=2026-10-25T00:00, lead=102h, valid=2026-10-29T06:00:00, member=30 (reference not available)
| Source | min | mean | max |
|---|---|---|---|
| Validation | -1.175e-38 | 0.08365 | 0.7656 |
Temporal — init=2026-10-25T00:00, member=30
| Source | min | mean | max |
|---|---|---|---|
| P1 Validation | 0.2305 | 0.2305 | 0.2305 |
| P2 Validation | -5.551e-17 | -1.416e-18 | 0 |
Availability — 3812 of 3812 positions complete
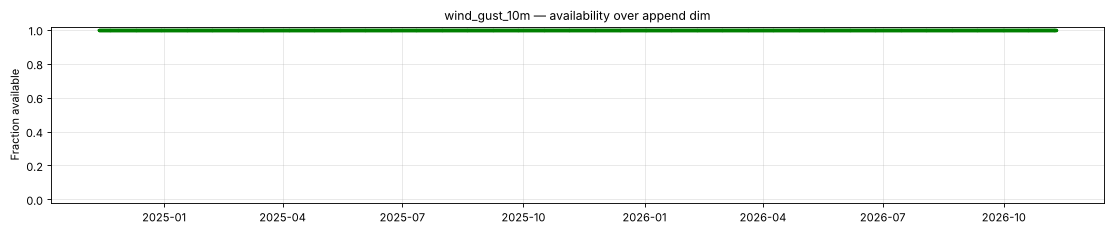
wind_gust_10m
Metadata
| Field | Value |
|---|---|
| units | m s-1 |
| long_name | Maximum 10 metre wind gust since previous post-processing |
| short_name | 10fg |
| standard_name | wind_speed_of_gust |
| step_type | max |
| comment | Maximum over the preceding hour through lead 90 hours, then since the preceding forecast step. Not available at lead time 0. |
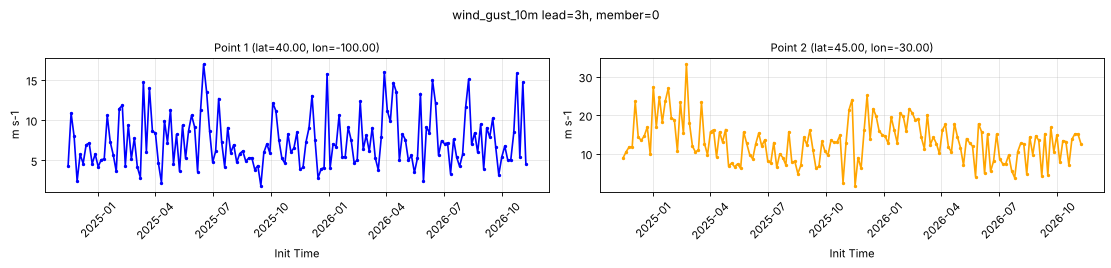
Point time series — 2024-04-01T00:00 - 2026-11-09T18:00, sampled lead=3h, member=0
| Point | min | mean | max |
|---|---|---|---|
| P1 | 1.862 | 7.417 | 16.95 |
| P2 | 1.709 | 13.17 | 33.24 |
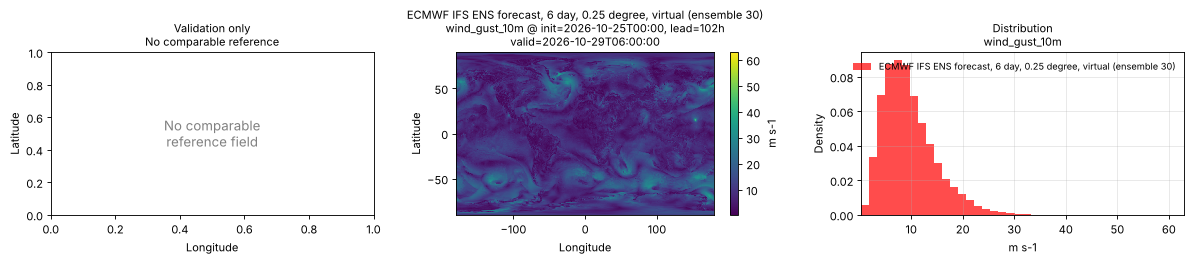
Spatial — init=2026-10-25T00:00, lead=102h, valid=2026-10-29T06:00:00, member=30 (reference not available)
| Source | min | mean | max |
|---|---|---|---|
| Validation | 0.3098 | 9.649 | 62.93 |
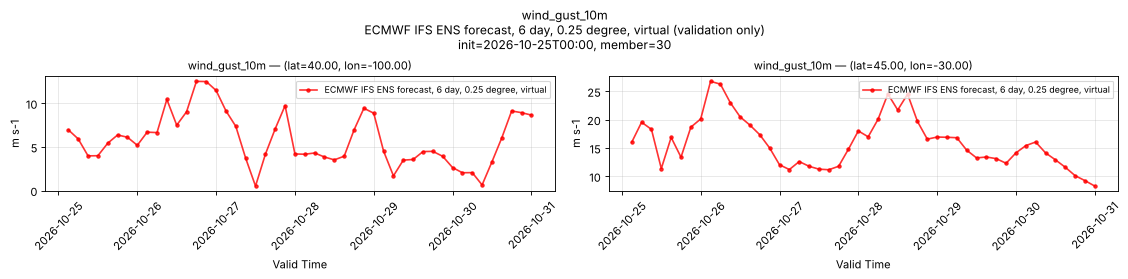
Temporal — init=2026-10-25T00:00, member=30
| Source | min | mean | max |
|---|---|---|---|
| P1 Validation | 0.5132 | 5.858 | 12.52 |
| P2 Validation | 8.278 | 16.04 | 26.76 |
Availability — 2911 of 3812 positions complete (incomplete 2024-04-01T00:00 → 2024-11-12T00:00)
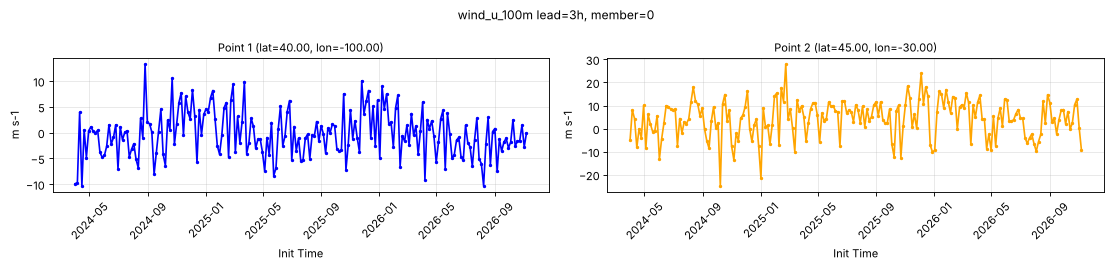
wind_u_100m
Metadata
| Field | Value |
|---|---|
| units | m s-1 |
| long_name | 100 metre U wind component |
| short_name | 100u |
| standard_name | eastward_wind |
| step_type | instant |
Point time series — 2024-04-01T00:00 - 2026-11-09T18:00, sampled lead=3h, member=0
| Point | min | mean | max |
|---|---|---|---|
| P1 | -10.3 | -0.2815 | 13.25 |
| P2 | -24.81 | 4.245 | 27.89 |
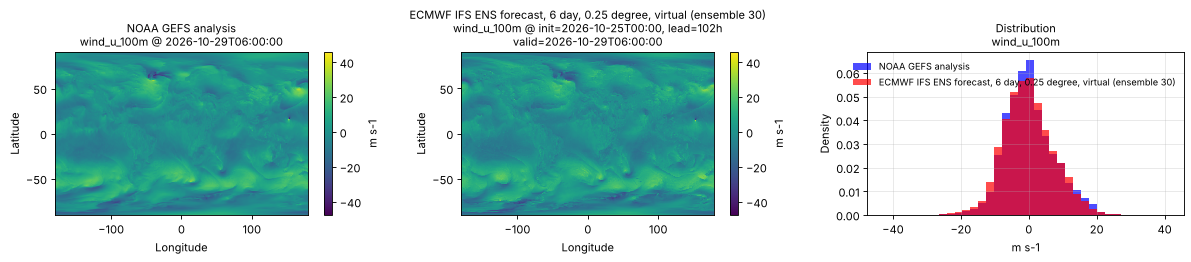
Spatial — init=2026-10-25T00:00, lead=102h, valid=2026-10-29T06:00:00, member=30 (reference at 2026-10-29T06:00:00)
| Source | min | mean | max |
|---|---|---|---|
| Validation | -40.11 | -0.06958 | 45.7 |
| Reference | -47.5 | 0.2473 | 37.5 |
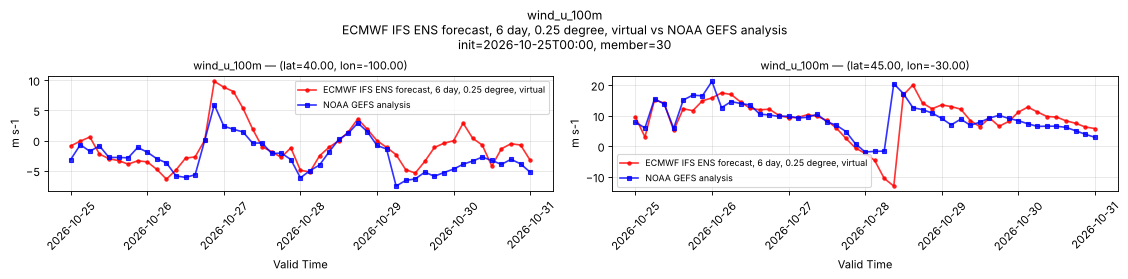
Temporal — init=2026-10-25T00:00, member=30
| Source | min | mean | max |
|---|---|---|---|
| P1 Validation | -6.415 | -0.98 | 9.815 |
| P1 Reference | -7.562 | -2.536 | 5.938 |
| P2 Validation | -13.04 | 9.086 | 20.06 |
| P2 Reference | -1.875 | 9.254 | 21.25 |
Availability — 3812 of 3812 positions complete
wind_u_10m
Metadata
| Field | Value |
|---|---|
| units | m s-1 |
| long_name | 10 metre U wind component |
| short_name | 10u |
| standard_name | eastward_wind |
| step_type | instant |
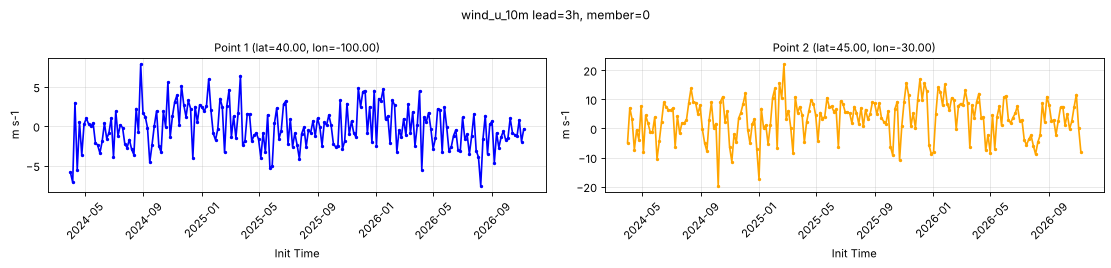
Point time series — 2024-04-01T00:00 - 2026-11-09T18:00, sampled lead=3h, member=0
| Point | min | mean | max |
|---|---|---|---|
| P1 | -7.574 | -0.243 | 7.851 |
| P2 | -19.72 | 3.331 | 22.02 |
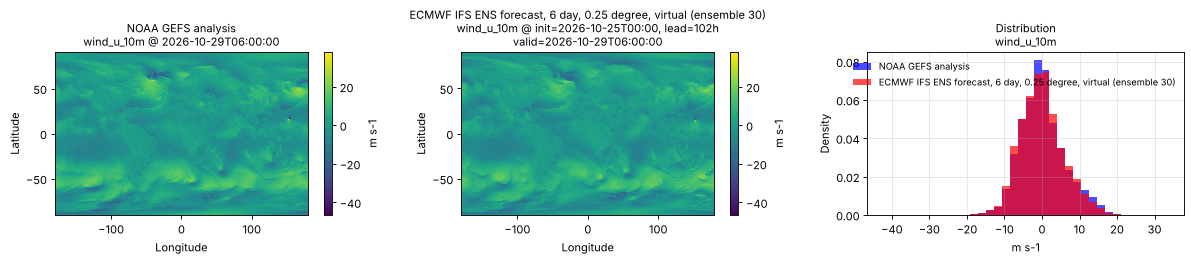
Spatial — init=2026-10-25T00:00, lead=102h, valid=2026-10-29T06:00:00, member=30 (reference at 2026-10-29T06:00:00)
| Source | min | mean | max |
|---|---|---|---|
| Validation | -32.91 | -0.02807 | 37.84 |
| Reference | -46.5 | 0.164 | 37 |
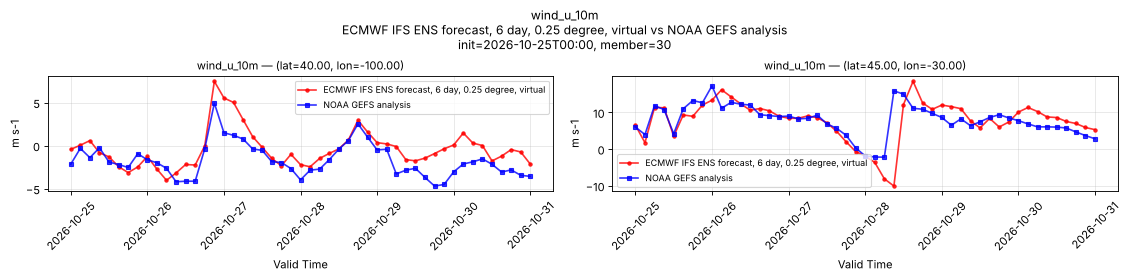
Temporal — init=2026-10-25T00:00, member=30
| Source | min | mean | max |
|---|---|---|---|
| P1 Validation | -4.017 | -0.4233 | 7.463 |
| P1 Reference | -4.688 | -1.699 | 4.938 |
| P2 Validation | -10.09 | 7.847 | 18.47 |
| P2 Reference | -2.219 | 7.912 | 17.25 |
Availability — 3812 of 3812 positions complete
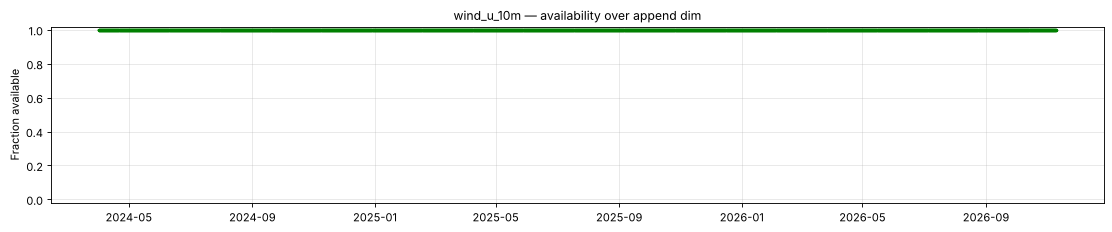
wind_v_100m
Metadata
| Field | Value |
|---|---|
| units | m s-1 |
| long_name | 100 metre V wind component |
| short_name | 100v |
| standard_name | northward_wind |
| step_type | instant |
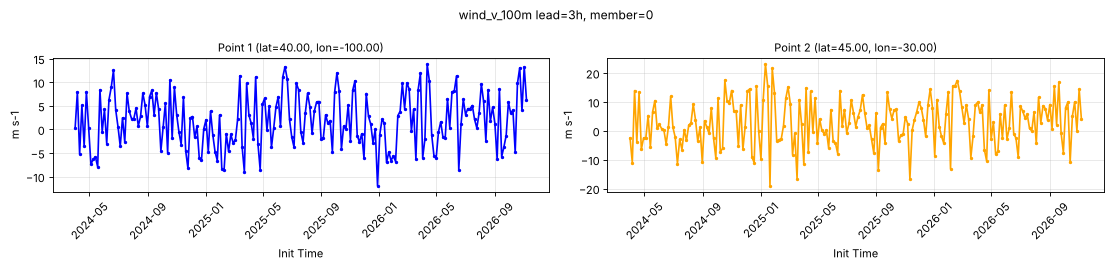
Point time series — 2024-04-01T00:00 - 2026-11-09T18:00, sampled lead=3h, member=0
| Point | min | mean | max |
|---|---|---|---|
| P1 | -11.94 | 1.796 | 13.81 |
| P2 | -19.04 | 2.782 | 23.04 |
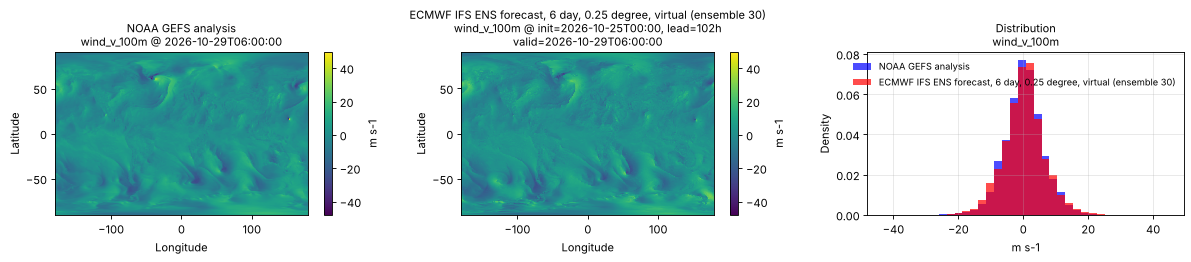
Spatial — init=2026-10-25T00:00, lead=102h, valid=2026-10-29T06:00:00, member=30 (reference at 2026-10-29T06:00:00)
| Source | min | mean | max |
|---|---|---|---|
| Validation | -43.23 | 0.2445 | 45.58 |
| Reference | -48 | 0.246 | 49.5 |
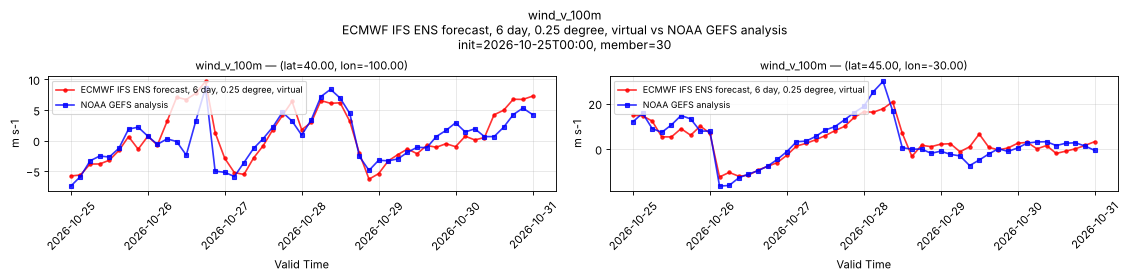
Temporal — init=2026-10-25T00:00, member=30
| Source | min | mean | max |
|---|---|---|---|
| P1 Validation | -6.309 | 0.764 | 9.679 |
| P1 Reference | -7.438 | 0.3267 | 8.625 |
| P2 Validation | -12.27 | 3.219 | 20.78 |
| P2 Reference | -16.25 | 3.358 | 29.75 |
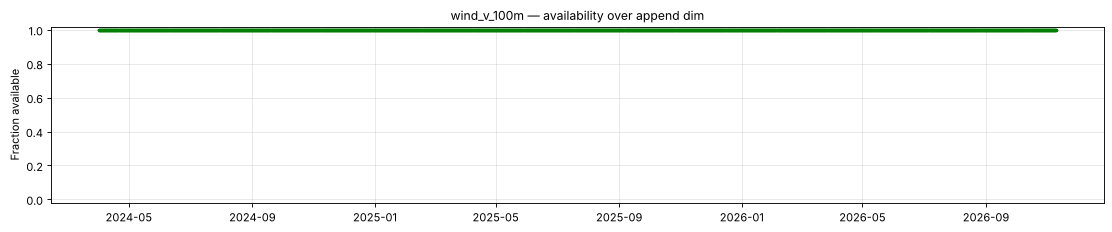
Availability — 3812 of 3812 positions complete
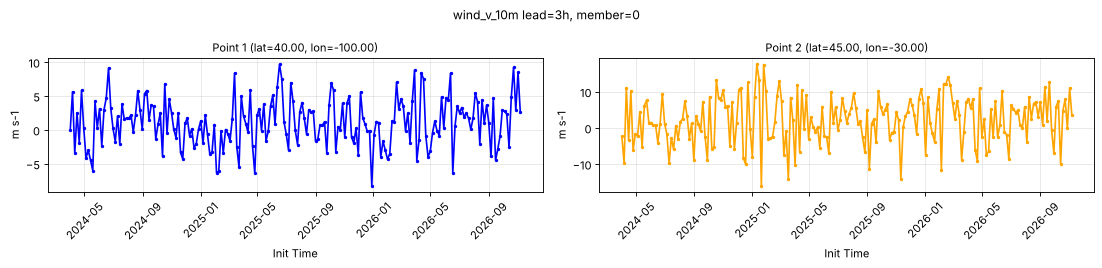
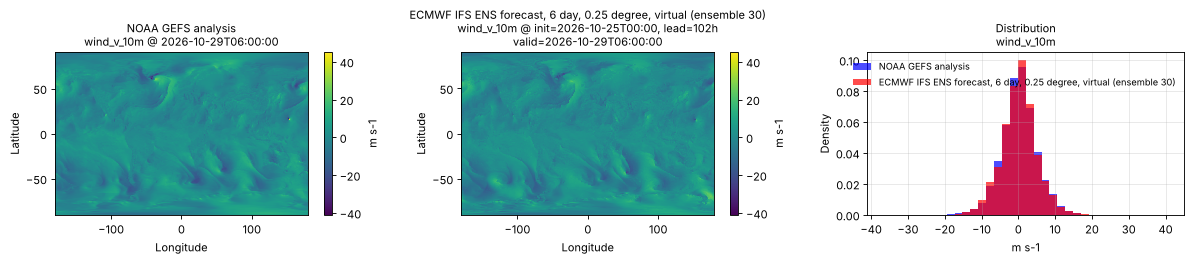
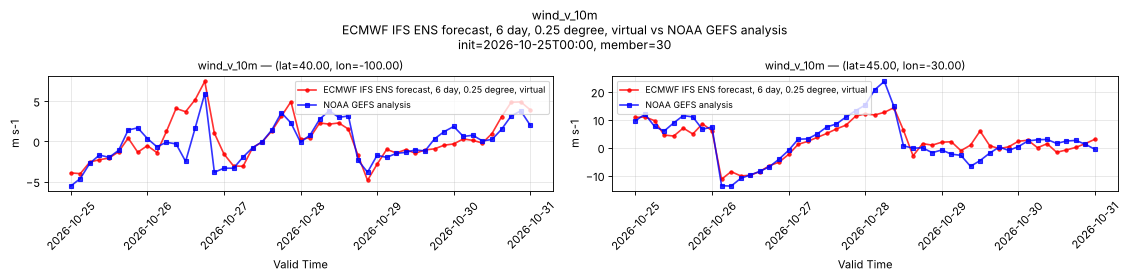
wind_v_10m
Metadata
| Field | Value |
|---|---|
| units | m s-1 |
| long_name | 10 metre V wind component |
| short_name | 10v |
| standard_name | northward_wind |
| step_type | instant |
Point time series — 2024-04-01T00:00 - 2026-11-09T18:00, sampled lead=3h, member=0
| Point | min | mean | max |
|---|---|---|---|
| P1 | -8.245 | 1.091 | 9.684 |
| P2 | -15.99 | 2.084 | 17.57 |
Spatial — init=2026-10-25T00:00, lead=102h, valid=2026-10-29T06:00:00, member=30 (reference at 2026-10-29T06:00:00)
| Source | min | mean | max |
|---|---|---|---|
| Validation | -34.19 | 0.213 | 37.49 |
| Reference | -41 | 0.2344 | 45 |
Temporal — init=2026-10-25T00:00, member=30
| Source | min | mean | max |
|---|---|---|---|
| P1 Validation | -4.845 | 0.2834 | 7.451 |
| P1 Reference | -5.562 | -0.05506 | 5.938 |
| P2 Validation | -11.31 | 2.411 | 14.32 |
| P2 Reference | -13.75 | 2.699 | 23.75 |
Availability — 3812 of 3812 positions complete