ECMWF AIFS ENS forecast validation report
This dataset validation report plots a sample of values from the ECMWF AIFS ENS forecast dataset over time and across space, comparing where possible to a previously validated reference dataset. It also reports the quantity of unavailable values and their associated timestamps. These analyses are one layer of a multi-layered dataset validation process we perform at dynamical.org and also provide users a preview of the dataset contents.
Report generation start time: 2026-05-22T15:13:42 UTC
Summary
This dataset has been validated and is ready for use. We found no data integrity issues — every sampled point and time range is populated, values fall within physically plausible ranges, and spatial fields look correct. One observation about high-latitude temperature_2m is worth flagging when working with the data; it is described in the Review notes below.
What looks good
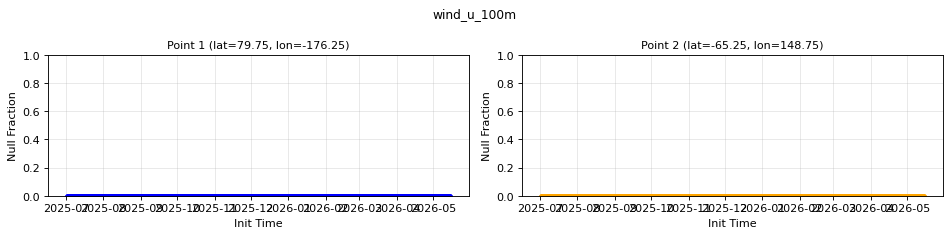
- No missing values at either sampled point across all 17 variables and the full validated time range (2025-07-02 → 2026-05-22).
- All spatial maps are oriented correctly, with continents in the expected places and values on the -180° to +180° longitude convention.
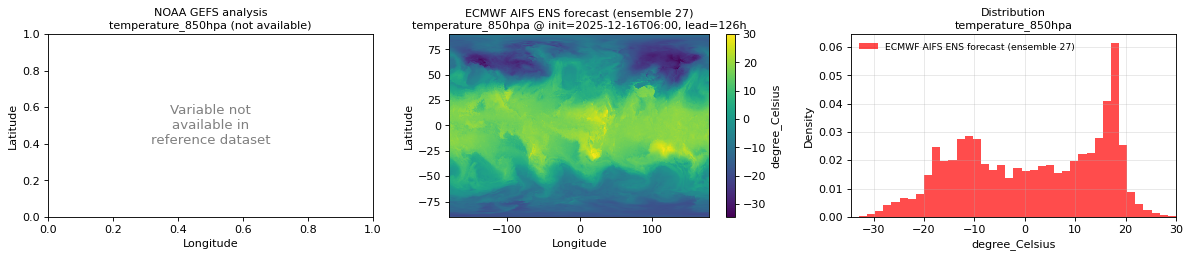
- For every variable also present in the NOAA GEFS analysis reference, the AIFS value distribution overlaps the reference distribution and falls within physically plausible ranges.
- Radiation variables show the expected diurnal cycle in phase with the reference.
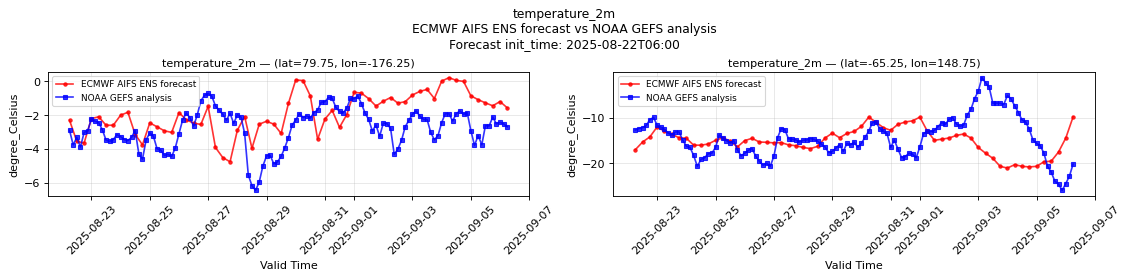
- Time series at mid-latitude sample points track the reference closely at early lead times and drift gradually thereafter, as expected for a forecast compared against an analysis.
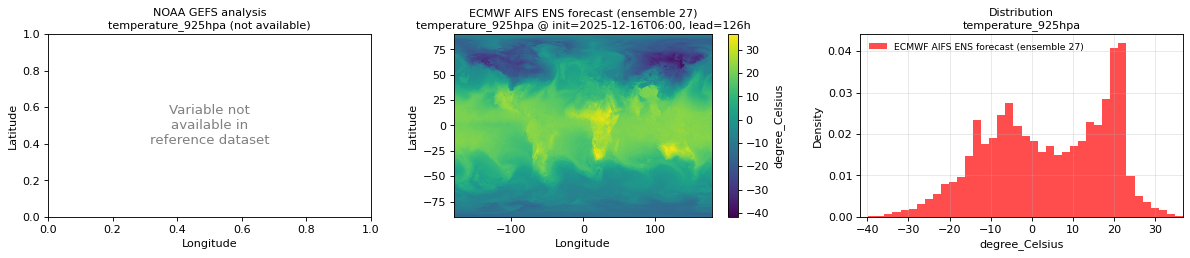
- Variables not present in the reference (
dew_point_temperature_2m,geopotential_height_850hpa,geopotential_height_925hpa,temperature_850hpa,temperature_925hpa) look smooth and physically reasonable in the AIFS-only plots.
Review notes
The following is a behavioral difference to be aware of when using the dataset, not a data integrity issue.
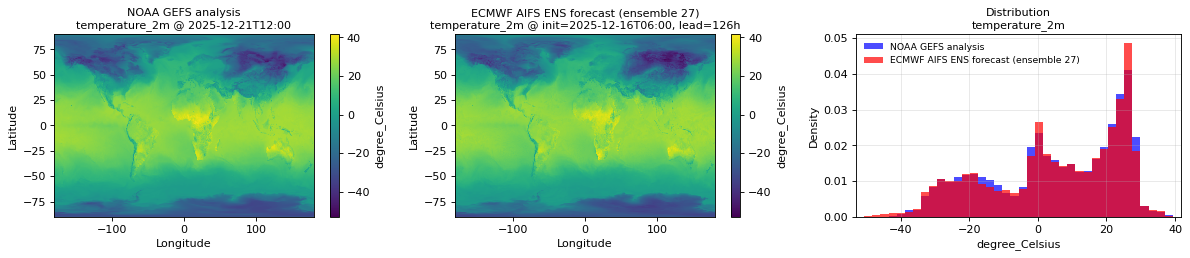
temperature_2mat high latitudes (|lat| ≥ ~67°) tends to run colder in this AIFS forecast than in the NOAA GEFS analysis, typically by 5–15 °C, with the gap growing as the lead time lengthens. We confirmed the pattern across four additional samples drawn at different ensemble members and initialization times: every Arctic and Antarctic sample point we drew showed AIFS colder than GEFS, including a ~25 °C difference near the North Pole at a 14-day lead. This is the kind of forecast-versus-analysis divergence we'd expect at long lead times in sparsely-observed polar regions and not a defect in the dataset itself.
Datasets
| Role | Name | ID | Version | URL |
|---|---|---|---|---|
| Validation | ECMWF AIFS ENS forecast | ecmwf-aifs-ens-forecast |
v0.1.0 |
s3://dynamical-ecmwf-aifs-ens/ecmwf-aifs-ens-forecast/v0.1.0.icechunk |
| Reference | NOAA GEFS analysis | noaa-gefs-analysis |
0.1.2 |
https://data.dynamical.org/noaa/gefs/analysis/latest.zarr |
Run parameters
| Parameter | Value |
|---|---|
| Validation dataset type | forecast |
| Validation time range | init_time 2025-07-02T00:00 → 2026-05-22T06:00 |
| Reference time range | time 2000-01-01T00:00 → 2026-05-22T06:00 |
| Time scope | full dataset |
| Point 1 | lat=66.7500, lon=-156.2500 |
| Point 2 | lat=-79.7500, lon=104.2500 |
| Ensemble member | 7 |
| Spatial comparison time | init=2026-05-20T06:00, lead=18h (reference at 2026-05-21T00:00) |
| Timeseries period | Forecast init_time: 2026-05-01T18:00 |
Combined plots
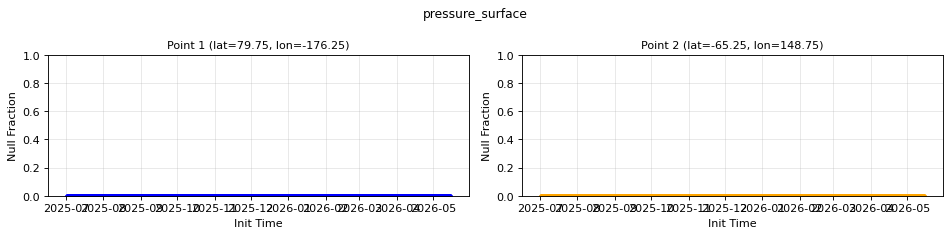
- Unavailable values:
combined_nulls.png - Spatial and distributions:
combined_spatial.png - Time series:
combined_temporal.png
Unavailable timestamps
None detected at the two sampled points.
Per-variable details
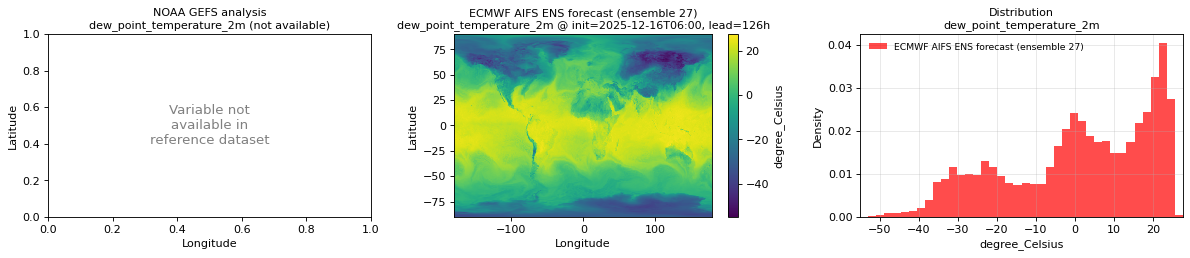
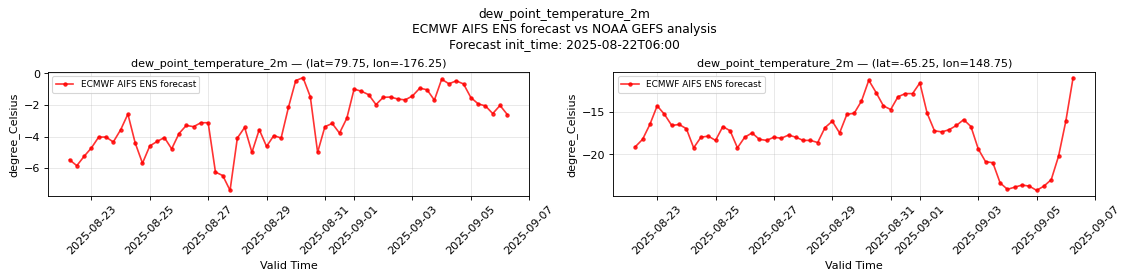
dew_point_temperature_2m
Metadata
| Field | Value |
|---|---|
| units | degree_Celsius |
| long_name | 2 metre dewpoint temperature |
| short_name | 2d |
| standard_name | dew_point_temperature |
| step_type | instant |
Spatial — snapshot at init=2026-05-20T06:00, lead=18h (reference not available)
| Source | min | mean | max |
|---|---|---|---|
| Validation | -74 | 1.98 | 30.12 |
Temporal — period Forecast init_time: 2026-05-01T18:00
| Source | min | mean | max |
|---|---|---|---|
| P1 Validation | -10 | -3.371 | 1.898 |
| P2 Validation | -69.5 | -59.15 | -50.25 |
Nulls — P1: 0/4038078 (none); P2: 0/4038078 (none)

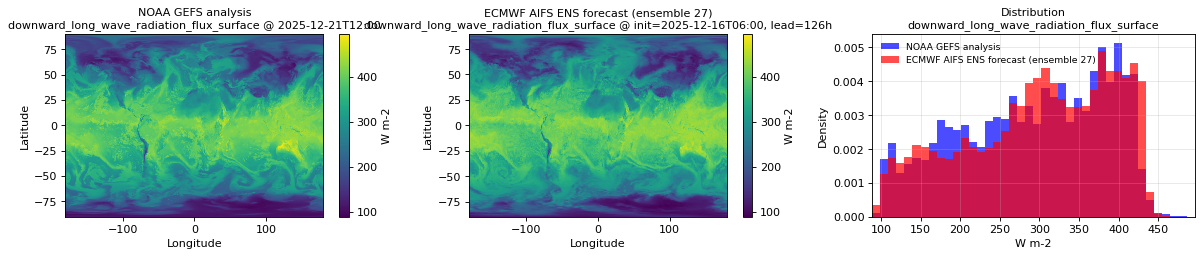
downward_long_wave_radiation_flux_surface
Metadata
| Field | Value |
|---|---|
| units | W m-2 |
| long_name | Surface downward long-wave radiation flux |
| short_name | sdlwrf |
| standard_name | surface_downwelling_longwave_flux_in_air |
| step_type | avg |
Spatial — snapshot at init=2026-05-20T06:00, lead=18h (reference at 2026-05-21T00:00)
| Source | min | mean | max |
|---|---|---|---|
| Validation | 61.5 | 309.6 | 464 |
| Reference | 64 | 301.4 | 474 |
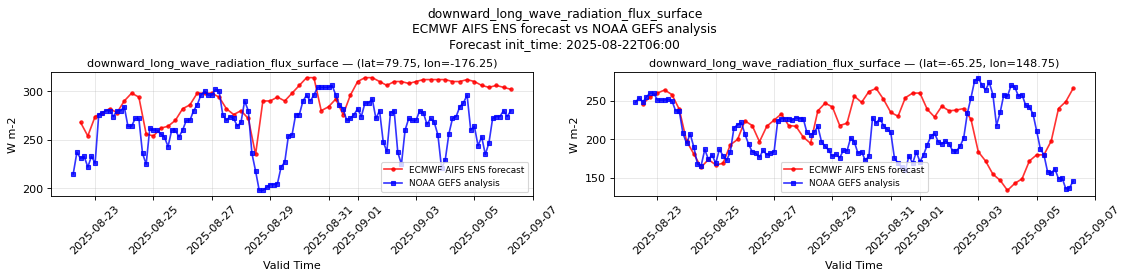
Temporal — period Forecast init_time: 2026-05-01T18:00
| Source | min | mean | max |
|---|---|---|---|
| P1 Validation | 203 | 262.6 | 316 |
| P1 Reference | 200 | 258.2 | 324 |
| P2 Validation | 62 | 95.94 | 140 |
| P2 Reference | 67 | 91.93 | 142 |
Nulls — P1: 0/3971880 (none); P2: 0/3971880 (none)

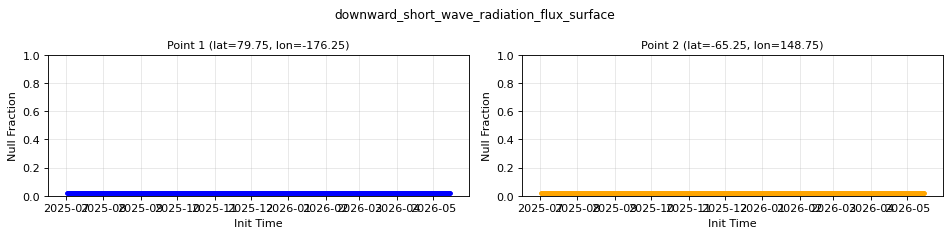
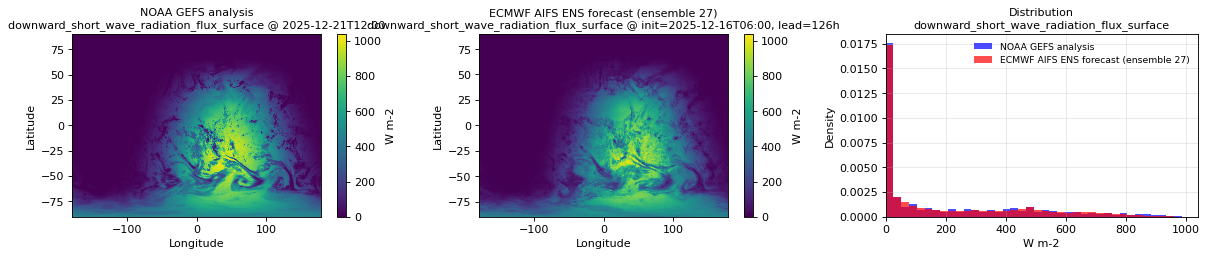
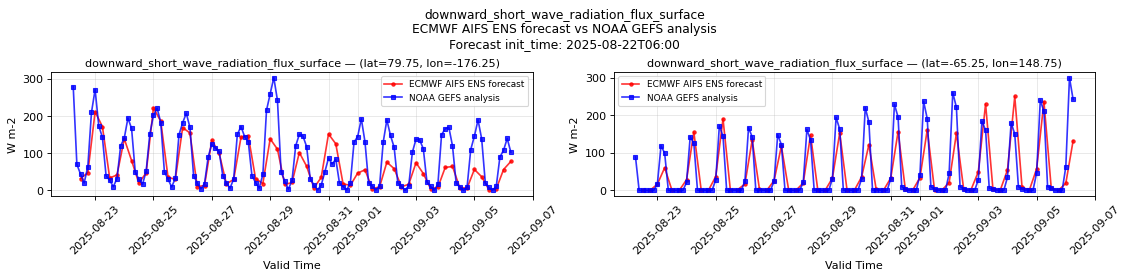
downward_short_wave_radiation_flux_surface
Metadata
| Field | Value |
|---|---|
| units | W m-2 |
| long_name | Surface downward short-wave radiation flux |
| short_name | sdswrf |
| standard_name | surface_downwelling_shortwave_flux_in_air |
| step_type | avg |
Spatial — snapshot at init=2026-05-20T06:00, lead=18h (reference at 2026-05-21T00:00)
| Source | min | mean | max |
|---|---|---|---|
| Validation | 0 | 164.8 | 964 |
| Reference | 0 | 179.7 | 952 |
Temporal — period Forecast init_time: 2026-05-01T18:00
| Source | min | mean | max |
|---|---|---|---|
| P1 Validation | 0.4512 | 206.5 | 632 |
| P1 Reference | 0 | 216.4 | 632 |
| P2 Validation | 0 | 0.4785 | 5.812 |
| P2 Reference | 0 | 0 | 0 |
Nulls — P1: 0/3971880 (none); P2: 0/3971880 (none)
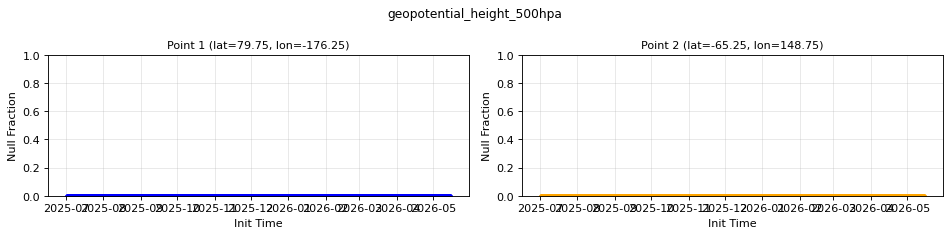
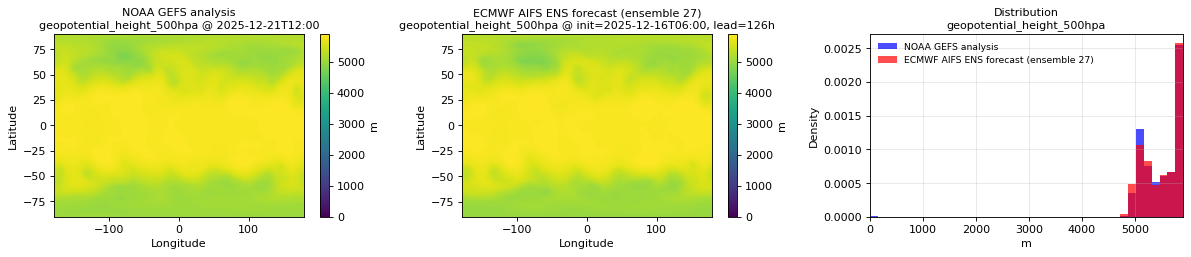
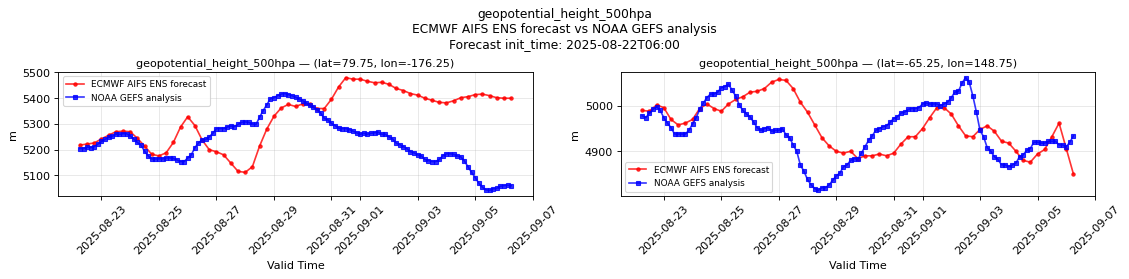
geopotential_height_500hpa
Metadata
| Field | Value |
|---|---|
| units | m |
| long_name | Geopotential height |
| short_name | gh |
| standard_name | geopotential_height |
| step_type | instant |
Spatial — snapshot at init=2026-05-20T06:00, lead=18h (reference at 2026-05-21T00:00)
| Source | min | mean | max |
|---|---|---|---|
| Validation | 4700 | 5541 | 5940 |
| Reference | 0 | 5534 | 5938 |
Temporal — period Forecast init_time: 2026-05-01T18:00
| Source | min | mean | max |
|---|---|---|---|
| P1 Validation | 5242 | 5360 | 5450 |
| P1 Reference | 5252 | 5357 | 5478 |
| P2 Validation | 4734 | 4965 | 5196 |
| P2 Reference | 4908 | 5012 | 5086 |
Nulls — P1: 0/4038078 (none); P2: 0/4038078 (none)
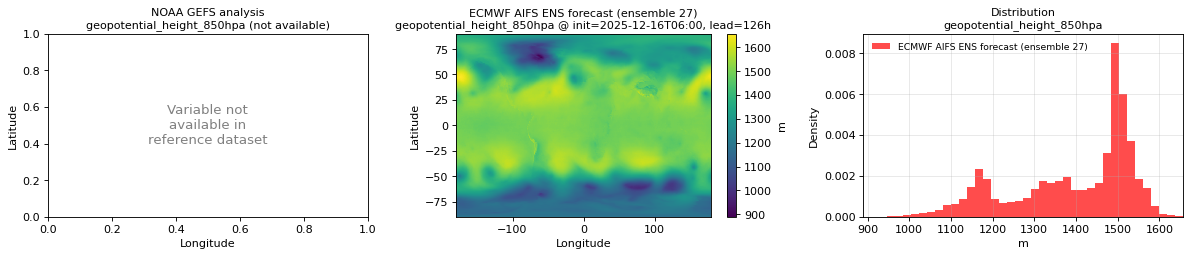
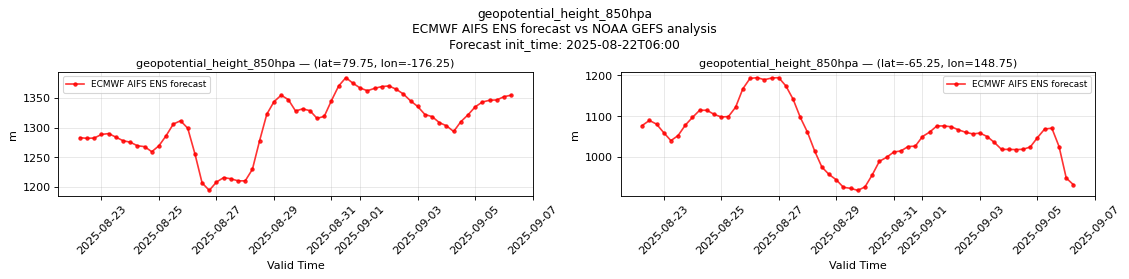
geopotential_height_850hpa
Metadata
| Field | Value |
|---|---|
| units | m |
| long_name | Geopotential height |
| short_name | gh |
| standard_name | geopotential_height |
| step_type | instant |
Spatial — snapshot at init=2026-05-20T06:00, lead=18h (reference not available)
| Source | min | mean | max |
|---|---|---|---|
| Validation | 858.5 | 1406 | 1639 |
Temporal — period Forecast init_time: 2026-05-01T18:00
| Source | min | mean | max |
|---|---|---|---|
| P1 Validation | 1224 | 1387 | 1508 |
| P2 Validation | 1016 | 1238 | 1422 |
Nulls — P1: 0/4038078 (none); P2: 0/4038078 (none)

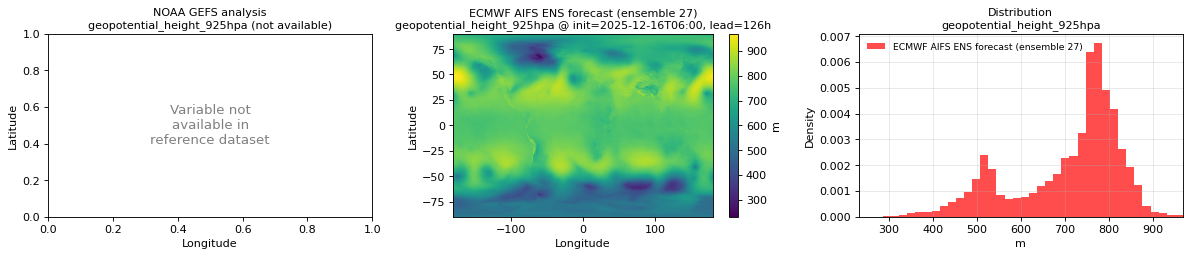
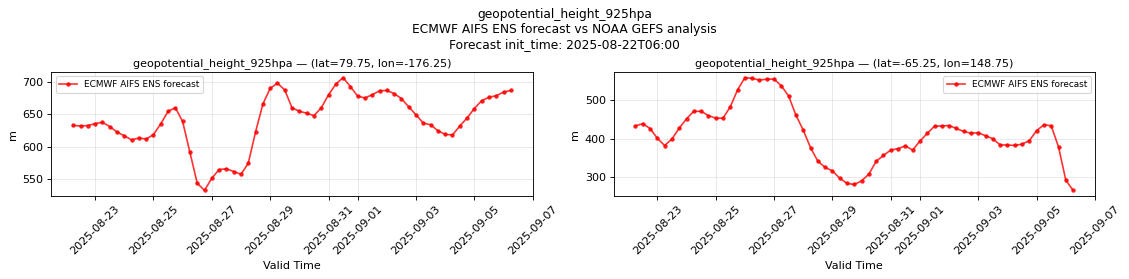
geopotential_height_925hpa
Metadata
| Field | Value |
|---|---|
| units | m |
| long_name | Geopotential height |
| short_name | gh |
| standard_name | geopotential_height |
| step_type | instant |
Spatial — snapshot at init=2026-05-20T06:00, lead=18h (reference not available)
| Source | min | mean | max |
|---|---|---|---|
| Validation | 198.9 | 716.1 | 935 |
Temporal — period Forecast init_time: 2026-05-01T18:00
| Source | min | mean | max |
|---|---|---|---|
| P1 Validation | 550 | 719.1 | 846 |
| P2 Validation | 380.8 | 604 | 786.2 |
Nulls — P1: 0/4038078 (none); P2: 0/4038078 (none)

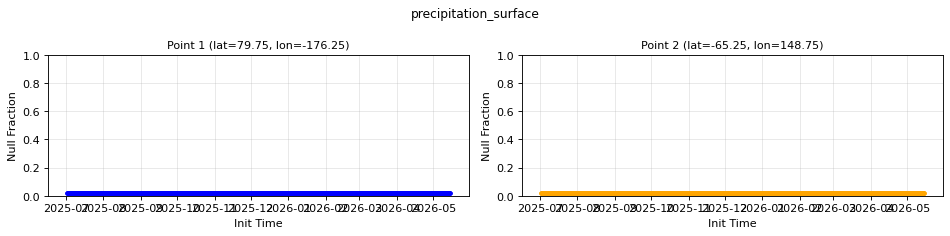
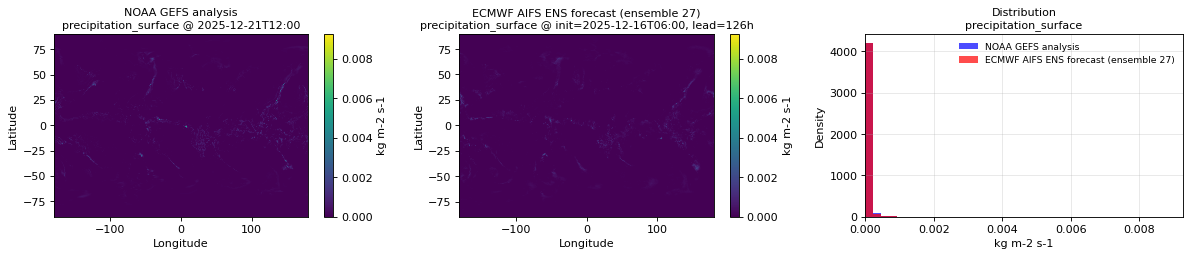
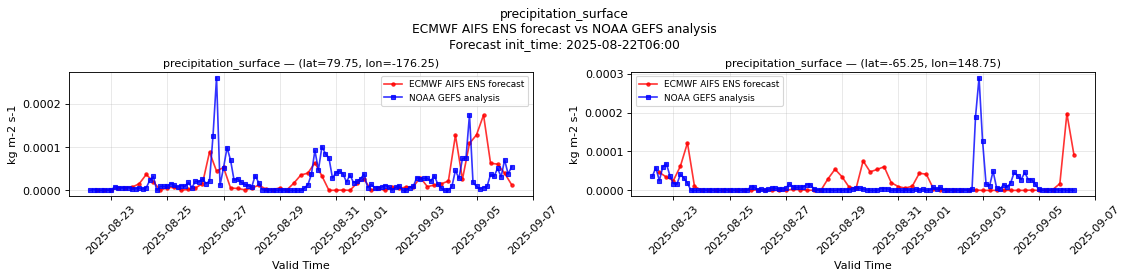
precipitation_surface
Metadata
| Field | Value |
|---|---|
| units | kg m-2 s-1 |
| long_name | Precipitation rate |
| short_name | prate |
| standard_name | precipitation_flux |
| step_type | avg |
Spatial — snapshot at init=2026-05-20T06:00, lead=18h (reference at 2026-05-21T00:00)
| Source | min | mean | max |
|---|---|---|---|
| Validation | 0 | 2.851e-05 | 0.004456 |
| Reference | 0 | 2.732e-05 | 0.005737 |
Temporal — period Forecast init_time: 2026-05-01T18:00
| Source | min | mean | max |
|---|---|---|---|
| P1 Validation | 0 | 1.035e-05 | 0.0001011 |
| P1 Reference | 0 | 1.244e-05 | 0.000145 |
| P2 Validation | 0 | 7.298e-07 | 1.395e-05 |
| P2 Reference | 0 | 7.802e-07 | 6.467e-06 |
Nulls — P1: 0/3971880 (none); P2: 0/3971880 (none)
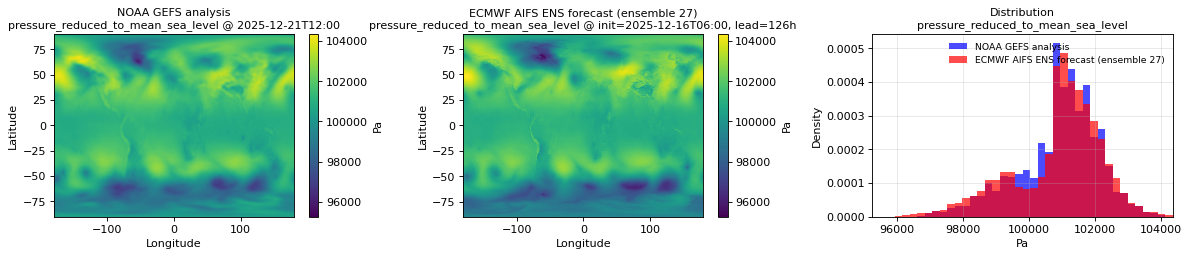
pressure_reduced_to_mean_sea_level
Metadata
| Field | Value |
|---|---|
| units | Pa |
| long_name | Pressure reduced to MSL |
| short_name | prmsl |
| standard_name | air_pressure_at_mean_sea_level |
| step_type | instant |
Spatial — snapshot at init=2026-05-20T06:00, lead=18h (reference at 2026-05-21T00:00)
| Source | min | mean | max |
|---|---|---|---|
| Validation | 9.469e+04 | 1.009e+05 | 1.034e+05 |
| Reference | 9.504e+04 | 1.01e+05 | 1.05e+05 |
Temporal — period Forecast init_time: 2026-05-01T18:00
| Source | min | mean | max |
|---|---|---|---|
| P1 Validation | 9.904e+04 | 1.012e+05 | 1.031e+05 |
| P1 Reference | 9.958e+04 | 1.01e+05 | 1.021e+05 |
| P2 Validation | 9.872e+04 | 1.016e+05 | 1.043e+05 |
| P2 Reference | 1.021e+05 | 1.036e+05 | 1.057e+05 |
Nulls — P1: 0/4038078 (none); P2: 0/4038078 (none)


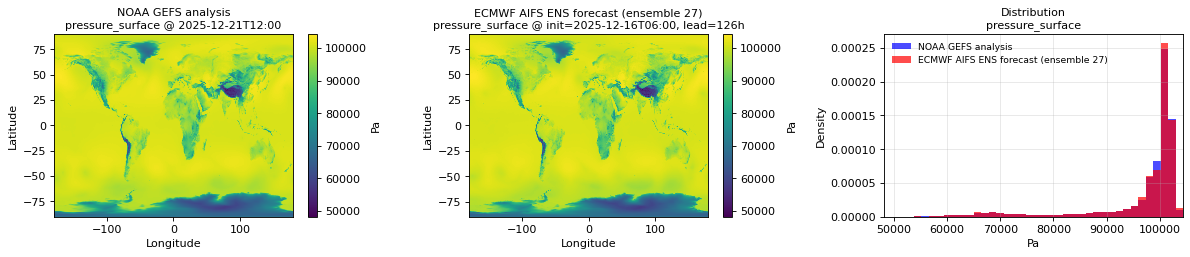
pressure_surface
Metadata
| Field | Value |
|---|---|
| units | Pa |
| long_name | Surface pressure |
| short_name | sp |
| standard_name | surface_air_pressure |
| step_type | instant |
Spatial — snapshot at init=2026-05-20T06:00, lead=18h (reference at 2026-05-21T00:00)
| Source | min | mean | max |
|---|---|---|---|
| Validation | 4.894e+04 | 9.662e+04 | 1.044e+05 |
| Reference | 5.04e+04 | 9.66e+04 | 1.034e+05 |
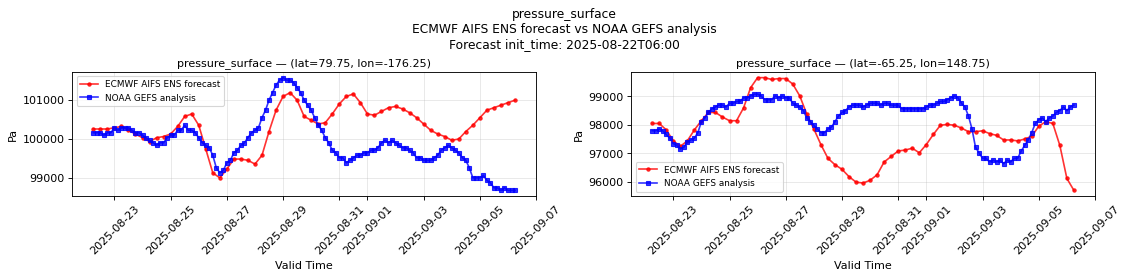
Temporal — period Forecast init_time: 2026-05-01T18:00
| Source | min | mean | max |
|---|---|---|---|
| P1 Validation | 9.648e+04 | 9.86e+04 | 1.004e+05 |
| P1 Reference | 9.619e+04 | 9.753e+04 | 9.85e+04 |
| P2 Validation | 6.019e+04 | 6.227e+04 | 6.382e+04 |
| P2 Reference | 6.189e+04 | 6.264e+04 | 6.323e+04 |
Nulls — P1: 0/4038078 (none); P2: 0/4038078 (none)
temperature_2m
Metadata
| Field | Value |
|---|---|
| units | degree_Celsius |
| long_name | 2 metre temperature |
| short_name | 2t |
| standard_name | air_temperature |
| step_type | instant |
Spatial — snapshot at init=2026-05-20T06:00, lead=18h (reference at 2026-05-21T00:00)
| Source | min | mean | max |
|---|---|---|---|
| Validation | -71 | 6.407 | 41 |
| Reference | -66 | 6.763 | 38 |
Temporal — period Forecast init_time: 2026-05-01T18:00
| Source | min | mean | max |
|---|---|---|---|
| P1 Validation | -9.125 | 1.055 | 8.875 |
| P1 Reference | -7.906 | 0.6305 | 13.19 |
| P2 Validation | -65.5 | -55.28 | -46.5 |
| P2 Reference | -55 | -48.9 | -41 |
Nulls — P1: 0/4038078 (none); P2: 0/4038078 (none)

temperature_850hpa
Metadata
| Field | Value |
|---|---|
| units | degree_Celsius |
| long_name | Temperature |
| short_name | t |
| standard_name | air_temperature |
| step_type | instant |
Spatial — snapshot at init=2026-05-20T06:00, lead=18h (reference not available)
| Source | min | mean | max |
|---|---|---|---|
| Validation | -44.75 | 2.459 | 33.75 |
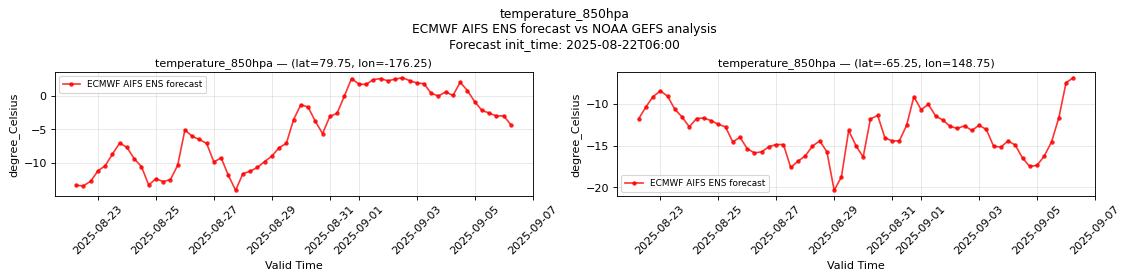
Temporal — period Forecast init_time: 2026-05-01T18:00
| Source | min | mean | max |
|---|---|---|---|
| P1 Validation | -9.438 | -5.499 | -1.992 |
| P2 Validation | -42.25 | -35.22 | -27.5 |
Nulls — P1: 0/4038078 (none); P2: 0/4038078 (none)

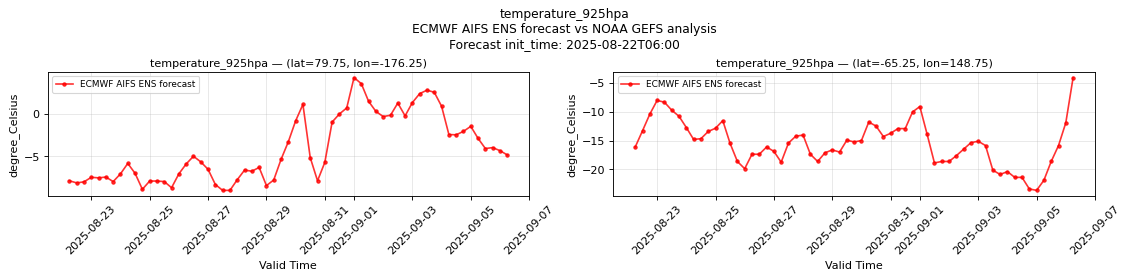
temperature_925hpa
Metadata
| Field | Value |
|---|---|
| units | degree_Celsius |
| long_name | Temperature |
| short_name | t |
| standard_name | air_temperature |
| step_type | instant |
Spatial — snapshot at init=2026-05-20T06:00, lead=18h (reference not available)
| Source | min | mean | max |
|---|---|---|---|
| Validation | -43 | 5.197 | 38.75 |
Temporal — period Forecast init_time: 2026-05-01T18:00
| Source | min | mean | max |
|---|---|---|---|
| P1 Validation | -9.75 | -1.747 | 3.438 |
| P2 Validation | -38.5 | -31.34 | -23.62 |
Nulls — P1: 0/4038078 (none); P2: 0/4038078 (none)

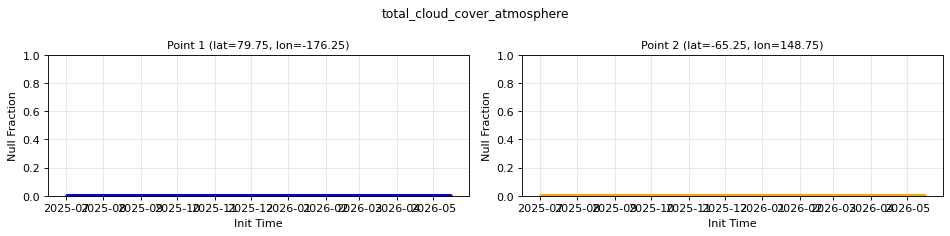
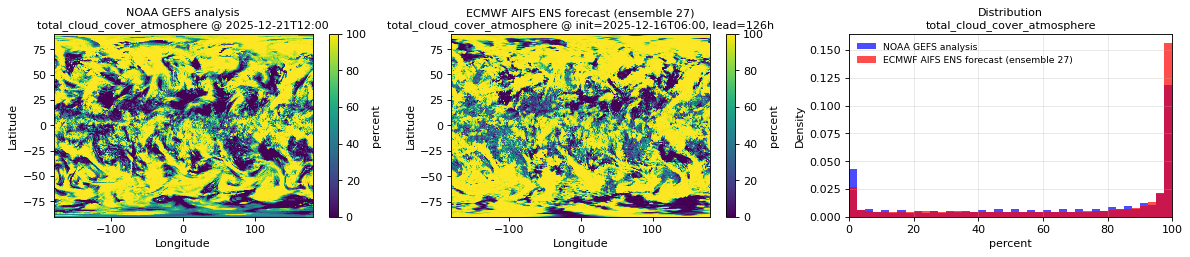
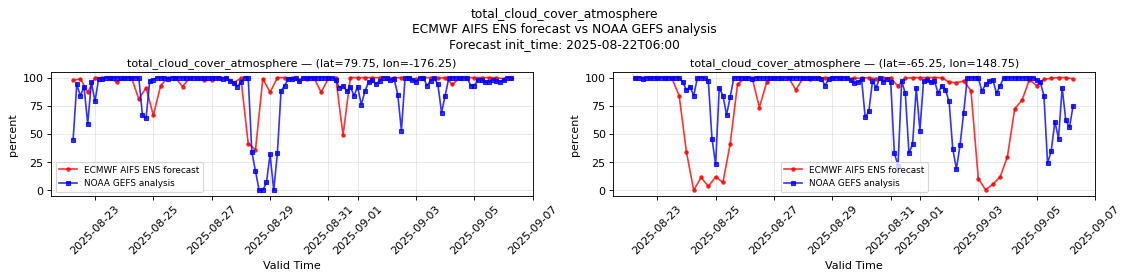
total_cloud_cover_atmosphere
Metadata
| Field | Value |
|---|---|
| units | percent |
| long_name | Total cloud cover |
| short_name | tcc |
| standard_name | cloud_area_fraction |
| step_type | instant |
Spatial — snapshot at init=2026-05-20T06:00, lead=18h (reference at 2026-05-21T00:00)
| Source | min | mean | max |
|---|---|---|---|
| Validation | 0 | 70.12 | 100 |
| Reference | 0 | 60.75 | 100 |
Temporal — period Forecast init_time: 2026-05-01T18:00
| Source | min | mean | max |
|---|---|---|---|
| P1 Validation | 0.1719 | 71.99 | 100 |
| P1 Reference | 0 | 63.78 | 100 |
| P2 Validation | 0 | 83.27 | 100 |
| P2 Reference | 5 | 77.36 | 100 |
Nulls — P1: 0/4038078 (none); P2: 0/4038078 (none)
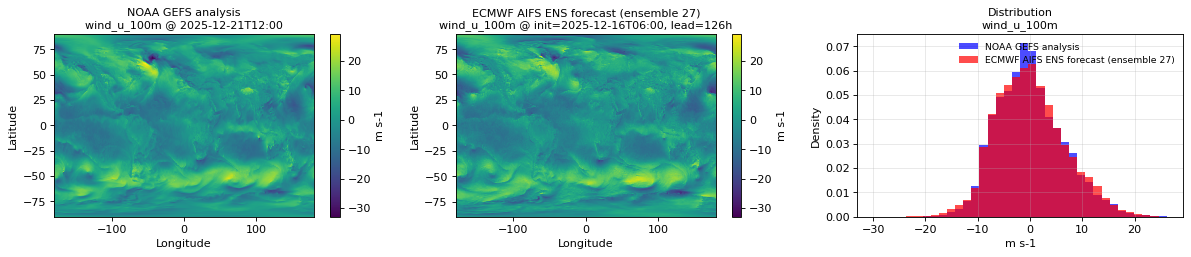
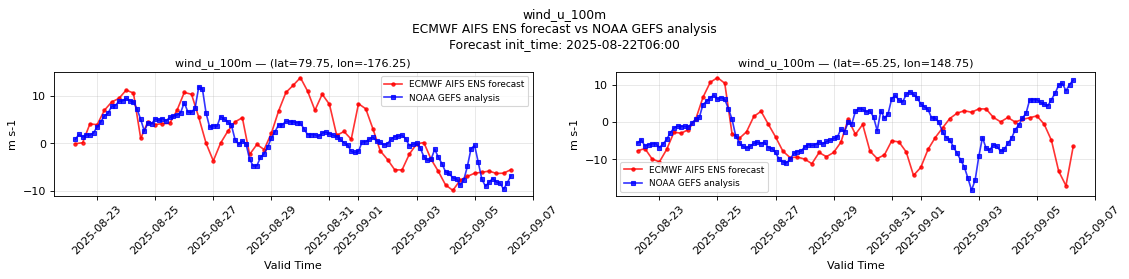
wind_u_100m
Metadata
| Field | Value |
|---|---|
| units | m s-1 |
| long_name | 100 metre U wind component |
| short_name | 100u |
| standard_name | eastward_wind |
| step_type | instant |
Spatial — snapshot at init=2026-05-20T06:00, lead=18h (reference at 2026-05-21T00:00)
| Source | min | mean | max |
|---|---|---|---|
| Validation | -31.75 | 0.1908 | 32 |
| Reference | -27 | 0.2757 | 33.5 |
Temporal — period Forecast init_time: 2026-05-01T18:00
| Source | min | mean | max |
|---|---|---|---|
| P1 Validation | -9.5 | -0.4336 | 7.125 |
| P1 Reference | -6.562 | -1.039 | 3.312 |
| P2 Validation | -7 | 3.642 | 16.5 |
| P2 Reference | -2.25 | 5.573 | 12.25 |
Nulls — P1: 0/4038078 (none); P2: 0/4038078 (none)
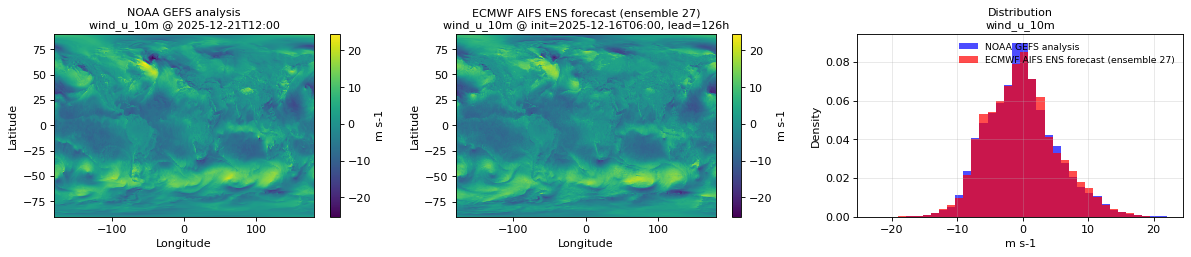
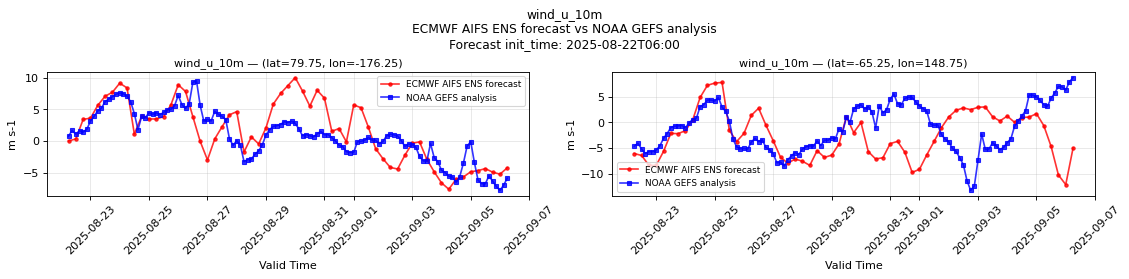
wind_u_10m
Metadata
| Field | Value |
|---|---|
| units | m s-1 |
| long_name | 10 metre U wind component |
| short_name | 10u |
| standard_name | eastward_wind |
| step_type | instant |
Spatial — snapshot at init=2026-05-20T06:00, lead=18h (reference at 2026-05-21T00:00)
| Source | min | mean | max |
|---|---|---|---|
| Validation | -23.25 | 0.1149 | 24.75 |
| Reference | -21.75 | 0.1729 | 26.5 |
Temporal — period Forecast init_time: 2026-05-01T18:00
| Source | min | mean | max |
|---|---|---|---|
| P1 Validation | -6.25 | -0.1983 | 4.5 |
| P1 Reference | -6.375 | -0.7253 | 4 |
| P2 Validation | -4.688 | 3.252 | 11 |
| P2 Reference | -0.2012 | 4.363 | 7.5 |
Nulls — P1: 0/4038078 (none); P2: 0/4038078 (none)

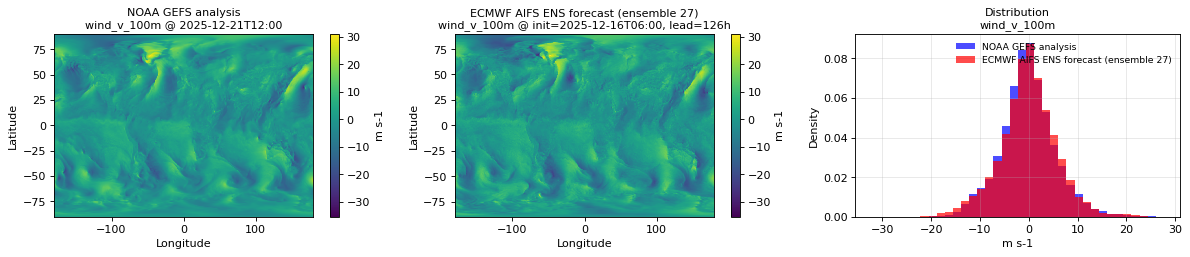
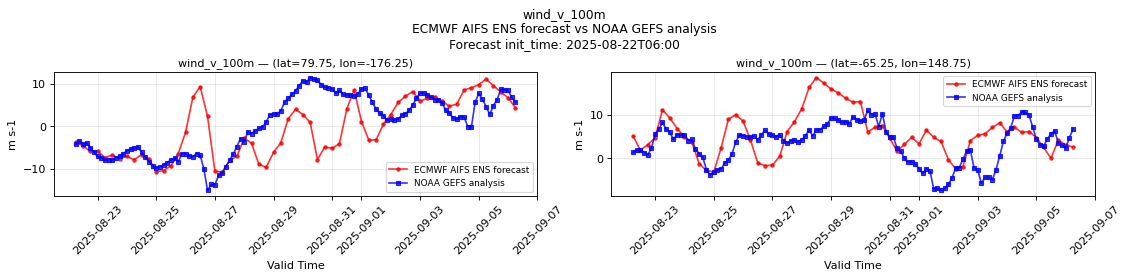
wind_v_100m
Metadata
| Field | Value |
|---|---|
| units | m s-1 |
| long_name | 100 metre V wind component |
| short_name | 100v |
| standard_name | northward_wind |
| step_type | instant |
Spatial — snapshot at init=2026-05-20T06:00, lead=18h (reference at 2026-05-21T00:00)
| Source | min | mean | max |
|---|---|---|---|
| Validation | -27.75 | 0.381 | 27.75 |
| Reference | -24.25 | 0.3761 | 25.75 |
Temporal — period Forecast init_time: 2026-05-01T18:00
| Source | min | mean | max |
|---|---|---|---|
| P1 Validation | -3.125 | 0.2967 | 5.25 |
| P1 Reference | -4.375 | -0.6616 | 4.625 |
| P2 Validation | -6.688 | 6.769 | 16.75 |
| P2 Reference | -4 | 7.805 | 13.75 |
Nulls — P1: 0/4038078 (none); P2: 0/4038078 (none)

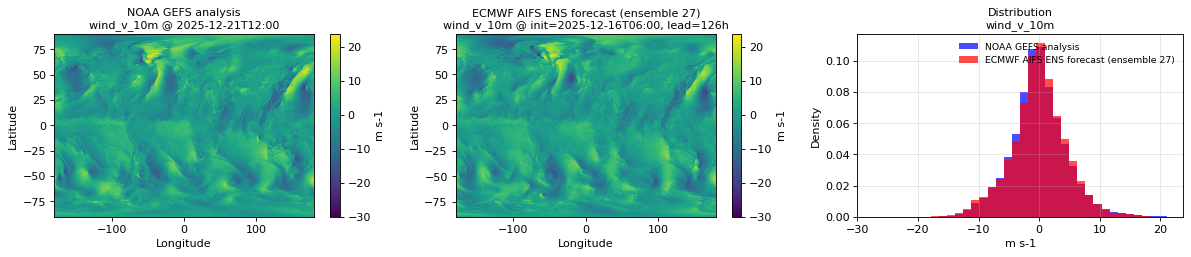
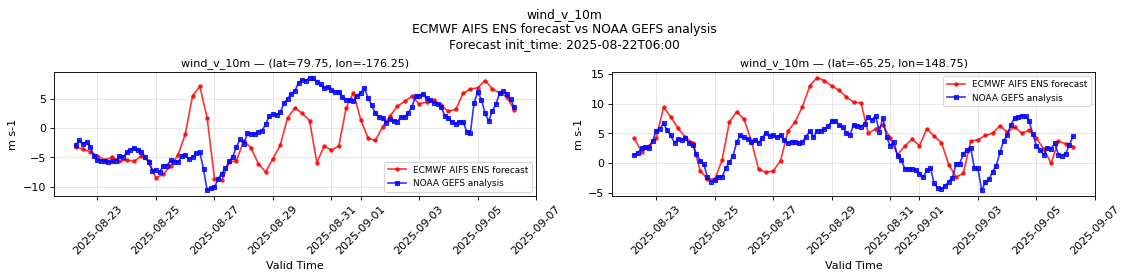
wind_v_10m
Metadata
| Field | Value |
|---|---|
| units | m s-1 |
| long_name | 10 metre V wind component |
| short_name | 10v |
| standard_name | northward_wind |
| step_type | instant |
Spatial — snapshot at init=2026-05-20T06:00, lead=18h (reference at 2026-05-21T00:00)
| Source | min | mean | max |
|---|---|---|---|
| Validation | -19.75 | 0.3433 | 21.25 |
| Reference | -19.75 | 0.2988 | 21.25 |
Temporal — period Forecast init_time: 2026-05-01T18:00
| Source | min | mean | max |
|---|---|---|---|
| P1 Validation | -1.391 | 0.2521 | 3.188 |
| P1 Reference | -2.531 | -0.4285 | 2.344 |
| P2 Validation | -3.312 | 4.294 | 11.25 |
| P2 Reference | -2.625 | 4.099 | 9.625 |
Nulls — P1: 0/4038078 (none); P2: 0/4038078 (none)