DWD ICON-EU forecast, 5 day, icosahedral validation report
This dataset validation report plots a sample of values from the DWD ICON-EU forecast, 5 day, icosahedral dataset over time and across space, comparing where possible to a previously validated reference dataset. It also reports the quantity of unavailable values and their associated timestamps. These analyses are one layer of a multi-layered dataset validation process we perform at dynamical.org and also provide users a preview of the dataset contents.
Report generation start time: 2026-11-18T04:48:55 UTC
Summary
This dataset has been reviewed and is ready for use.
What looks good
- Values match the regular latitude-longitude ICON-EU dataset from the same model runs. Each native cell agrees with the nearest point of dynamical.org's DWD ICON-EU forecast, 5 day dataset with correlations of 0.99 or higher for every variable except convective available potential energy (0.95). Domain means are equal to within 0.01% of each variable's spread, and the two datasets have missing values in the same places at the same times.
- The grid covers the full ICON-EU model domain in the correct place. Cell centers span 24.9°N to 71.6°N and 25.5°W to 64.0°E, a slightly larger area than the regular-grid product. The Alps, Scandinavia, Iberia and Iceland appear at their true locations.
- Units and signs agree with the NOAA GEFS analysis reference. This covers temperature and dew point in degrees Celsius, both pressure fields in pascals, the eastward and northward wind components, and the precipitation rate.
- All data is present. Each of the 19 variables is complete at all 168 forecast initialization times and at every forecast step. Precipitation rate and both shortwave radiation fluxes are averages over the preceding step, so they have no value at the initialization time itself.
- The fields are physically consistent with no shifts across the archive. Dew point stays below temperature, gusts exceed the wind speed, and radiation falls to zero overnight with the correct daily cycle.
Datasets
| Role | Name | ID | Version | URL |
|---|---|---|---|---|
| Validation | DWD ICON-EU forecast, 5 day, icosahedral | dwd-icon-eu-forecast-5-day-icosahedral |
v0.1.0 |
s3://dynamical-dwd-icon-eu/dwd-icon-eu-forecast-5-day-icosahedral/v0.1.0.icechunk |
| Reference | NOAA GEFS analysis | noaa-gefs-analysis |
0.1.2 |
s3://dynamical-noaa-gefs/noaa-gefs-analysis/v0.1.2.icechunk/ |
Run parameters
| Parameter | Value |
|---|---|
| Validation dataset type | forecast |
| Validation time range | init_time 2026-10-07T00:00 → 2026-11-17T18:00 |
| Reference time range | time 2000-01-01T00:00 → 2026-11-18T03:00 |
| Point 1 | lat=48.1612, lon=11.6050 |
| Point 2 | lat=40.3960, lon=-3.6793 |
| Spatial comparison time | init=2026-11-15T12:00, lead=9h (member, lead and reference time recorded per variable) |
| Timeseries period | init=2026-10-24T06:00 |
Availability
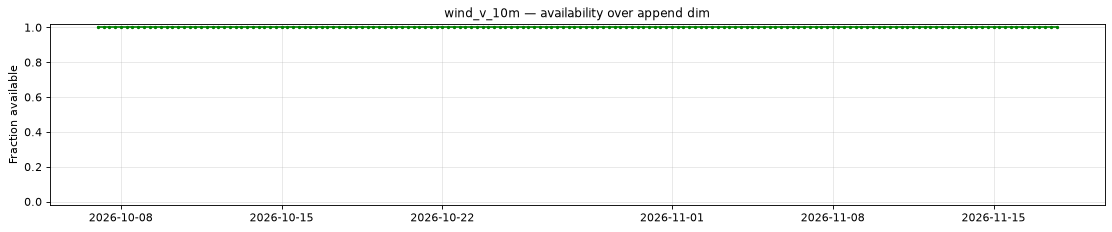
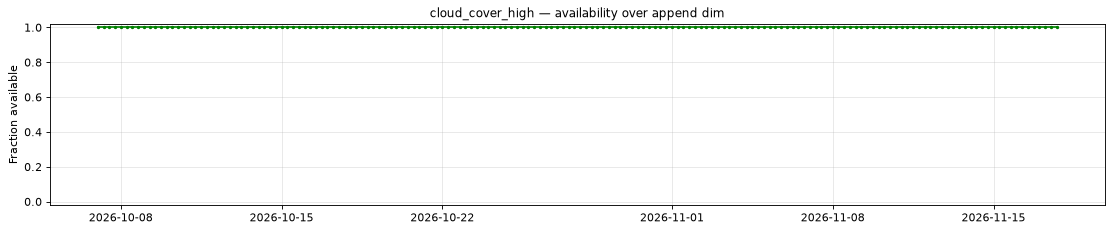
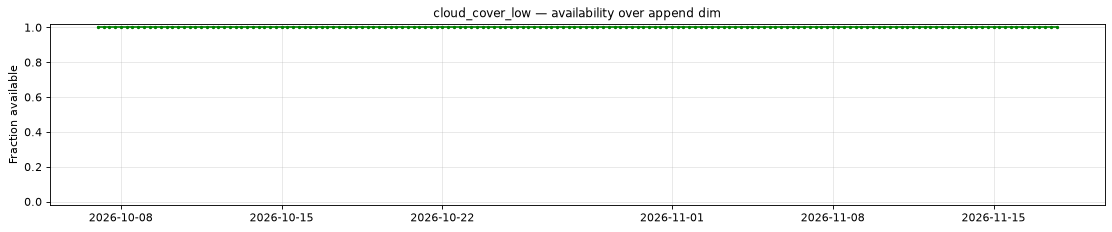
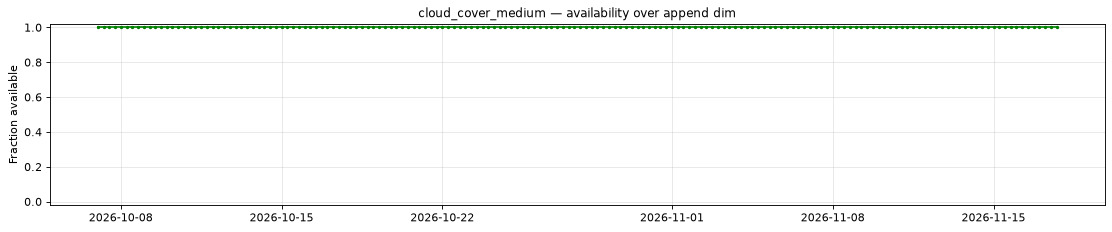
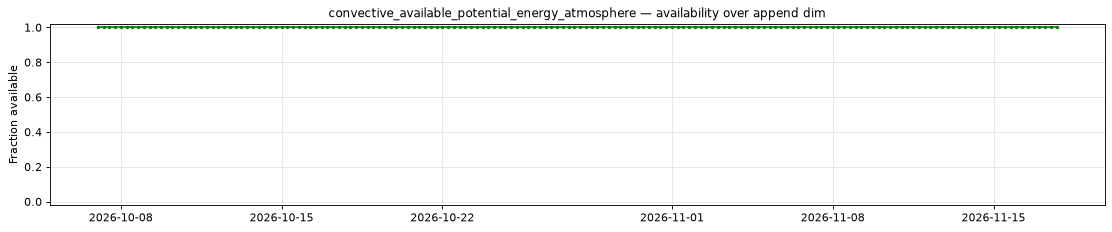
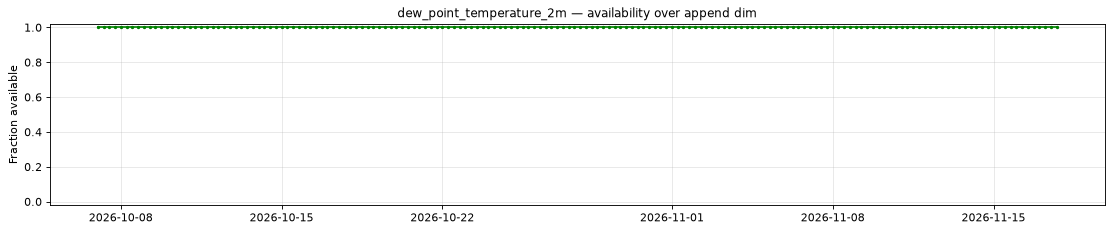
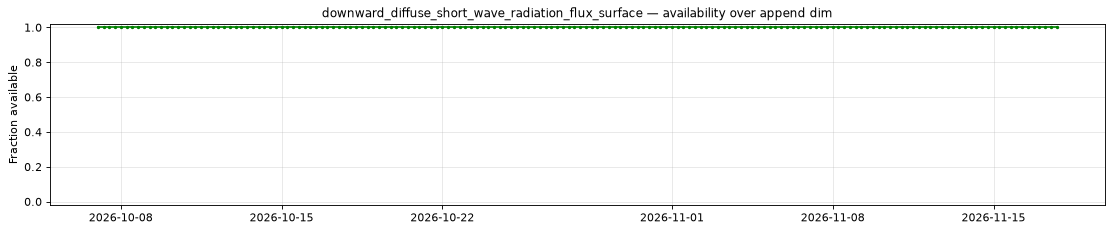
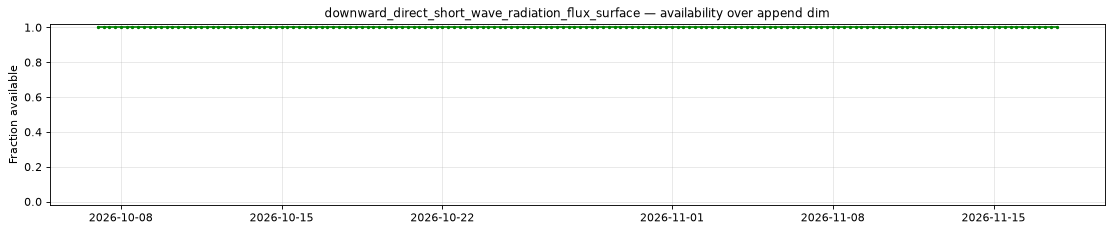
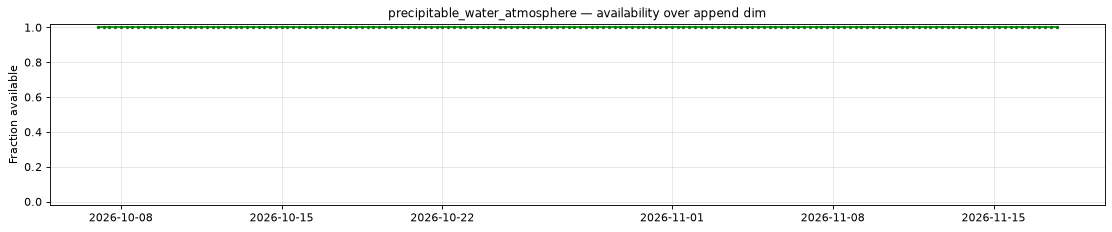
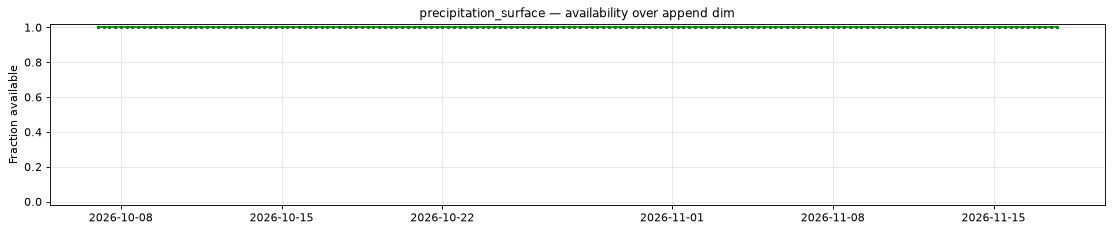
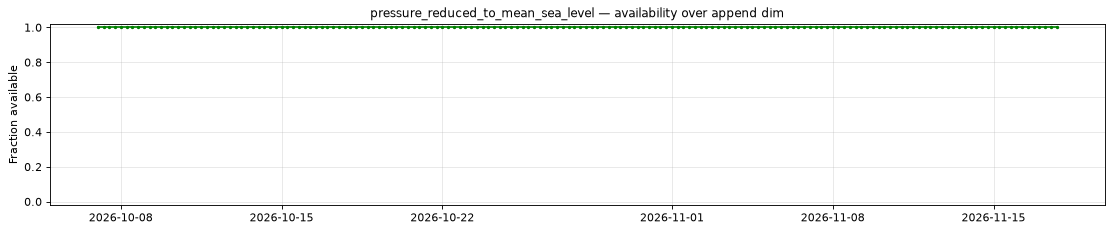
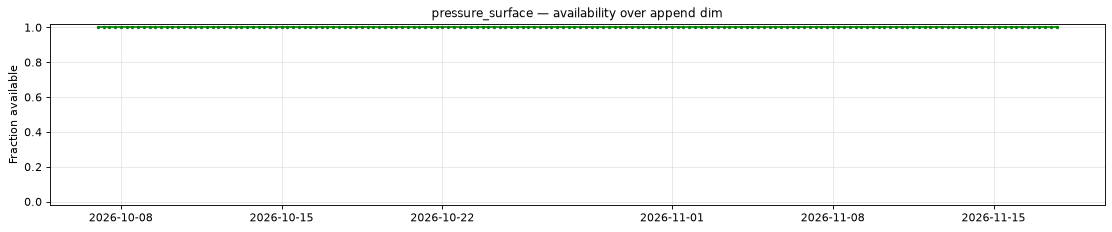
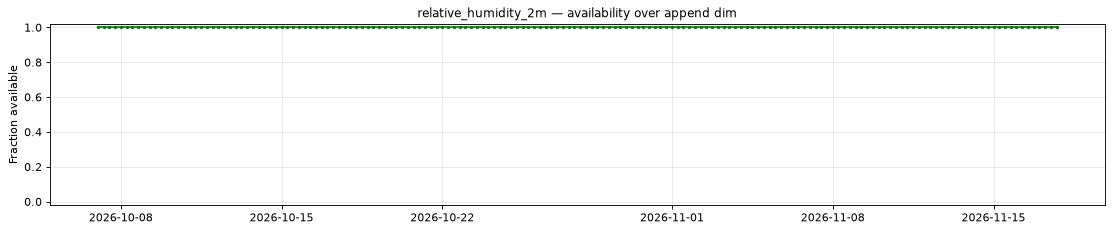
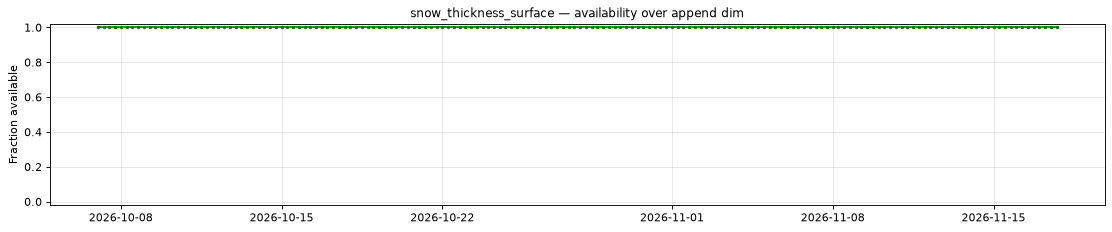
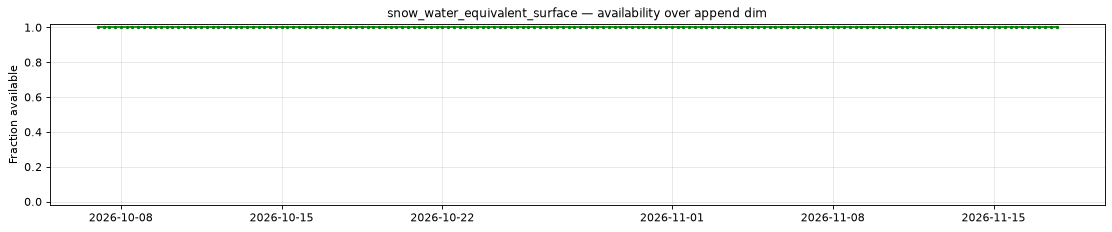
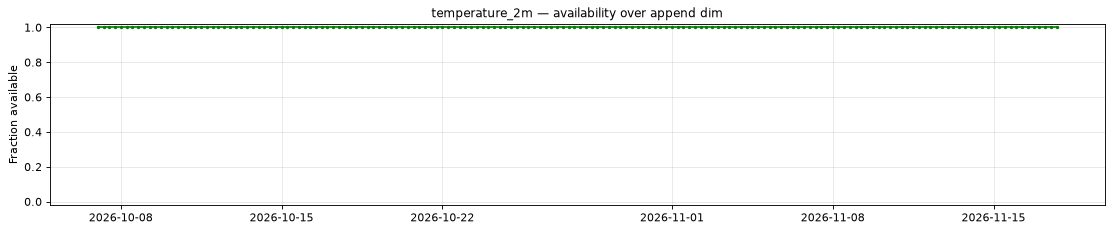
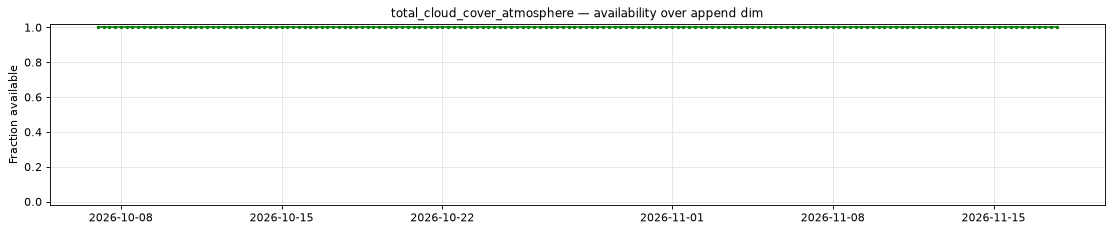
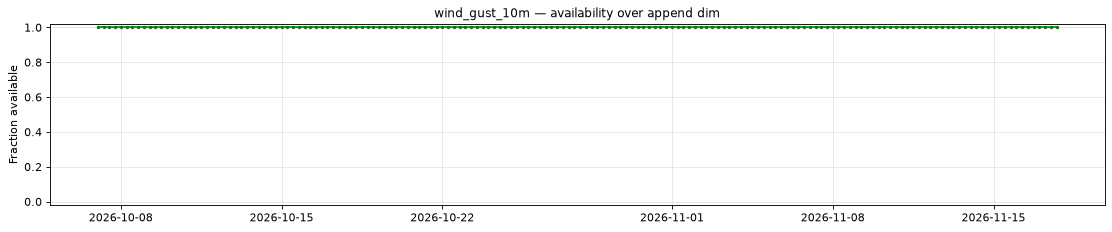
The plot below shows the availability of each variable over time — light red marks unavailable data, dark green marks present data.
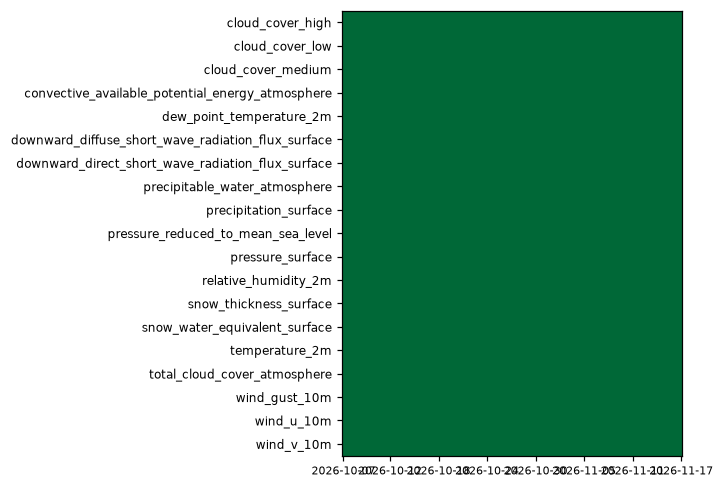
Every variable is complete at every scanned position.
Per-variable details
cloud_cover_high
Metadata
| Field | Value |
|---|---|
| units | percent |
| long_name | High cloud cover |
| short_name | hcc |
| standard_name | cloud_area_fraction_in_atmosphere_layer |
| step_type | instant |
| comment | Cloud cover (0 - 400 hPa). |
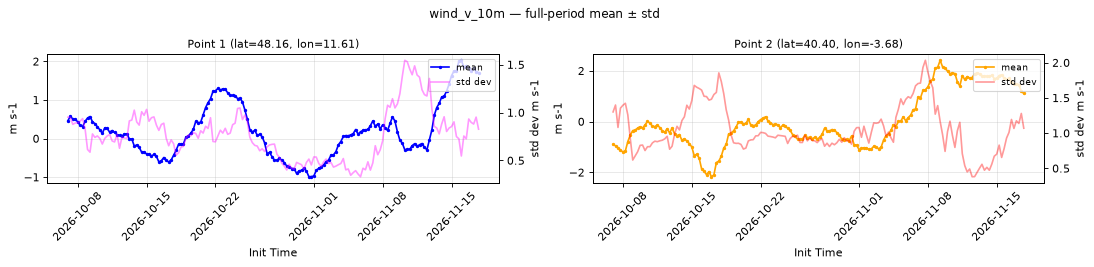
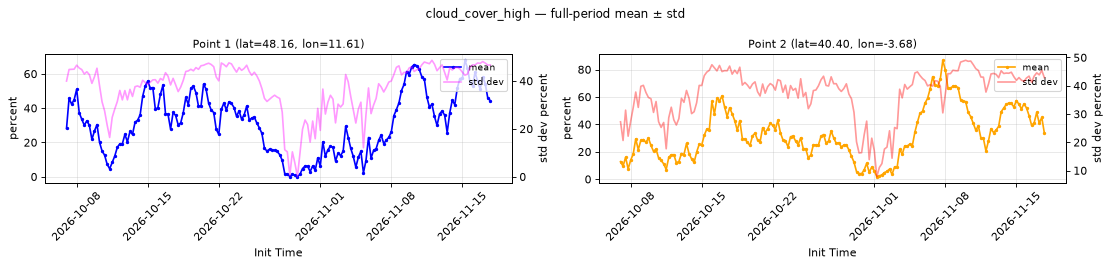
Point time series — 2026-10-07T00:00 - 2026-11-17T18:00
| Point | min | mean | std | max |
|---|---|---|---|---|
| P1 | 0 | 31.51 | 37.5 | 67.92 |
| P2 | 1.768 | 32.63 | 37.4 | 86.75 |
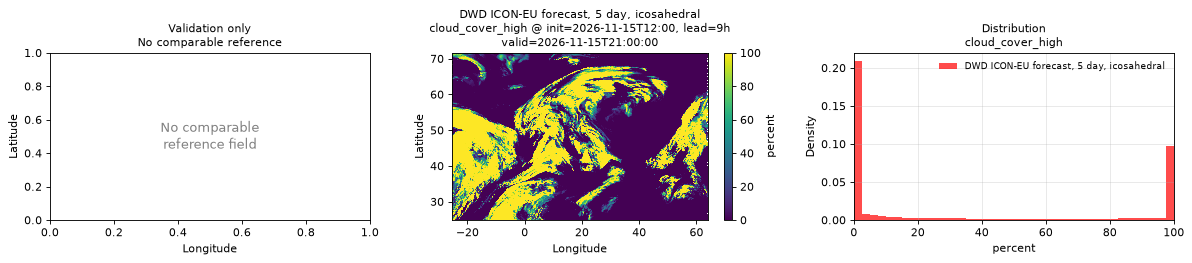
Spatial — init=2026-11-15T12:00, lead=9h, valid=2026-11-15T21:00:00 (reference not available)
| Source | min | mean | max |
|---|---|---|---|
| Validation | 0 | 33.99 | 100 |
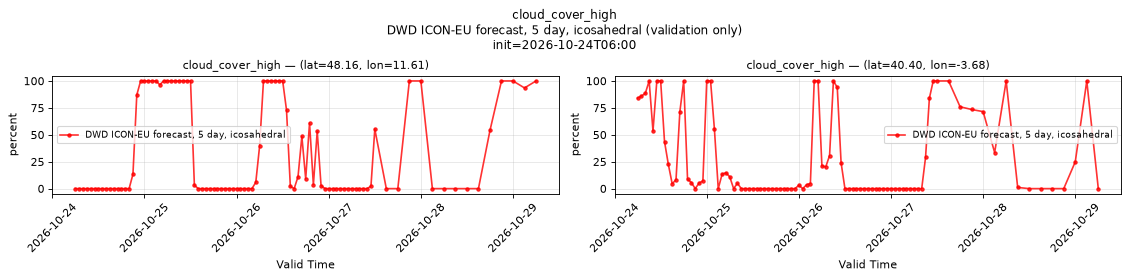
Temporal — init=2026-10-24T06:00
| Source | min | mean | max |
|---|---|---|---|
| P1 Validation | 0 | 33.49 | 100 |
| P2 Validation | 0 | 27.78 | 100 |
Availability — 168 of 168 positions complete; nulls P1 0/15624, P2 0/15624
cloud_cover_low
Metadata
| Field | Value |
|---|---|
| units | percent |
| long_name | Low cloud cover |
| short_name | lcc |
| standard_name | cloud_area_fraction_in_atmosphere_layer |
| step_type | instant |
| comment | Cloud cover (800 hPa - surface). |
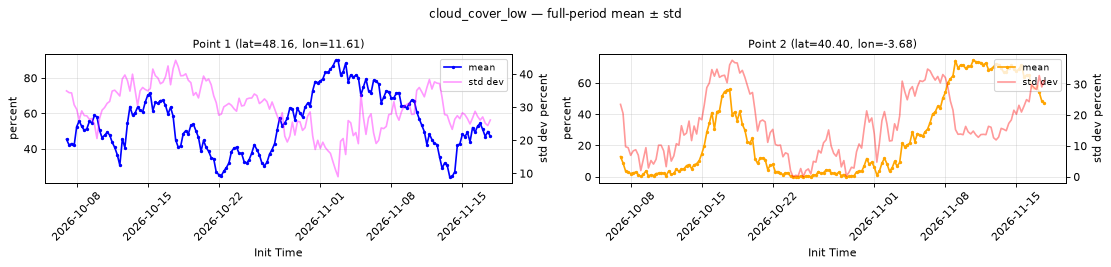
Point time series — 2026-10-07T00:00 - 2026-11-17T18:00
| Point | min | mean | std | max |
|---|---|---|---|---|
| P1 | 24.28 | 54.5 | 29.61 | 90.01 |
| P2 | 0 | 25.75 | 17.04 | 74.54 |
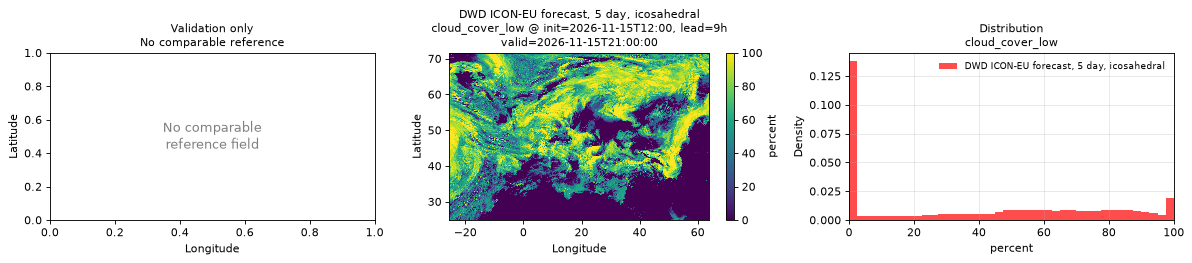
Spatial — init=2026-11-15T12:00, lead=9h, valid=2026-11-15T21:00:00 (reference not available)
| Source | min | mean | max |
|---|---|---|---|
| Validation | 0 | 39.24 | 100 |
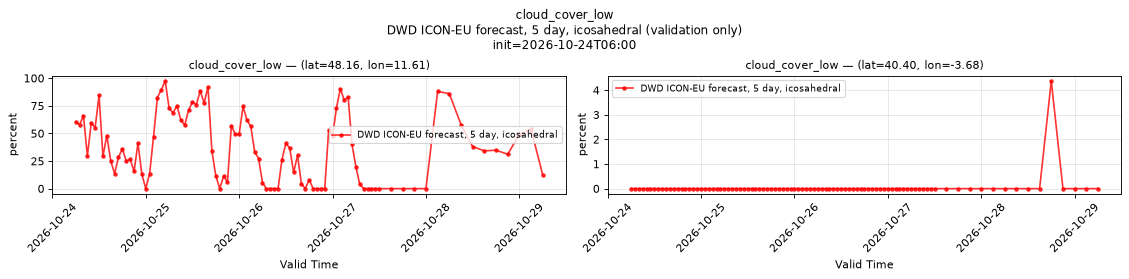
Temporal — init=2026-10-24T06:00
| Source | min | mean | max |
|---|---|---|---|
| P1 Validation | 0 | 37.41 | 97.5 |
| P2 Validation | 0 | 0.04704 | 4.375 |
Availability — 168 of 168 positions complete; nulls P1 0/15624, P2 0/15624
cloud_cover_medium
Metadata
| Field | Value |
|---|---|
| units | percent |
| long_name | Medium cloud cover |
| short_name | mcc |
| standard_name | cloud_area_fraction_in_atmosphere_layer |
| step_type | instant |
| comment | Cloud cover (400 - 800 hPa). |
Point time series — 2026-10-07T00:00 - 2026-11-17T18:00
| Point | min | mean | std | max |
|---|---|---|---|---|
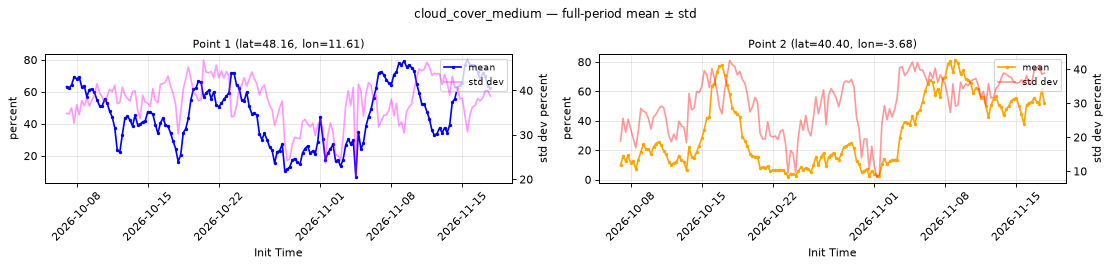
| P1 | 6.931 | 46.48 | 37.51 | 79.74 |
| P2 | 1.948 | 31.79 | 29.97 | 81.12 |
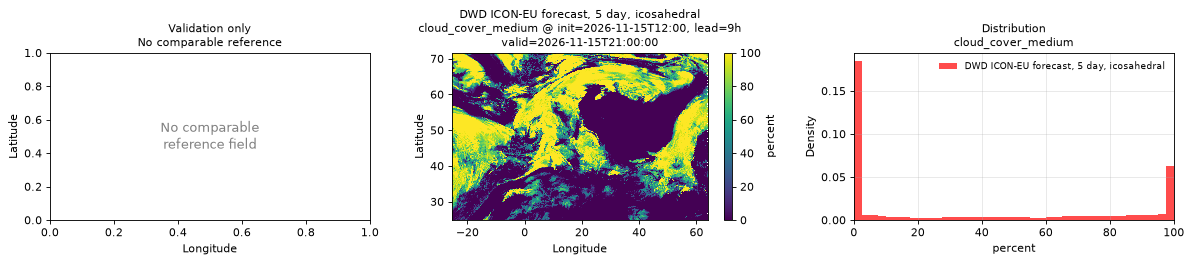
Spatial — init=2026-11-15T12:00, lead=9h, valid=2026-11-15T21:00:00 (reference not available)
| Source | min | mean | max |
|---|---|---|---|
| Validation | 0 | 35.97 | 100 |
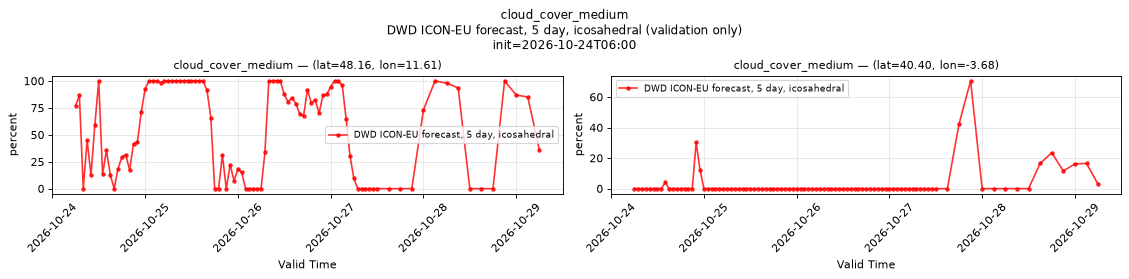
Temporal — init=2026-10-24T06:00
| Source | min | mean | max |
|---|---|---|---|
| P1 Validation | 0 | 54.89 | 100 |
| P2 Validation | 0 | 2.65 | 70.5 |
Availability — 168 of 168 positions complete; nulls P1 0/15624, P2 0/15624
convective_available_potential_energy_atmosphere
Metadata
| Field | Value |
|---|---|
| units | J kg-1 |
| long_name | Convective available potential energy |
| short_name | cape |
| standard_name | atmosphere_convective_available_potential_energy |
| step_type | instant |
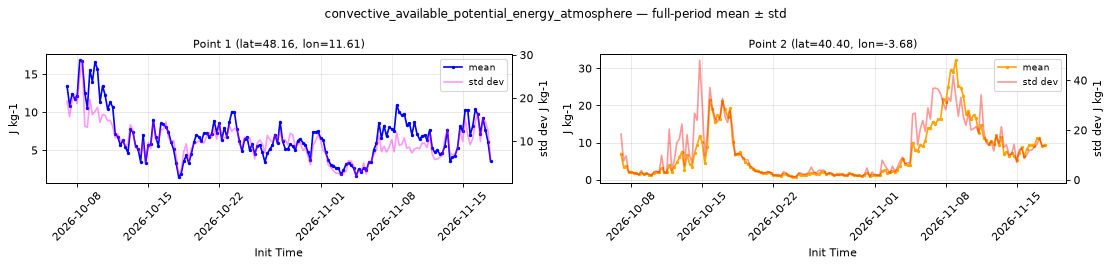
Point time series — 2026-10-07T00:00 - 2026-11-17T18:00
| Point | min | mean | std | max |
|---|---|---|---|---|
| P1 | 1.509 | 6.84 | 9.977 | 16.83 |
| P2 | 0.829 | 7.069 | 12 | 32.17 |
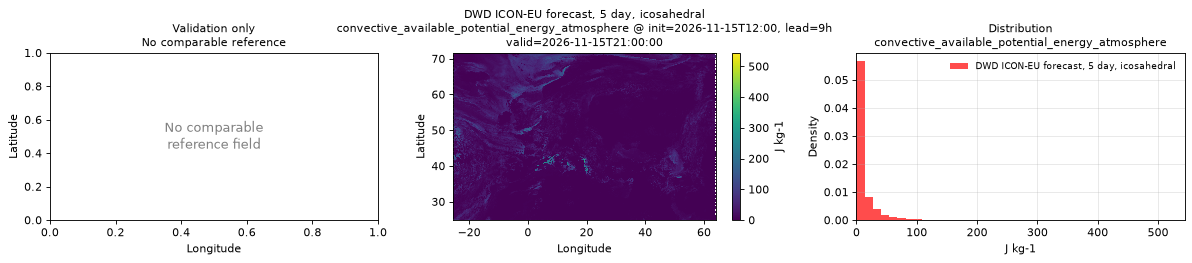
Spatial — init=2026-11-15T12:00, lead=9h, valid=2026-11-15T21:00:00 (reference not available)
| Source | min | mean | max |
|---|---|---|---|
| Validation | 0 | 10.46 | 544 |
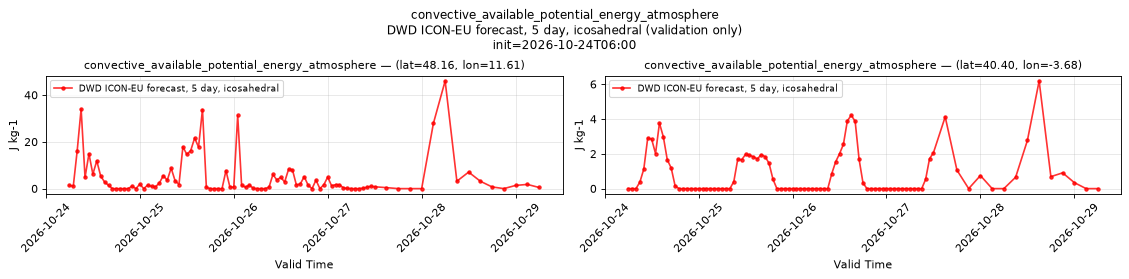
Temporal — init=2026-10-24T06:00
| Source | min | mean | max |
|---|---|---|---|
| P1 Validation | 0 | 4.859 | 46 |
| P2 Validation | 0 | 0.8458 | 6.188 |
Availability — 168 of 168 positions complete; nulls P1 0/15624, P2 0/15624
dew_point_temperature_2m
Metadata
| Field | Value |
|---|---|
| units | degree_Celsius |
| long_name | 2 metre dewpoint temperature |
| short_name | 2d |
| standard_name | dew_point_temperature |
| step_type | instant |
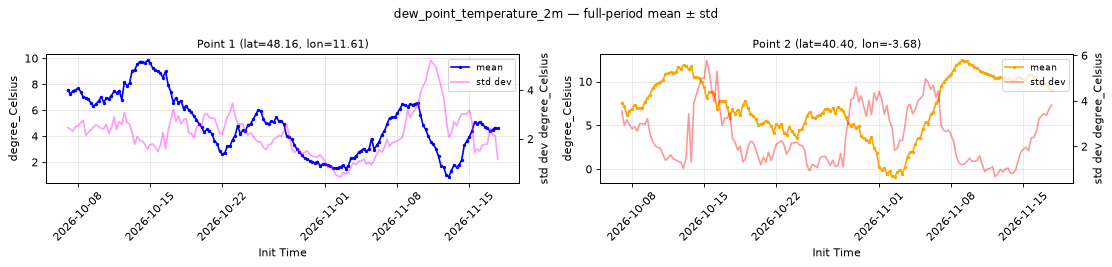
Point time series — 2026-10-07T00:00 - 2026-11-17T18:00
| Point | min | mean | std | max |
|---|---|---|---|---|
| P1 | 0.8736 | 4.919 | 2.211 | 9.848 |
| P2 | -0.8759 | 7.265 | 2.481 | 12.43 |
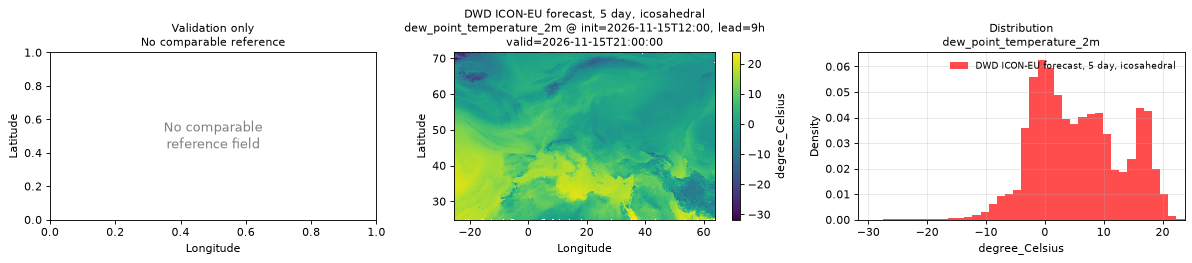
Spatial — init=2026-11-15T12:00, lead=9h, valid=2026-11-15T21:00:00 (reference not available)
| Source | min | mean | max |
|---|---|---|---|
| Validation | -31.75 | 5.667 | 23.75 |
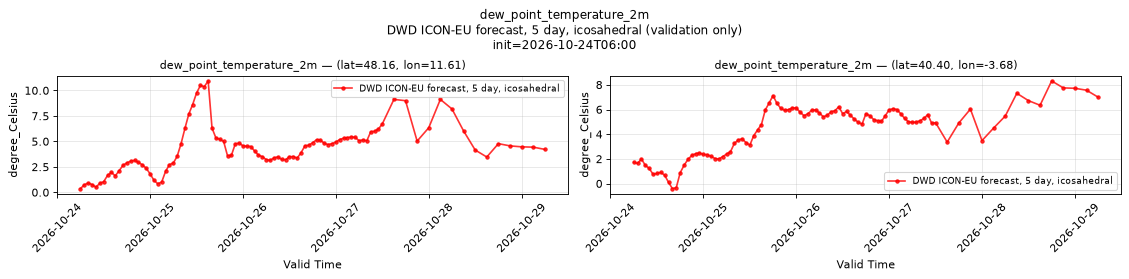
Temporal — init=2026-10-24T06:00
| Source | min | mean | max |
|---|---|---|---|
| P1 Validation | 0.3672 | 4.389 | 10.94 |
| P2 Validation | -0.4043 | 4.409 | 8.312 |
Availability — 168 of 168 positions complete; nulls P1 0/15624, P2 0/15624
downward_diffuse_short_wave_radiation_flux_surface
Metadata
| Field | Value |
|---|---|
| units | W m-2 |
| long_name | Surface diffuse short-wave radiation flux |
| short_name | aswdifd_s |
| standard_name | surface_diffuse_downwelling_shortwave_flux_in_air |
| step_type | avg |
| comment | Average flux since the previous forecast step. |
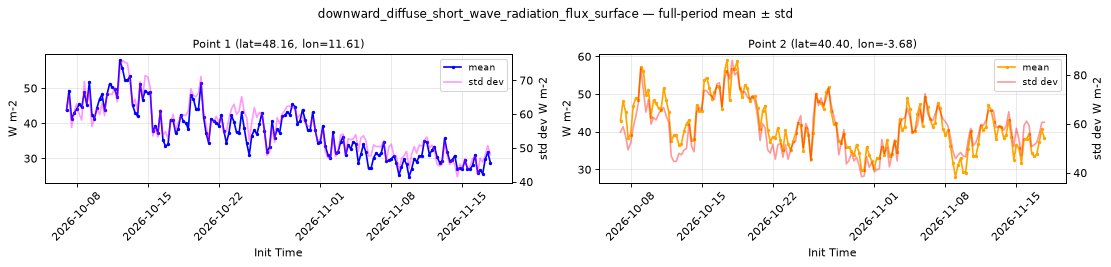
Point time series — 2026-10-07T00:00 - 2026-11-17T18:00
| Point | min | mean | std | max |
|---|---|---|---|---|
| P1 | 24.77 | 37.56 | 55.92 | 57.95 |
| P2 | 28.07 | 41.78 | 58.56 | 59 |
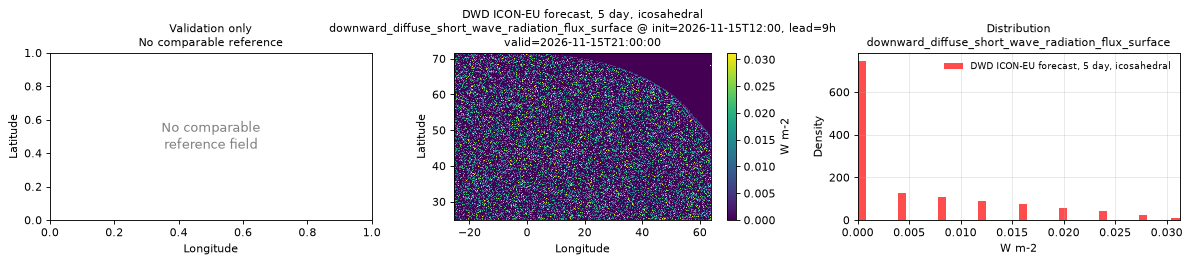
Spatial — init=2026-11-15T12:00, lead=9h, valid=2026-11-15T21:00:00 (reference not available)
| Source | min | mean | max |
|---|---|---|---|
| Validation | 0 | 0.005166 | 0.03125 |
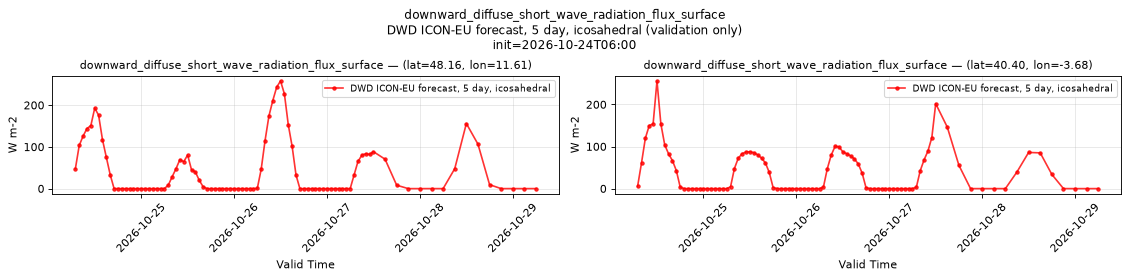
Temporal — init=2026-10-24T06:00
| Source | min | mean | max |
|---|---|---|---|
| P1 Validation | 0 | 43.13 | 258 |
| P2 Validation | 0 | 39.61 | 256 |
Availability — 168 of 168 positions complete; nulls P1 0/15456, P2 0/15456
downward_direct_short_wave_radiation_flux_surface
Metadata
| Field | Value |
|---|---|
| units | W m-2 |
| long_name | Surface direct short-wave radiation flux |
| short_name | aswdir_s |
| standard_name | surface_direct_downwelling_shortwave_flux_in_air |
| step_type | avg |
| comment | Average flux since the previous forecast step. |
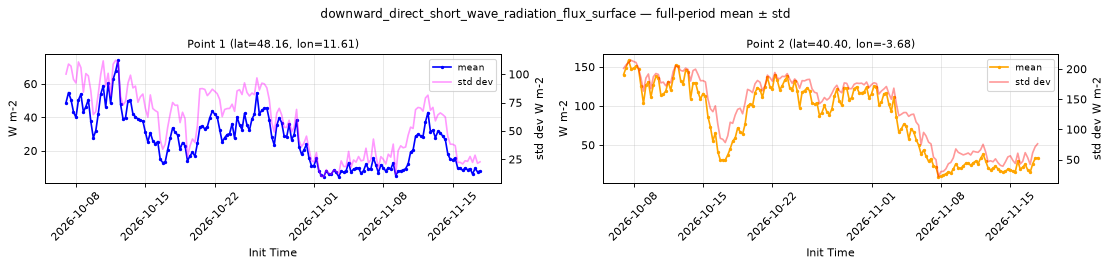
Point time series — 2026-10-07T00:00 - 2026-11-17T18:00
| Point | min | mean | std | max |
|---|---|---|---|---|
| P1 | 4.465 | 26.81 | 58.18 | 74.11 |
| P2 | 9.368 | 83.22 | 134.5 | 158.4 |
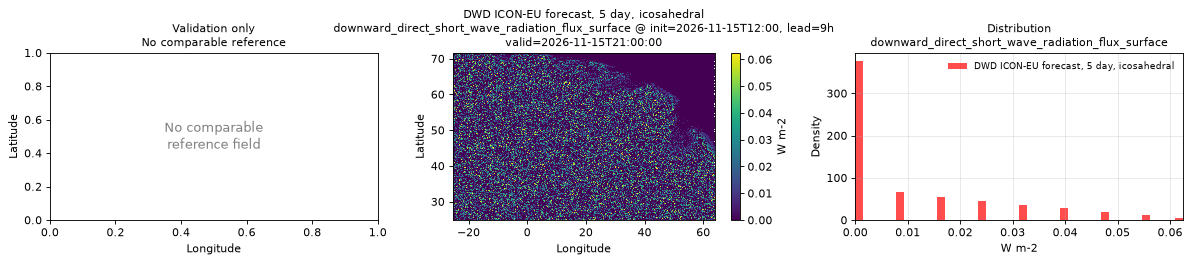
Spatial — init=2026-11-15T12:00, lead=9h, valid=2026-11-15T21:00:00 (reference not available)
| Source | min | mean | max |
|---|---|---|---|
| Validation | 0 | 0.009934 | 0.0625 |
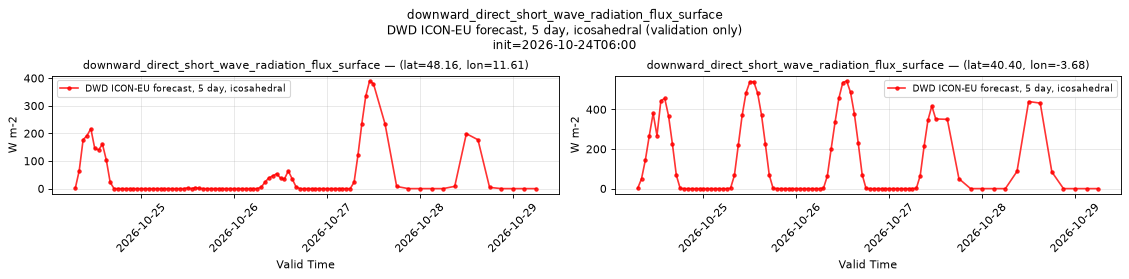
Temporal — init=2026-10-24T06:00
| Source | min | mean | max |
|---|---|---|---|
| P1 Validation | 0 | 40.19 | 390 |
| P2 Validation | 0 | 132.4 | 544 |
Availability — 168 of 168 positions complete; nulls P1 0/15456, P2 0/15456
precipitable_water_atmosphere
Metadata
| Field | Value |
|---|---|
| units | kg m-2 |
| long_name | Precipitable water |
| short_name | pwat |
| standard_name | atmosphere_mass_content_of_water_vapor |
| step_type | instant |
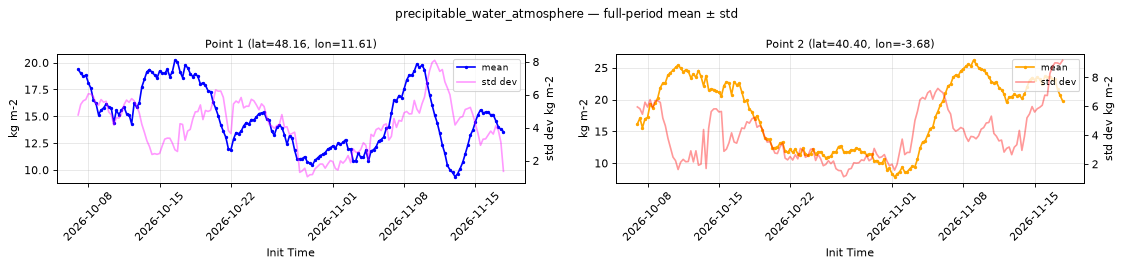
Point time series — 2026-10-07T00:00 - 2026-11-17T18:00
| Point | min | mean | std | max |
|---|---|---|---|---|
| P1 | 9.364 | 14.88 | 4.221 | 20.22 |
| P2 | 7.871 | 17.72 | 4.009 | 26.17 |
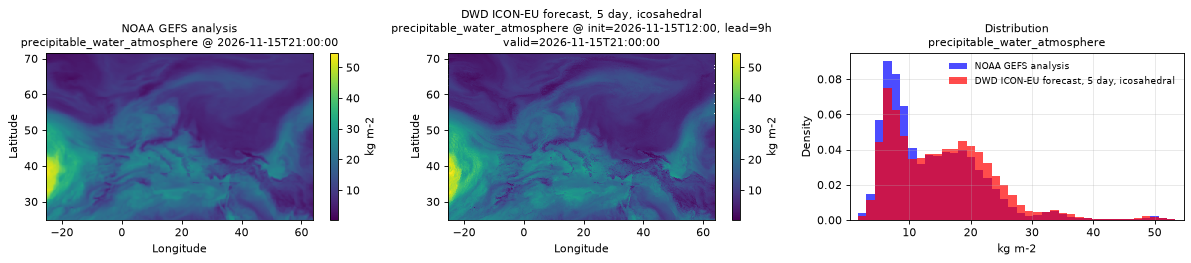
Spatial — init=2026-11-15T12:00, lead=9h, valid=2026-11-15T21:00:00 (reference at 2026-11-15T21:00:00)
| Source | min | mean | max |
|---|---|---|---|
| Validation | 0.2949 | 15.37 | 54.75 |
| Reference | 1.297 | 13.66 | 53.25 |
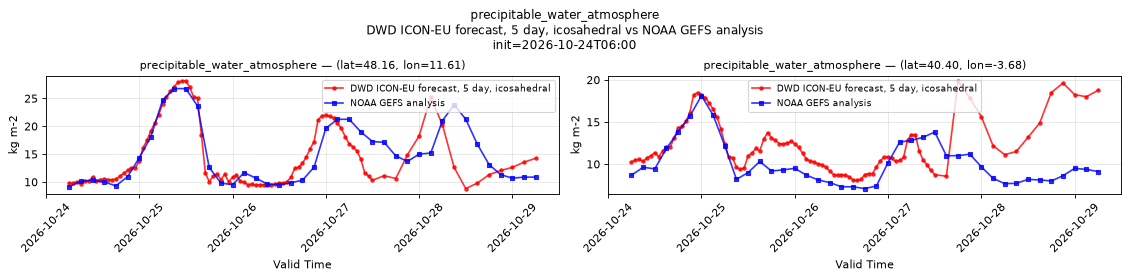
Temporal — init=2026-10-24T06:00
| Source | min | mean | max |
|---|---|---|---|
| P1 Validation | 8.812 | 14.66 | 28.12 |
| P1 Reference | 9.188 | 14.98 | 26.75 |
| P2 Validation | 8.062 | 12.19 | 19.88 |
| P2 Reference | 7.094 | 10.11 | 18.12 |
Availability — 168 of 168 positions complete; nulls P1 0/15624, P2 0/15624
precipitation_surface
Metadata
| Field | Value |
|---|---|
| units | kg m-2 s-1 |
| long_name | Precipitation rate |
| short_name | prate |
| standard_name | precipitation_flux |
| step_type | avg |
| comment | Average precipitation rate since the previous forecast step. Units equivalent to mm/s. |
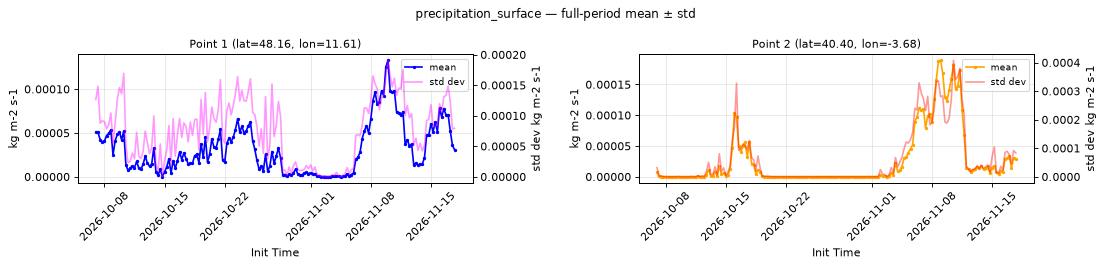
Point time series — 2026-10-07T00:00 - 2026-11-17T18:00
| Point | min | mean | std | max |
|---|---|---|---|---|
| P1 | 1.222e-25 | 3.141e-05 | 7.628e-05 | 0.0001329 |
| P2 | 0 | 2.632e-05 | 6.23e-05 | 0.0001894 |
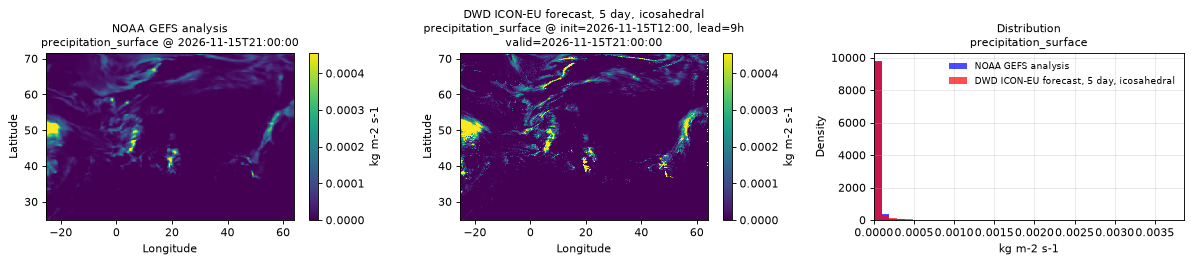
Spatial — init=2026-11-15T12:00, lead=9h, valid=2026-11-15T21:00:00 (reference at 2026-11-15T21:00:00)
| Source | min | mean | max |
|---|---|---|---|
| Validation | 0 | 2.342e-05 | 0.00386 |
| Reference | 0 | 1.927e-05 | 0.001183 |
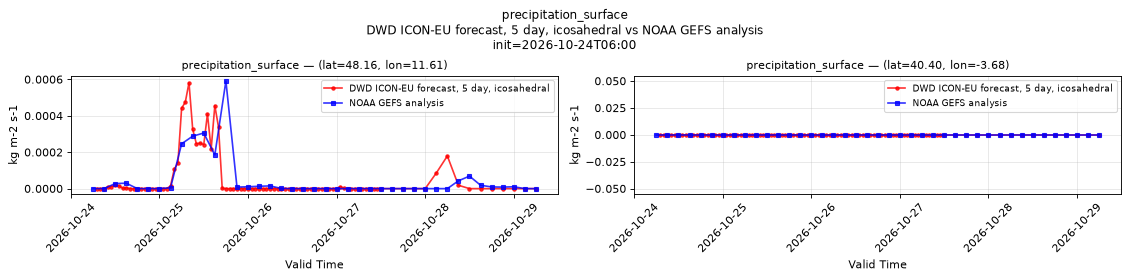
Temporal — init=2026-10-24T06:00
| Source | min | mean | max |
|---|---|---|---|
| P1 Validation | 0 | 5.005e-05 | 0.0005817 |
| P1 Reference | 0 | 4.591e-05 | 0.0005913 |
| P2 Validation | 0 | 0 | 0 |
| P2 Reference | 0 | 0 | 0 |
Availability — 168 of 168 positions complete; nulls P1 0/15456, P2 0/15456
pressure_reduced_to_mean_sea_level
Metadata
| Field | Value |
|---|---|
| units | Pa |
| long_name | Pressure reduced to MSL |
| short_name | prmsl |
| standard_name | air_pressure_at_mean_sea_level |
| step_type | instant |
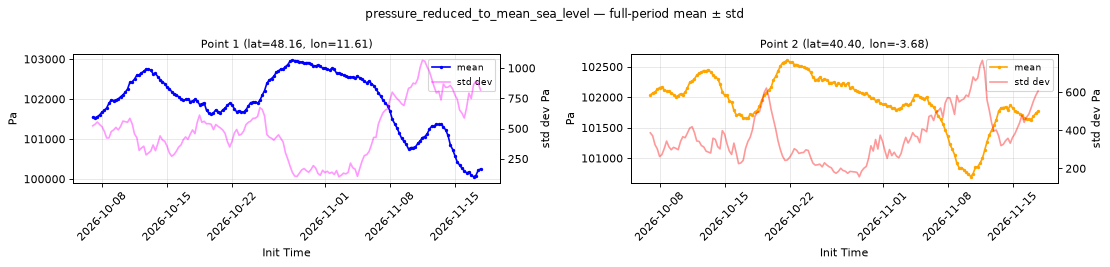
Point time series — 2026-10-07T00:00 - 2026-11-17T18:00
| Point | min | mean | std | max |
|---|---|---|---|---|
| P1 | 1.001e+05 | 1.019e+05 | 485 | 1.03e+05 |
| P2 | 1.007e+05 | 1.019e+05 | 367.2 | 1.026e+05 |
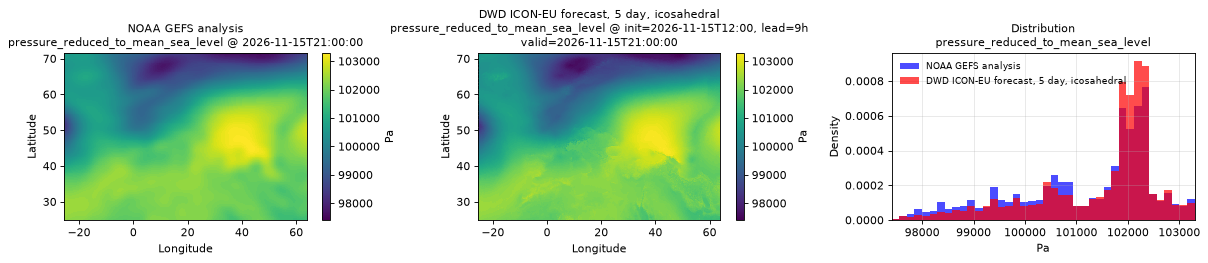
Spatial — init=2026-11-15T12:00, lead=9h, valid=2026-11-15T21:00:00 (reference at 2026-11-15T21:00:00)
| Source | min | mean | max |
|---|---|---|---|
| Validation | 9.741e+04 | 1.015e+05 | 1.033e+05 |
| Reference | 9.754e+04 | 1.012e+05 | 1.033e+05 |
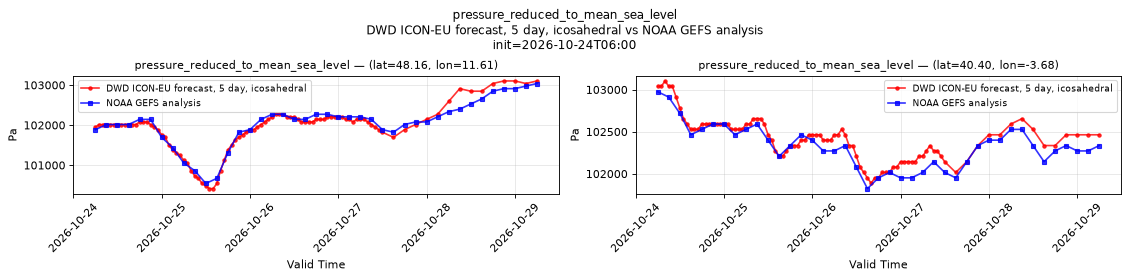
Temporal — init=2026-10-24T06:00
| Source | min | mean | max |
|---|---|---|---|
| P1 Validation | 1.004e+05 | 1.019e+05 | 1.031e+05 |
| P1 Reference | 1.005e+05 | 1.021e+05 | 1.03e+05 |
| P2 Validation | 1.019e+05 | 1.024e+05 | 1.031e+05 |
| P2 Reference | 1.018e+05 | 1.023e+05 | 1.03e+05 |
Availability — 168 of 168 positions complete; nulls P1 0/15624, P2 0/15624
pressure_surface
Metadata
| Field | Value |
|---|---|
| units | Pa |
| long_name | Surface pressure |
| short_name | sp |
| standard_name | surface_air_pressure |
| step_type | instant |
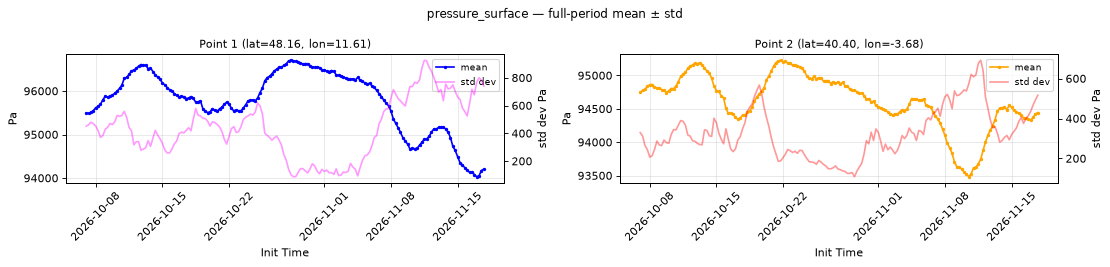
Point time series — 2026-10-07T00:00 - 2026-11-17T18:00
| Point | min | mean | std | max |
|---|---|---|---|---|
| P1 | 9.403e+04 | 9.578e+04 | 435.7 | 9.671e+04 |
| P2 | 9.348e+04 | 9.461e+04 | 327.2 | 9.523e+04 |
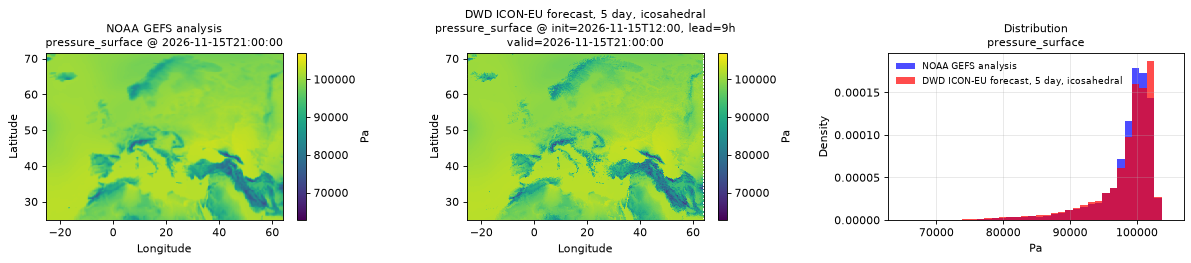
Spatial — init=2026-11-15T12:00, lead=9h, valid=2026-11-15T21:00:00 (reference at 2026-11-15T21:00:00)
| Source | min | mean | max |
|---|---|---|---|
| Validation | 6.275e+04 | 9.825e+04 | 1.07e+05 |
| Reference | 7.187e+04 | 9.841e+04 | 1.034e+05 |
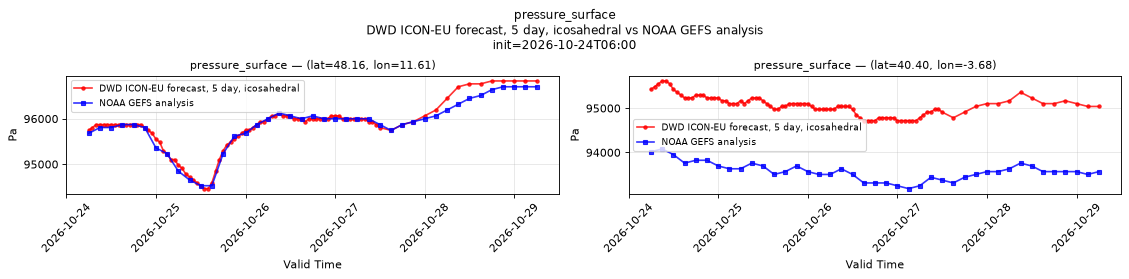
Temporal — init=2026-10-24T06:00
| Source | min | mean | max |
|---|---|---|---|
| P1 Validation | 9.446e+04 | 9.579e+04 | 9.683e+04 |
| P1 Reference | 9.453e+04 | 9.588e+04 | 9.67e+04 |
| P2 Validation | 9.472e+04 | 9.506e+04 | 9.562e+04 |
| P2 Reference | 9.318e+04 | 9.358e+04 | 9.408e+04 |
Availability — 168 of 168 positions complete; nulls P1 0/15624, P2 0/15624
relative_humidity_2m
Metadata
| Field | Value |
|---|---|
| units | percent |
| long_name | 2 metre relative humidity |
| short_name | 2r |
| standard_name | relative_humidity |
| step_type | instant |
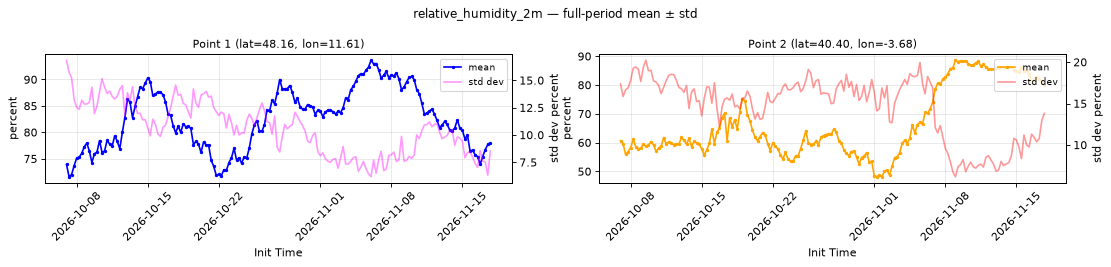
Point time series — 2026-10-07T00:00 - 2026-11-17T18:00
| Point | min | mean | std | max |
|---|---|---|---|---|
| P1 | 71.59 | 82.47 | 10.6 | 93.64 |
| P2 | 48.15 | 66.55 | 14.57 | 88.6 |
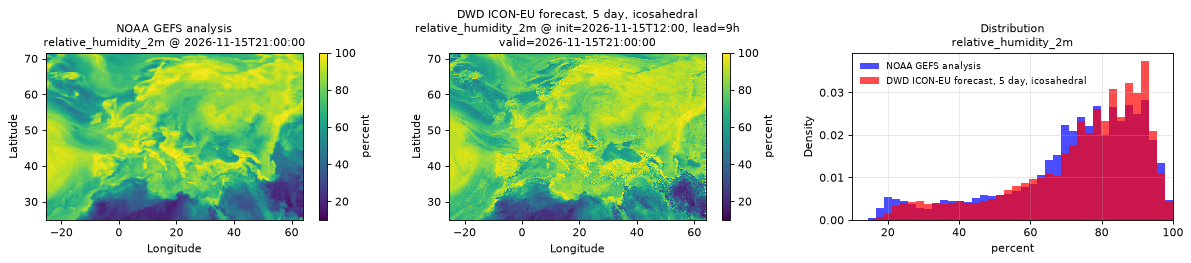
Spatial — init=2026-11-15T12:00, lead=9h, valid=2026-11-15T21:00:00 (reference at 2026-11-15T21:00:00)
| Source | min | mean | max |
|---|---|---|---|
| Validation | 9.938 | 74.02 | 100 |
| Reference | 14.62 | 72.1 | 100 |
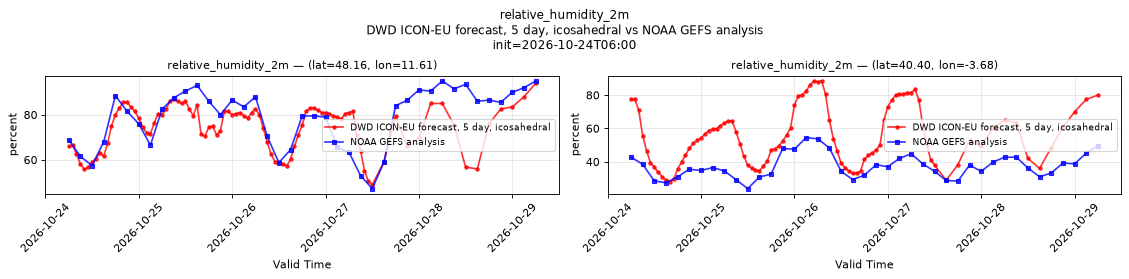
Temporal — init=2026-10-24T06:00
| Source | min | mean | max |
|---|---|---|---|
| P1 Validation | 49 | 74.13 | 94 |
| P1 Reference | 47.25 | 78.85 | 95 |
| P2 Validation | 28.12 | 55.39 | 88.5 |
| P2 Reference | 23.88 | 37.48 | 54.5 |
Availability — 168 of 168 positions complete; nulls P1 0/15624, P2 0/15624
snow_thickness_surface
Metadata
| Field | Value |
|---|---|
| units | m |
| long_name | Snow depth |
| short_name | sde |
| standard_name | surface_snow_thickness |
| step_type | instant |
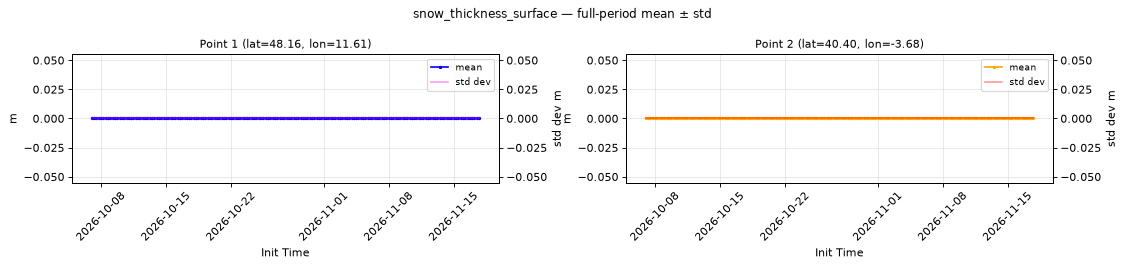
Point time series — 2026-10-07T00:00 - 2026-11-17T18:00
| Point | min | mean | std | max |
|---|---|---|---|---|
| P1 | 0 | 0 | 0 | 0 |
| P2 | 0 | 0 | 0 | 0 |
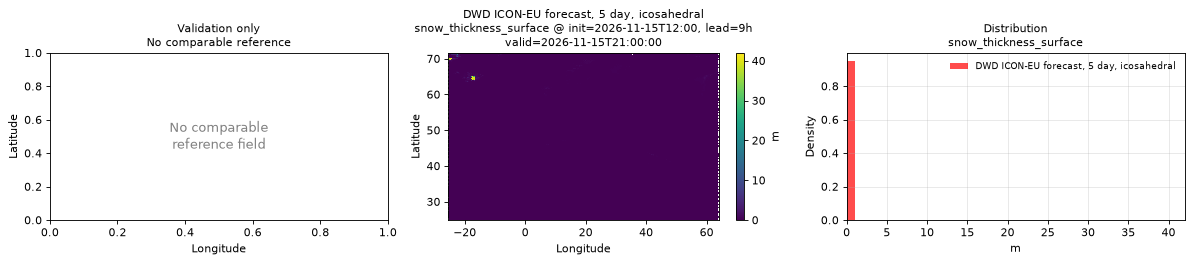
Spatial — init=2026-11-15T12:00, lead=9h, valid=2026-11-15T21:00:00 (reference not available)
| Source | min | mean | max |
|---|---|---|---|
| Validation | 0 | 0.01993 | 42 |
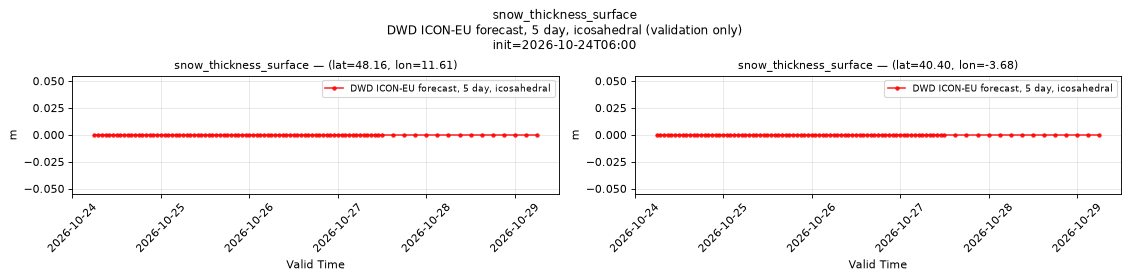
Temporal — init=2026-10-24T06:00
| Source | min | mean | max |
|---|---|---|---|
| P1 Validation | 0 | 0 | 0 |
| P2 Validation | 0 | 0 | 0 |
Availability — 168 of 168 positions complete; nulls P1 0/15624, P2 0/15624
snow_water_equivalent_surface
Metadata
| Field | Value |
|---|---|
| units | m |
| long_name | Snow depth water equivalent |
| short_name | sd |
| standard_name | lwe_thickness_of_surface_snow_amount |
| step_type | instant |
| comment | Set to 0 over water surfaces and snow-free land points. |
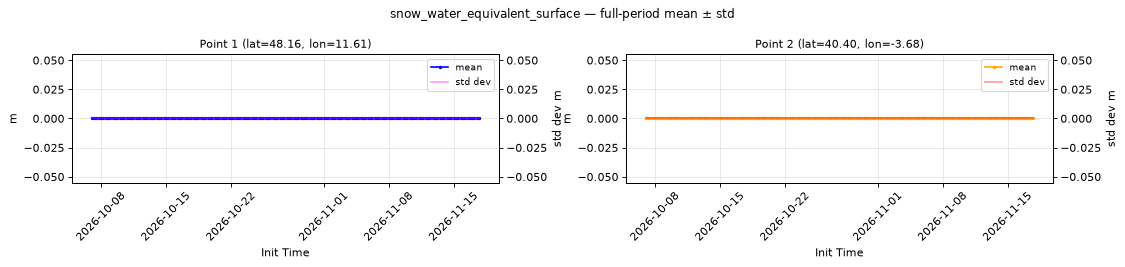
Point time series — 2026-10-07T00:00 - 2026-11-17T18:00
| Point | min | mean | std | max |
|---|---|---|---|---|
| P1 | 0 | 0 | 0 | 0 |
| P2 | 0 | 0 | 0 | 0 |
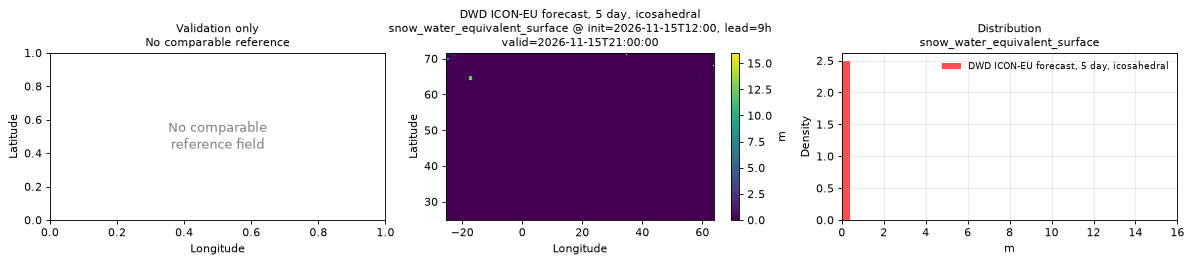
Spatial — init=2026-11-15T12:00, lead=9h, valid=2026-11-15T21:00:00 (reference not available)
| Source | min | mean | max |
|---|---|---|---|
| Validation | 0 | 0.005733 | 16 |
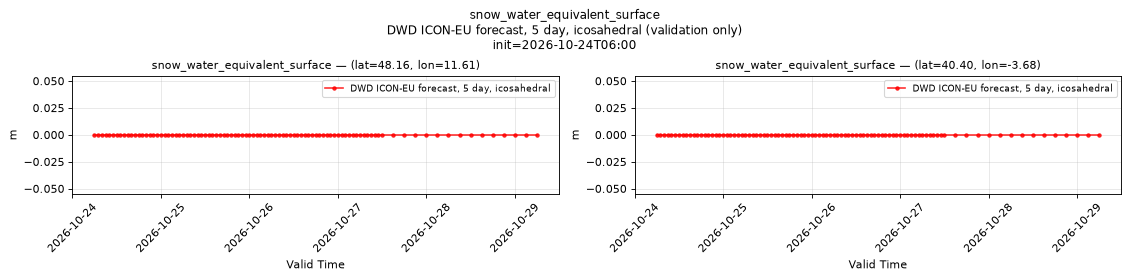
Temporal — init=2026-10-24T06:00
| Source | min | mean | max |
|---|---|---|---|
| P1 Validation | 0 | 0 | 0 |
| P2 Validation | 0 | 0 | 0 |
Availability — 168 of 168 positions complete; nulls P1 0/15624, P2 0/15624
temperature_2m
Metadata
| Field | Value |
|---|---|
| units | degree_Celsius |
| long_name | 2 metre temperature |
| short_name | 2t |
| standard_name | air_temperature |
| step_type | instant |
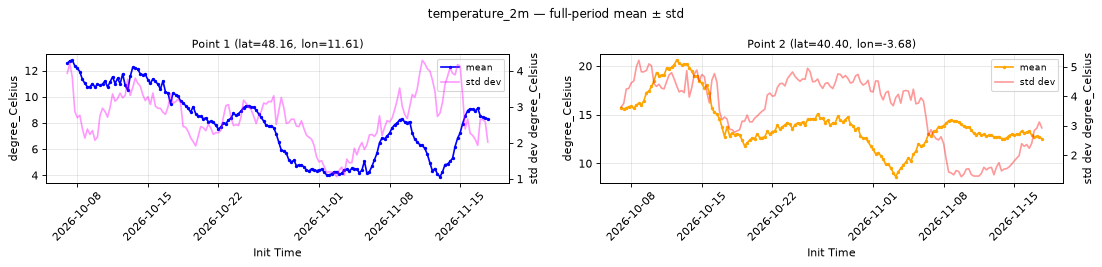
Point time series — 2026-10-07T00:00 - 2026-11-17T18:00
| Point | min | mean | std | max |
|---|---|---|---|---|
| P1 | 3.89 | 7.912 | 2.718 | 12.79 |
| P2 | 8.636 | 14.1 | 3.571 | 20.59 |
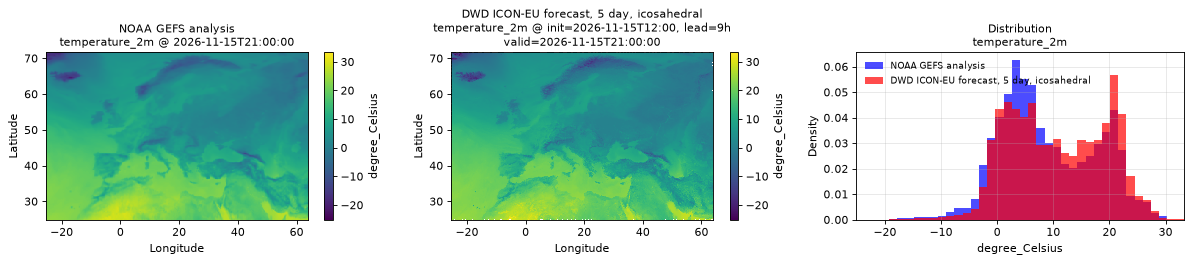
Spatial — init=2026-11-15T12:00, lead=9h, valid=2026-11-15T21:00:00 (reference at 2026-11-15T21:00:00)
| Source | min | mean | max |
|---|---|---|---|
| Validation | -25.12 | 10.79 | 33.25 |
| Reference | -20.5 | 9.012 | 29.88 |
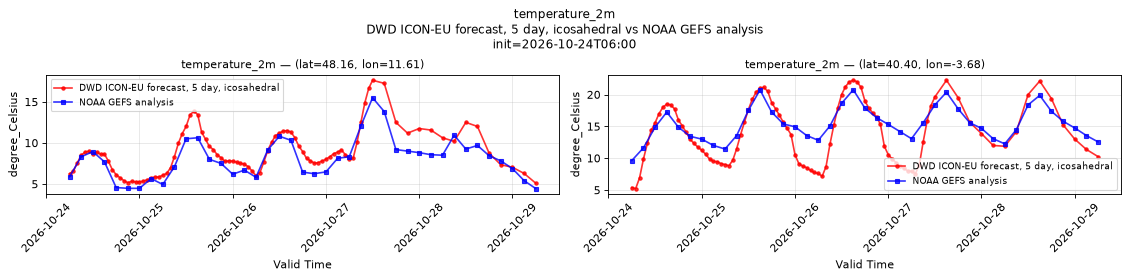
Temporal — init=2026-10-24T06:00
| Source | min | mean | max |
|---|---|---|---|
| P1 Validation | 5.094 | 8.901 | 17.62 |
| P1 Reference | 4.438 | 8.084 | 15.5 |
| P2 Validation | 5.219 | 13.99 | 22.25 |
| P2 Reference | 9.625 | 15.36 | 20.75 |
Availability — 168 of 168 positions complete; nulls P1 0/15624, P2 0/15624
total_cloud_cover_atmosphere
Metadata
| Field | Value |
|---|---|
| units | percent |
| long_name | Total cloud cover |
| short_name | tcc |
| standard_name | cloud_area_fraction |
| step_type | instant |
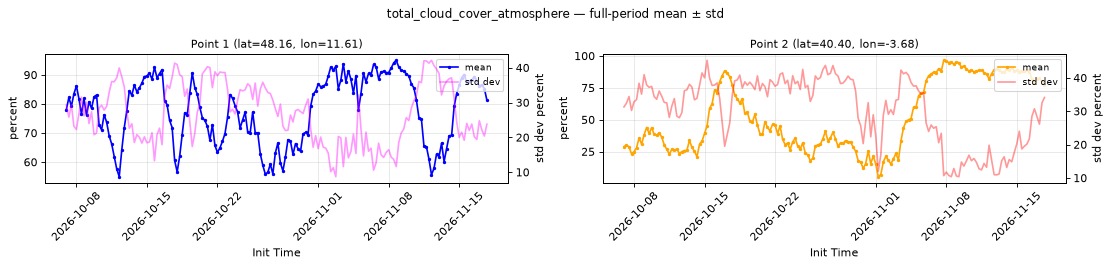
Point time series — 2026-10-07T00:00 - 2026-11-17T18:00
| Point | min | mean | std | max |
|---|---|---|---|---|
| P1 | 54.95 | 77.95 | 26.76 | 95.01 |
| P2 | 5.253 | 52.19 | 30.47 | 96.54 |
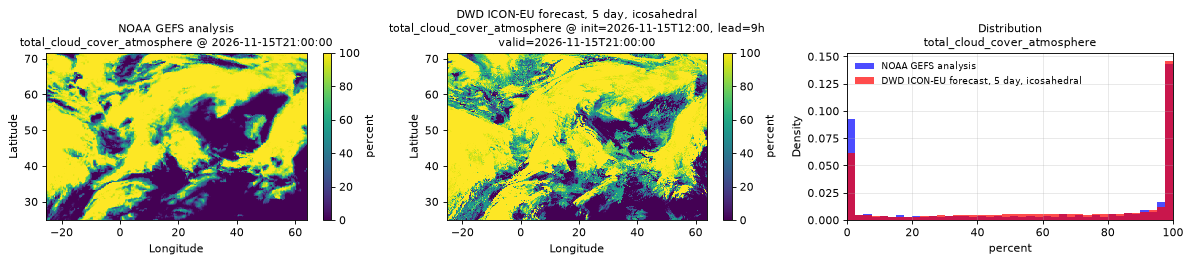
Spatial — init=2026-11-15T12:00, lead=9h, valid=2026-11-15T21:00:00 (reference at 2026-11-15T21:00:00)
| Source | min | mean | max |
|---|---|---|---|
| Validation | 0 | 63.86 | 100 |
| Reference | 0 | 59.2 | 100 |
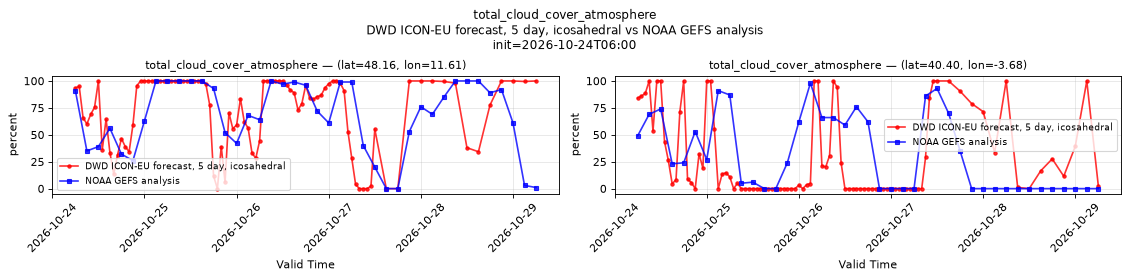
Temporal — init=2026-10-24T06:00
| Source | min | mean | max |
|---|---|---|---|
| P1 Validation | 0 | 71.73 | 100 |
| P1 Reference | 0 | 67.63 | 100 |
| P2 Validation | 0 | 29.23 | 100 |
| P2 Reference | 0 | 31.83 | 98 |
Availability — 168 of 168 positions complete; nulls P1 0/15624, P2 0/15624
wind_gust_10m
Metadata
| Field | Value |
|---|---|
| units | m s-1 |
| long_name | Maximum 10 metre wind gust since previous post-processing |
| short_name | 10fg |
| standard_name | wind_speed_of_gust |
| step_type | max |
| comment | Maximum over the hour ending at the forecast step. At 3-hourly steps (81-120 hours), this covers only the last hour of each step. |
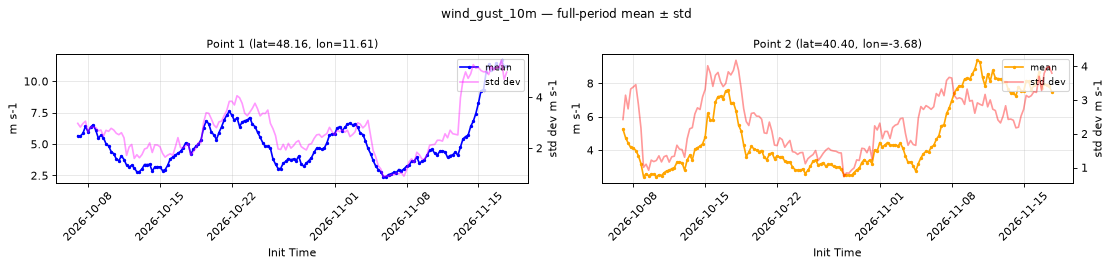
Point time series — 2026-10-07T00:00 - 2026-11-17T18:00
| Point | min | mean | std | max |
|---|---|---|---|---|
| P1 | 2.395 | 5.108 | 2.67 | 11.67 |
| P2 | 2.406 | 4.871 | 2.345 | 9.38 |
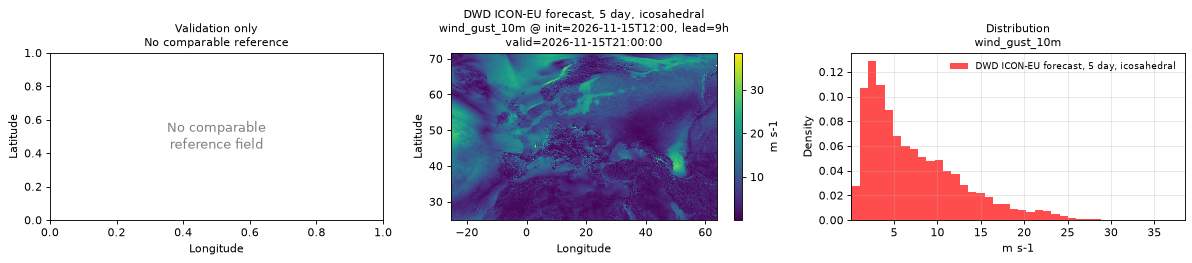
Spatial — init=2026-11-15T12:00, lead=9h, valid=2026-11-15T21:00:00 (reference not available)
| Source | min | mean | max |
|---|---|---|---|
| Validation | 0.08008 | 7.255 | 38.5 |
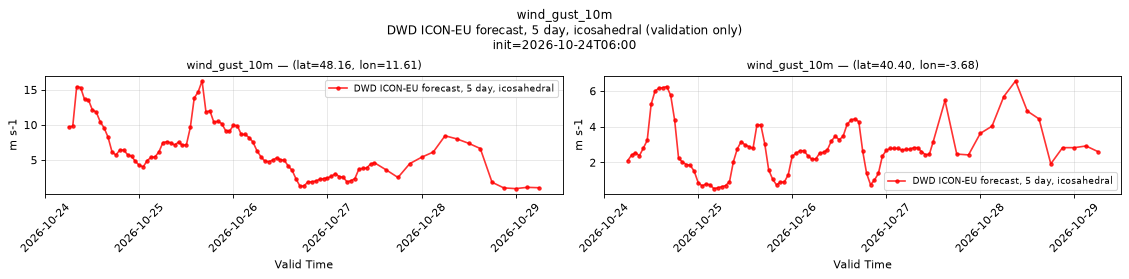
Temporal — init=2026-10-24T06:00
| Source | min | mean | max |
|---|---|---|---|
| P1 Validation | 0.9141 | 6.395 | 16.25 |
| P2 Validation | 0.5352 | 2.783 | 6.562 |
Availability — 168 of 168 positions complete; nulls P1 0/15456, P2 0/15456
wind_u_10m
Metadata
| Field | Value |
|---|---|
| units | m s-1 |
| long_name | 10 metre U wind component |
| short_name | 10u |
| standard_name | eastward_wind |
| step_type | instant |
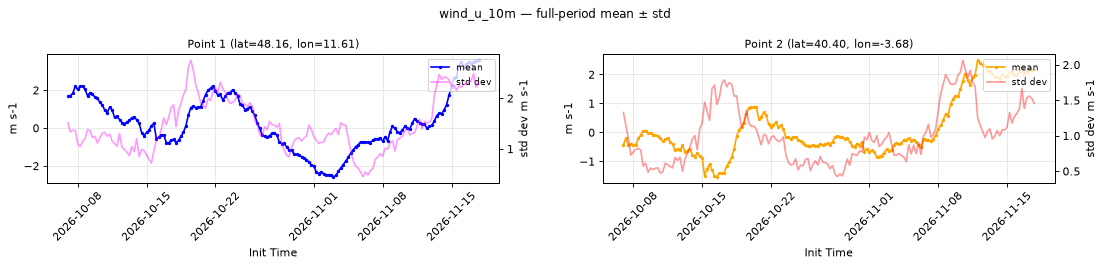
Point time series — 2026-10-07T00:00 - 2026-11-17T18:00
| Point | min | mean | std | max |
|---|---|---|---|---|
| P1 | -2.572 | 0.2893 | 1.474 | 3.578 |
| P2 | -1.528 | 0.1533 | 1.018 | 2.491 |
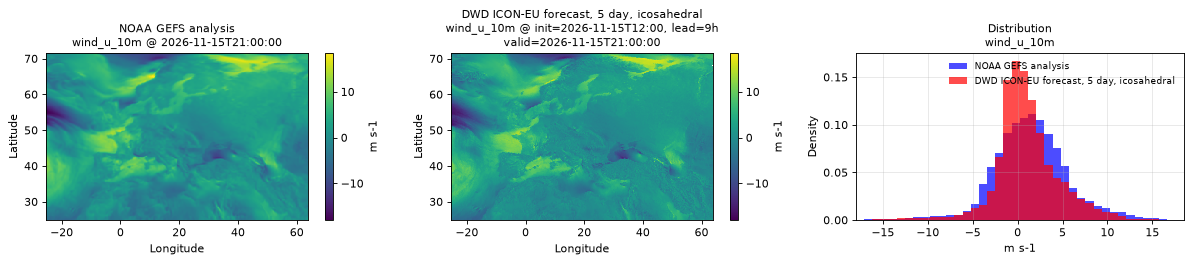
Spatial — init=2026-11-15T12:00, lead=9h, valid=2026-11-15T21:00:00 (reference at 2026-11-15T21:00:00)
| Source | min | mean | max |
|---|---|---|---|
| Validation | -16.5 | 1.09 | 16.88 |
| Reference | -18 | 1.462 | 18.5 |
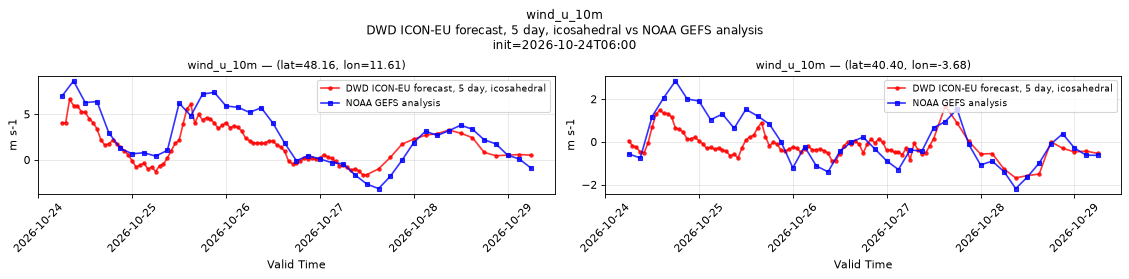
Temporal — init=2026-10-24T06:00
| Source | min | mean | max |
|---|---|---|---|
| P1 Validation | -1.656 | 1.71 | 6.625 |
| P1 Reference | -3.156 | 2.464 | 8.625 |
| P2 Validation | -1.688 | -0.1467 | 1.68 |
| P2 Reference | -2.188 | 0.02833 | 2.844 |
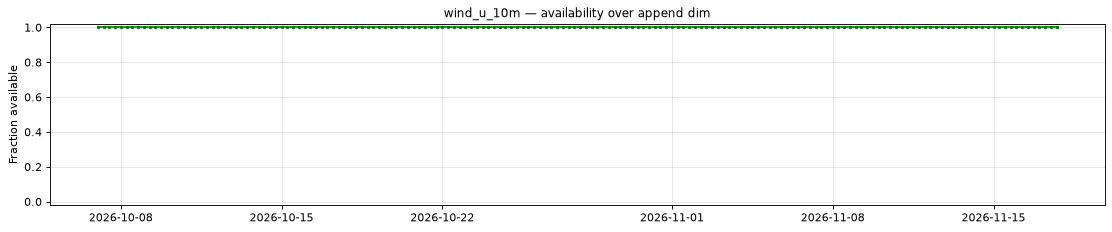
Availability — 168 of 168 positions complete; nulls P1 0/15624, P2 0/15624
wind_v_10m
Metadata
| Field | Value |
|---|---|
| units | m s-1 |
| long_name | 10 metre V wind component |
| short_name | 10v |
| standard_name | northward_wind |
| step_type | instant |
Point time series — 2026-10-07T00:00 - 2026-11-17T18:00
| Point | min | mean | std | max |
|---|---|---|---|---|
| P1 | -0.9905 | 0.2053 | 0.765 | 2.028 |
| P2 | -2.174 | 0.02106 | 1.05 | 2.413 |
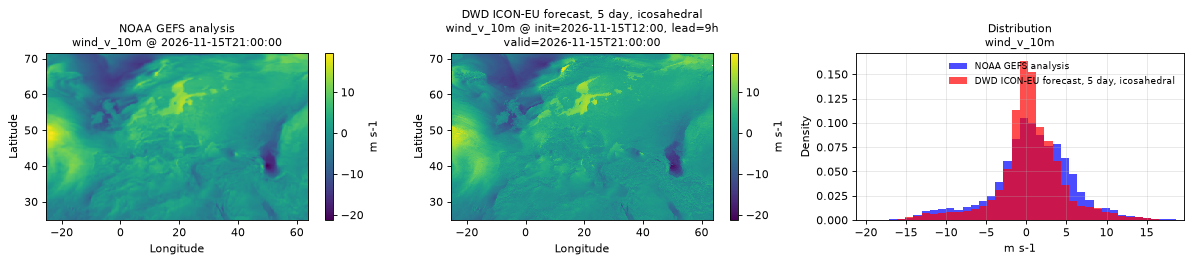
Spatial — init=2026-11-15T12:00, lead=9h, valid=2026-11-15T21:00:00 (reference at 2026-11-15T21:00:00)
| Source | min | mean | max |
|---|---|---|---|
| Validation | -21.12 | 0.4515 | 19.62 |
| Reference | -21.25 | 0.7279 | 19.25 |
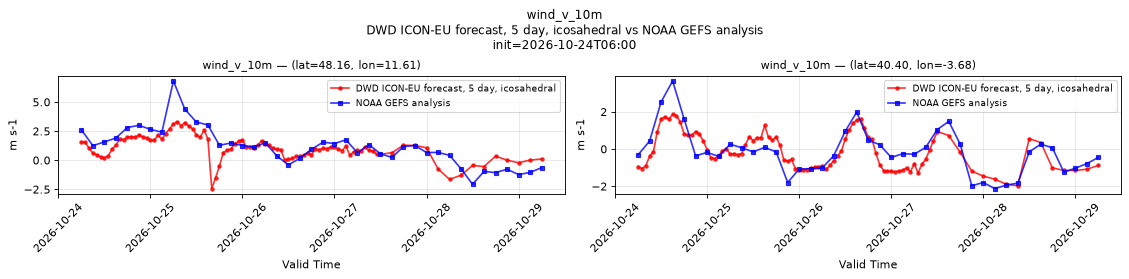
Temporal — init=2026-10-24T06:00
| Source | min | mean | max |
|---|---|---|---|
| P1 Validation | -2.438 | 1.034 | 3.297 |
| P1 Reference | -2.062 | 1.138 | 6.812 |
| P2 Validation | -1.969 | -0.1502 | 1.859 |
| P2 Reference | -2.125 | -0.1378 | 3.656 |
Availability — 168 of 168 positions complete; nulls P1 0/15624, P2 0/15624