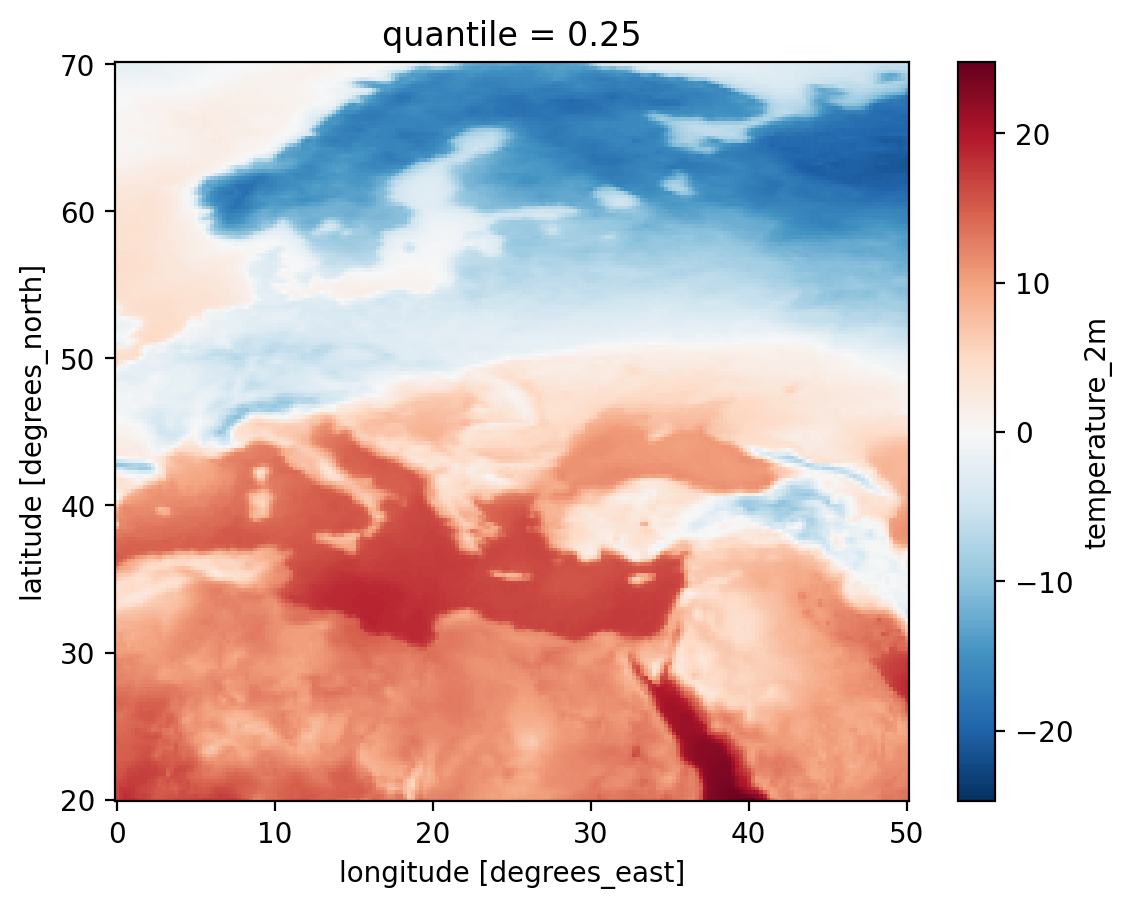
dynamical.org
GFS hourly analysis
ds = xr.open_zarr("https://data.dynamical.org/noaa/gfs/analysis-hourly/latest.zarr")
Weather data is hard to work with. What if it wasn't?
Follow along ↗
dynamical.org
April 2024 temperature
ds["temperature_2m"].sel(time="2024-04-01T00:00").plot()
ds["temperature_2m"] \
  .sel(time="2024-04-01T00:00") \
  .plot()
A plot showing global temperature for 2024-04-01
dynamical.org
April 2024 temperature anomaly
tmp_april_mean = ds["temperature_2m"] \
  .sel(time=ds.time.dt.month == 4) \
  .mean(dim="time")
tmp_april_2024 = ds["temperature_2m"] \
  .sel(time="2024-04") \
  .mean(dim="time")

(tmp_april_2024 - tmp_april_mean).plot()
A plot showing global temperature anomaly for April 2024.
dynamical.org
Where does it rain the most?
(
  ds["precipitation_surface"].sel(
      latitude=slice(70, 20),
      longitude=slice(-150, -30)
  )
  .mean(dim="time") # take the average over ~all time~
  .plot()
)
(
  ds["precipitation_surface"].sel(
      latitude=slice(70, 20),
      longitude=slice(-150, -30)
  )
  .mean(dim="time") # take the average over ~all time~
  .plot()
)
A plot showing all time precipitaiton of North America, revealing the locations where it rains the most overall.
dynamical.org
April 10, 2024 wind speed
import numpy as np

wind_speed = np.sqrt(
  ds["wind_u_10m"] ** 2 +
  ds["wind_v_10m"] ** 2
)
wind_speed \
  .sel(time="2024-04-10T00") \
  .plot(cmap="YlGnBu_r")
A plot showing global wind speeds on April 10th, 2024.